


Giant anteaters (Myrmecophaga tridactyla) are one of the most charismatic Neotropical mammals; however, the overall population trend for the species is decreasing due to numerous threats, including road kill. Population viability analysis (PVA) is an important tool to assess the viability of populations, rank alternative management scenarios and determine research priorities. A detailed baseline model for giant anteaters was developed using data from the literature, fieldwork, researcher expertise and captive populations. A sensitivity analysis was performed to evaluate the relative impact of each parameter on model results to prioritize potential threats and future research efforts. A case study based on three years of research in the Brazilian Cerrado on the impact of vehicle collisions on giant anteaters was tested. Model results showed a potential stochastic growth rate of 5% in the absence of significant threats, and sensitivity testing revealed that mortality rates and the percentage of females breeding are the most sensitive parameters of the model. Using real data for model inputs on road kill as well as sex ratio and age class showed that deaths of giant anteaters due to vehicle collisions decreases the stochastic growth rate of that population by half. Knowledge on the sex ratio of animals killed by vehicles is key to understanding the impact of roads in this polygynous species. This baseline model for giant anteaters can be adapted to populations throughout the species range and is valuable for use in conservation planning for the species.
Giant anteaters (Myrmecophaga tridactyla, Linnaeus 1758) are the largest anteater species and one of the most charismatic Neotropical mammals (Diniz and Brito, 2012). This insectivorous mammal has a wide geographical distribution ranging from Belize and Guatemala to the north, throughout South America, excluding the Andes region, to Northern Argentina (Wetzel, 1985). Despite this wide distribution, the overall population trend for the species is decreasing (Miranda et al., 2014). For instance, the species is considered the most threatened mammal of Central America, and in several parts of its range it is in danger of extinction due to habitat loss, road kill, human-wildlife conflict and sometimes hunting; therefore, this mammal is listed as Vulnerable by the IUCN SSC (Miranda et al., 2014). Several efforts have been made to study the species’ ecology (Shaw et al., 1987; Miranda, 2004; Medri and Mourão, 2005; Miranda et al., 2006; Macedo et al., 2010; Rojano-Bolaño et al., 2015; Di Blanco et al., 2015, 2017). Most of these initiatives have taken place in South America. Furthermore there are several long-term initiatives dedicated to the species (e.g. Anteaters & Highways Project - http://www.giantanteater.org/; Proyeto Hormiguero - https://www.cunaguaro.co/anteater-project; Iberá Project - http://www.proyectoibera.org/en/english/especiesamenazadas_osohormiguero.htm; Instituto de Pesquisa e Conservação de Tamanduás no Brasil - http://www.tamandua.org/). However, there are still important gaps in the knowledge about the basic life history and population biology of this species. This lack of data can be challenging when trying to define conservation strategies and prioritize conservation actions in an effort to maximize effective resource use.
Population viability analysis (PVA) is an important tool used in conservation biology to assess the viability of populations and rank alternative management scenarios (Reed et al., 2002; Radchuk et al., 2016). In addition, PVA is useful for testing the relative importance of model parameters through sensitivity analysis and identifying knowledge gaps (Tuberville et al., 2012). A well-delimited sensitivity analysis is a requisite to identifying parameters that are likely to have a strong effect on the system (Pe’er et al., 2013). This analysis is a good choice to test the impact of uncertainties in the species’ life history parameters and to analyze possible outcomes on the species’ demographics of these uncertainties (Lacy, 2019).
There are basic criteria required to run a PVA (Morrison et al., 2016) and the quality of data used in the models can vary widely depending on the populations involved (Lacy, 2019). This will greatly influence the validity of the model (Lacy, 2019). PVA models have already been built for giant anteaters. Diniz and Brito (2013) based their work on data and a baseline model previously developed in a Ph.D thesis by Miranda (2004), who studied a wild population in Emas National Park, Central Brazil. However, the growth rate of the population modeled was negative even before considering threats. Another model was built to evaluate a re-introduced population in the Iberá Reserve, Argentina, in a diploma thesis by Zamboni (2016), and parameters where based on data collected from that population.
The aim of this study is to design a robust baseline model for giant anteaters where each parameter is clearly explained and tested. For this reason, a sensitivity analysis was also performed to evaluate the relative impact of each parameter on model results to guide future research efforts and better understand potential threats. This baseline model reflects the biological potential of giant anteaters in the absence of significant threat and can be adapted as a conservation tool for any giant anteater project and conservation action plans in the future. Finally, to illustrate the potential use of the baseline model we tested the impact of road kill on a population in the Cerrado of Mato Grosso do Sul State, Brazil.
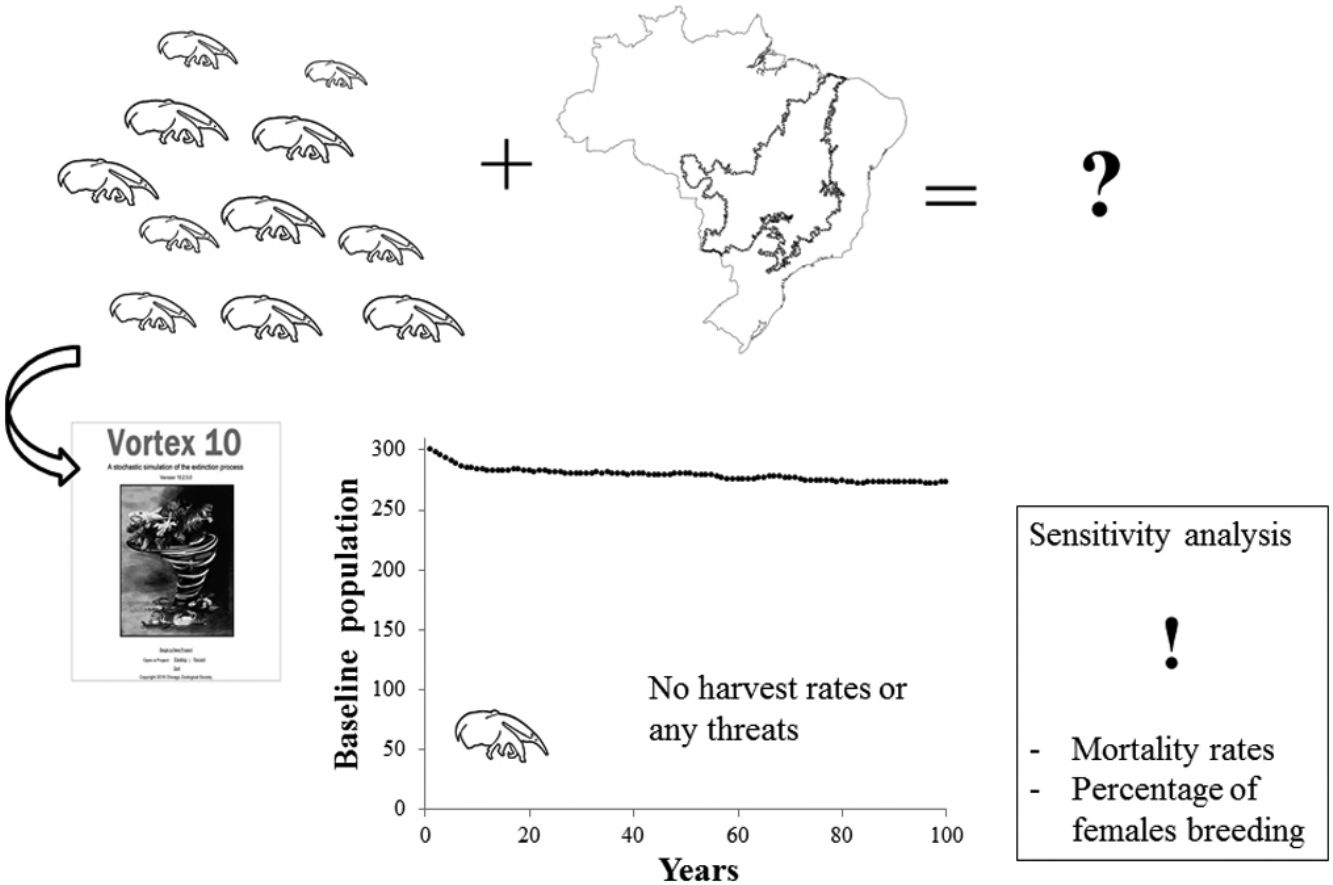
Material and methodsThe baseline population model was built using data based on life history literature, field work conducted by the Anteaters & Highways Project in the Brazilian Cerrado, researchers’ expertise (A.D. and A.B.), and information on the captive population provided by the giant anteater international studbook (Schappert, 2019). We also consulted existent PVAs and used them for comparative purposes. Vortex version 10.3.5.0 (Lacy and Pollak, 2017) was used to generate our PVA models (baseline and case study). This software is an individual-based simulation model that simulates stochastic demographic, genetic and environmental processes from birth to death, throughout each year and for each individual following the parameters and probabilities given by the user.
The Cerrado biome is known as the Brazilian savanna. It is the second largest biome in South America and has been considered as one of the world's hotspots of biodiversity (Mittermeier et al., 1999). This is one of the regions of Brazil that most suffered recent losses of natural vegetation, mainly due to human activities such as agriculture and infrastructure development (Beuchle et al., 2015). Our baseline model was designed to reflect giant anteater life history in this biome, as some key parameters of this baseline were based on field data from Cerrado study sites of Anteaters & Highways project. No harvest rates and no increase in mortality due to road kill, disease or fire were included, as the baseline model was designed to represent a healthy population in the modified landscape of the Cerrado under no significant threat.
Input parameters for simulation modelingScenario settingsEach scenario was simulated 1000 times, using a one-year time step over a period of 100 years to allow long-term population trends to be observed and evaluated. This represents approximately 14 generations assuming a generation time of approximately 7 years for giant anteaters (Supplementary material 1 details demographic data and calculations). The default order of events in each time step was used. Population extinction was defined as occurring when only one sex remained. Table 1 provides all inputs to reproduce our baseline model.
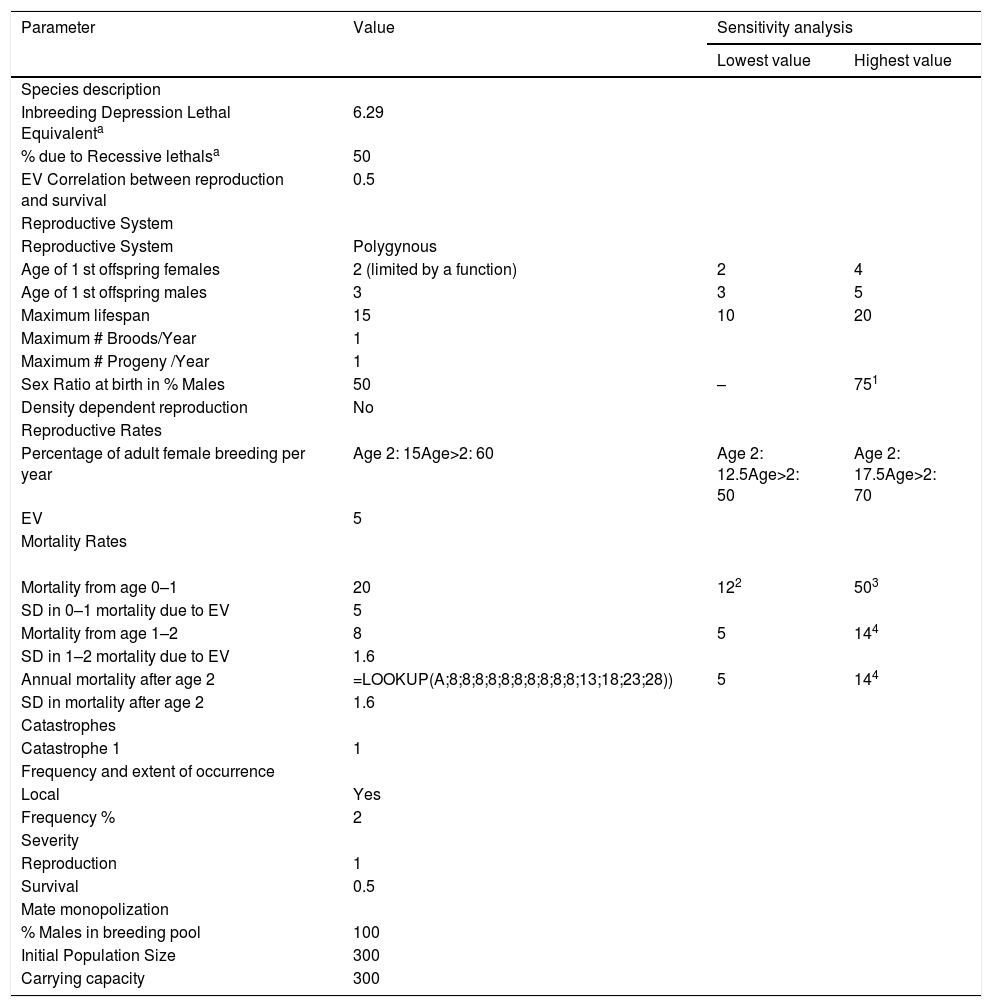
Vortex parameter inputs for the baseline of the giant anteater (Myrmecophaga tridactyla) population model and values used in sensitivity testing.
| Parameter | Value | Sensitivity analysis | |
|---|---|---|---|
| Lowest value | Highest value | ||
| Species description | |||
| Inbreeding Depression Lethal Equivalenta | 6.29 | ||
| % due to Recessive lethalsa | 50 | ||
| EV Correlation between reproduction and survival | 0.5 | ||
| Reproductive System | |||
| Reproductive System | Polygynous | ||
| Age of 1 st offspring females | 2 (limited by a function) | 2 | 4 |
| Age of 1 st offspring males | 3 | 3 | 5 |
| Maximum lifespan | 15 | 10 | 20 |
| Maximum # Broods/Year | 1 | ||
| Maximum # Progeny /Year | 1 | ||
| Sex Ratio at birth in % Males | 50 | – | 751 |
| Density dependent reproduction | No | ||
| Reproductive Rates | |||
| Percentage of adult female breeding per year | Age 2: 15Age>2: 60 | Age 2: 12.5Age>2: 50 | Age 2: 17.5Age>2: 70 |
| EV | 5 | ||
| Mortality Rates | |||
| Mortality from age 0–1 | 20 | 122 | 503 |
| SD in 0–1 mortality due to EV | 5 | ||
| Mortality from age 1–2 | 8 | 5 | 144 |
| SD in 1–2 mortality due to EV | 1.6 | ||
| Annual mortality after age 2 | =LOOKUP(A;8;8;8;8;8;8;8;8;8;8;13;18;23;28)) | 5 | 144 |
| SD in mortality after age 2 | 1.6 | ||
| Catastrophes | |||
| Catastrophe 1 | 1 | ||
| Frequency and extent of occurrence | |||
| Local | Yes | ||
| Frequency % | 2 | ||
| Severity | |||
| Reproduction | 1 | ||
| Survival | 0.5 | ||
| Mate monopolization | |||
| % Males in breeding pool | 100 | ||
| Initial Population Size | 300 | ||
| Carrying capacity | 300 | ||
1,3 Following Diniz and Brito (2013); 2,4 Following Zamboni (2016).
Environmental variation (EV) is the annual variation in reproduction and survival due to variation in environmental conditions. Making EV concordant between reproduction and survival rates means that good years for reproduction and good years for survival (and vice versa) are linked. As there is no information about this for giant anteaters we maintained the default value (0.5 concordance). Inbreeding was modeled as 6.29 lethal equivalents (LE) applied to juvenile (first year) mortality, with 50% of the effect due to recessive lethal alleles. This is the default setting and is based upon inbreeding effects for wild populations from O’Grady et al., 2006. (Supplementary material 1 provides details on inbreeding depression).
State variablesWe created two population state variables (PS1 and PS2) in order to easily modify the breeding probabilities of adult females with age. See the details at Reproductive system and rates below.
Reproductive systemWe incorporated a short-term polygynous mating system, in which animals can select new mates every year. This assumption is based on male territory size, which overlaps with the home ranges of several females and because several males can overlap the same female’s home range (Miranda, 2004; Medri and Mourão, 2005; Macedo et al., 2010; Bertassoni, 2017; Anteaters & Highways pers. comm). In captivity one female reached sexual maturity at 1.5 years old (Knott et al., 2013), and according Schappert (2019) the youngest female in captivity to give birth was 1.7 years. Vortex defines the first age of reproduction as the mean age at which first offspring are born, not the age of sexual maturity and not the earliest recorded age of reproduction. We believe that the average age of first reproduction for females in the wild is around 3 years. However, to take into account potential early births we created a function so that 2-year-old females have a small chance of breeding. Regarding the males, Schappert (2019) registered the youngest male in captivity to sire offspring at 1 year and 3 months, and the average age at first reproduction is listed as 4 years and 11 months (N = 157) with a median at approximately 3 years. We therefore estimated age of first reproduction for males at 3 years of age. We performed sensitivity analysis around both values for age of first breeding (Supplementary material 1 provides extra information about the reproductive system).
Maximum number of broods per year, progeny per brood, and sex ratio at birthAlthough it has been reported (i.e. Santa Barbara Zoo in 2017), twins are very rare in giant anteaters and it is generally believed that giant anteaters only have one progeny per brood (litter) per year (Gaudin et al., 2018). However, there are reports from the field of a female able to raise and wean a pup and give birth to a new pup in less than 12 months (Zamboni, 2016), and in the Anteaters & Highways project three females gave birth to a pup when their previous pup was only nine months. Nevertheless, we assumed that, in general, giant anteaters have only one offspring per year. We took into account the potential for two consecutive offspring within a year in the % of female breeding calculation.
There is no a priori evidence to suggest a skewed sex ratio at birth in the wild. Additionally, Schappert (2019) reports the number of animals born in captivity from the International Studbook since 1980 (excluding unknown sex) as 319 males (46.9%) and 361 females (53.1%). The Anteaters & Highways project captured 50% males and 50% females in the wild (n = 44). Sex ratio at birth is assumed to be 50% (see details in Supplementary material 1).
Percentage of adult female breeding per yearWe assumed that 60% of the females would be reproducing in a given year based on field data from the Anteaters & Highways Project. In one year, in one study area four out seven monitored adult females produced an offspring (57%) and in the other study area four out of eight produced offspring, but one of the females produced two pups in one year raising the percentage (62%). Previous models have used 60% (Diniz & Brito, 2013) and 67% (Zamboni, 2016). We also estimated that 25% of the 2-year-old females could potentially breed at the adult female breeding rate (i.e., 15% probability of breeding at age 2). A small amount of EV was estimated (5%) based on the survival rates of the last six years of reintroduced giant anteater program at Iberá, Argentina (Zamboni, 2016). A sensitivity analysis was also run for this parameter. Although there is a lack of field data it was considered that all adult male giant anteaters are in the breeding pool (i.e., are potential breeders).
Offspring dependency on their dam for X yearsGiant anteaters are known to have intense maternal care for the first year of the pup’s life (Jerez and Halloy, 2003). However, some literature (Gaudin et al., 2018) and recent observations in the field from the Anteaters & Highways Project show a dependency only for the first six months. Given the model yearly time step, we decided not to use this parameter in the baseline model.
Mortality ratesCurrently, there are no good in situ mortality data for giant anteaters. However, Anteaters & Highways project has some data from the 44 individuals monitored during a combined 12,850 individual-days. During this period we recorded three non-road related deaths. Although one of the deaths appears to be due to human activity, we consider that all animals in our study site were subject to human activity and therefore used the death of three adults to calculate an 8% adult mortality rate (see calculations and details in Supplementary material 1). Furthermore, we estimated that after 11 years of age mortality rates would increase by 5% each subsequent year.
We estimated a first-year mortality rate for pups at 20%. Schappert (2019) shows that over 30% of animals die during the first month of life in captivity. However, it is not appropriate to use these captivity results for wild animals; not only are environmental conditions very different, but captive-born offspring are typically monitored from the time of birth, including during the early period of neonatal mortality. For example, from the 32 giant anteaters born in the São Paulo Zoo, 17 completed one month of life and only 12 individuals lived past one year (Leiva and Marques, 2010). At this time none of the pups observed by the Anteaters & Highways Project up to approximately six months of age have died (N = 15). However, as animals are monitored once every two weeks, neonatal pups could have died within the first two weeks of life without the project detecting them. As it is not possible to positively infer visually if a female anteater is pregnant, and as early non-surviving births may not have been detected, the observed percentage of adult females breeding per year (60%) takes into consideration that additional females may have given birth but lost their offspring. Applying a high first-year mortality rate from captivity to an already adjusted lower breeding rate would artificially duplicate neonatal mortality in the model.
EV for mortality rates was included as 25% of the mean for juveniles (5%) and 20% of the mean for sub-adults and adults (1.6%). Given that no data are available to calculate mortality EV, these rates of covariance (20–25 %) are reasonable estimates for relatively stable environments.
Number of catastrophesCatastrophes are singular environmental events that are outside of the bounds of normal environmental variation affecting reproduction and/or survival. These events are modeled in Vortex by assigning an annual probability of occurrence and a pair of severity factors describing their impact on survival (across all age-sex classes) and the proportion of females successfully breeding in a given year. These factors act as multipliers on existing rates and range from 0 (maximum effect) to 1 (no effect), and are imposed during the single year of the catastrophe, after which time the demographic rates rebound to their baseline mean values. Examples of potential catastrophes to giant anteaters include severe fire, disease outbreak, severe accidental poisoning, or severe drought. The annual probability of a population of vertebrates experiencing a die-off of 50% or more is inversely related to generation length, and a particular population has a ∼14% chance per generation of a severe die-off (Reed et al., 2003). Since giant anteaters have a generation length of approximately 7 years (Vortex deterministic results), there is an estimated 14% chance of catastrophic events occurring every 7 years or a 2% chance in any given year. This catastrophe was modeled as having no impact on reproduction but reducing survival by 50%.
Population descriptionWe only included one population in our model, with no immigration or emigration. The model was initialed with 300 individuals and a carrying capacity (K) of 300. The population was probabilistically truncated back to K when the number of subadults and adults exceeded K. No environmental variation was added to the carrying capacity, as variations in habitat quality are accounted for by environmental variation in reproduction and survival. Neither harvest nor supplementation was incorporated into the baseline model.
Sensitivity testing and comparison to other giant anteater PVAsWe provide all baseline parameter inputs and sensitivity test values (Table 1). Minimum and maximum estimated values were used as well as values previously used in other PVAs. We performed sensitivity tests for several demographic parameters, as recommended by Pe’er et al. (2013), varying those parameters over a range of biologically realistic values. We used the following measures to evaluate the effect on model results:
- -
Mean rate of stochastic population growth and its standard deviation (rstoch, (SD)) – This parameter is acquired by the simulated populations, averaged across years and iterations.
- -
Probability of extinction (Pe) – This probability is determined by the proportion of 1000 iterations that go extinct within 100 years.
- -
Mean population size (N-all) – This parameter is related to all simulated populations with standard deviation (SD) across iterations.
- -
Gene diversity (GeneDiv) – This value reflects the mean expected heterozygosity (or gene diversity) remaining in the extant populations.
- -
Mean time to population extinction (MTE) – This value is calculated over a 100-year period.
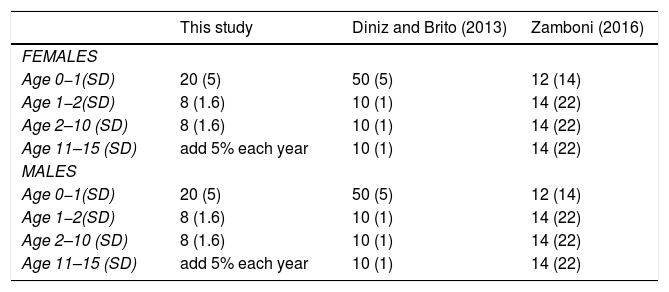
We also used the results of our baseline population growth rates and the impact of mortality on the different age classes and compared to other PVAs (Table 2).
Comparison of mortality rates in giant anteater (Myrmecophaga tridactyla) population viability analysis. Parenthesis indicate SD used for EV.
| This study | Diniz and Brito (2013) | Zamboni (2016) | |
|---|---|---|---|
| FEMALES | |||
| Age 0−1(SD) | 20 (5) | 50 (5) | 12 (14) |
| Age 1−2(SD) | 8 (1.6) | 10 (1) | 14 (22) |
| Age 2–10 (SD) | 8 (1.6) | 10 (1) | 14 (22) |
| Age 11–15 (SD) | add 5% each year | 10 (1) | 14 (22) |
| MALES | |||
| Age 0−1(SD) | 20 (5) | 50 (5) | 12 (14) |
| Age 1−2(SD) | 8 (1.6) | 10 (1) | 14 (22) |
| Age 2–10 (SD) | 8 (1.6) | 10 (1) | 14 (22) |
| Age 11–15 (SD) | add 5% each year | 10 (1) | 14 (22) |
The main goal of the Anteaters & Highways Project is to understand and quantify the impacts of roads – road kills and movement barriers – and their consequences for giant anteater densities, population structure and health; and to define landscape and road management strategies to prevent potential giant anteater local population extinctions. Radiocollars were placed on 44 giant anteaters in three different study areas along three different highways in the Cerrado of Mato Grosso do Sul State. The study sites were all human-modified areas -- typical sites of the Brazilian Cerrado. A total of four anteaters were killed through vehicle collisions: one animal died in each of the two sites, and two animals in one of them.
We ran a Vortex road kill PVA case study to evaluate the impact of road kill on these populations. We used the baseline model created above; however we increased the non-pup annual mortality rates from 8% to 18% (based on 7/44 deaths instead of 3/44 during the 12,850-day study; see calculations used in Supplementary material 1). As in the baseline model after 11 years of age mortality increases every year by 5%.
In the telemetry study all road-killed individuals were adult males. We therefore tested the impact of road kill if only adult males are killed. For comparative purposes we analyzed what would happen if only adult females are killed. In addition, during the same period of time over 600 carcasses of giant anteaters were found while the project surveyed highways. A total of 58 fresh carcasses were found and allowed us to perform sex-determination and necropsies. A total of 31 adult males, three subadult males, two male pups, and 18 adult females, two subadult females and two female pups were found. These extra deaths represented a 10% increase in mortality in giant anteaters (general sex road kill mortality model), an increase in 6% of male deaths and 4% females (male- and female-biased road kill mortality models, respectively). We also tested the impact of road kill when we added the differential proportion of increase in mortality to each age class.
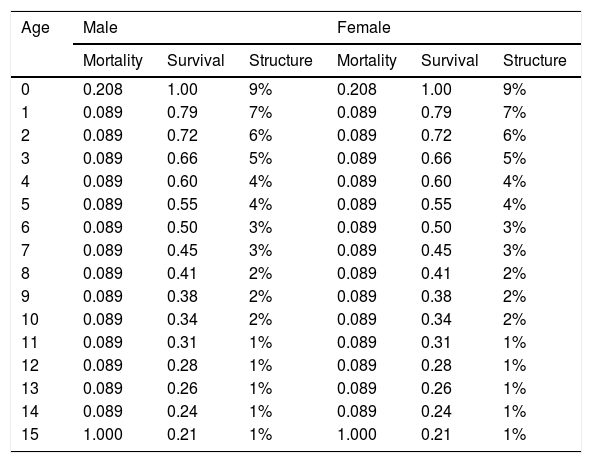
ResultsBaseline modelAccording to results from the Vortex software, the performed baseline model (Table 1) showed a positive growth trend for the population as expected for the biological potential of a species. The deterministic demographic values reflect the biology of the population in the absence of stochastic fluctuations, inbreeding depression, limitation of mates, and immigration/emigration. The baseline model results in a deterministic growth rate (rdet) of 0.063 (λ = 1.065). This represents an annual potential growth rate of approximately 6%. Adult individuals (sexually mature individuals) represent 57% of the population (Table 3) and adult sex ratio is 1:1. Model simulations for a population of 300 individuals resulted in a stochastic growth rate (rstoch) of 0.05 ± 0.1, enabling the population to grow at ∼5% when below carrying capacity. No extinction risk was detected over 100 years, and the mean population size at year 100 was 273 giant anteaters with 95% gene diversity remaining.
Age distribution of male and female giant anteaters (Myrmecophaga tridactyla) resulting from life tables developed from demographic inputs to the model.
| Age | Male | Female | ||||
|---|---|---|---|---|---|---|
| Mortality | Survival | Structure | Mortality | Survival | Structure | |
| 0 | 0.208 | 1.00 | 9% | 0.208 | 1.00 | 9% |
| 1 | 0.089 | 0.79 | 7% | 0.089 | 0.79 | 7% |
| 2 | 0.089 | 0.72 | 6% | 0.089 | 0.72 | 6% |
| 3 | 0.089 | 0.66 | 5% | 0.089 | 0.66 | 5% |
| 4 | 0.089 | 0.60 | 4% | 0.089 | 0.60 | 4% |
| 5 | 0.089 | 0.55 | 4% | 0.089 | 0.55 | 4% |
| 6 | 0.089 | 0.50 | 3% | 0.089 | 0.50 | 3% |
| 7 | 0.089 | 0.45 | 3% | 0.089 | 0.45 | 3% |
| 8 | 0.089 | 0.41 | 2% | 0.089 | 0.41 | 2% |
| 9 | 0.089 | 0.38 | 2% | 0.089 | 0.38 | 2% |
| 10 | 0.089 | 0.34 | 2% | 0.089 | 0.34 | 2% |
| 11 | 0.089 | 0.31 | 1% | 0.089 | 0.31 | 1% |
| 12 | 0.089 | 0.28 | 1% | 0.089 | 0.28 | 1% |
| 13 | 0.089 | 0.26 | 1% | 0.089 | 0.26 | 1% |
| 14 | 0.089 | 0.24 | 1% | 0.089 | 0.24 | 1% |
| 15 | 1.000 | 0.21 | 1% | 1.000 | 0.21 | 1% |
Sensitivity testing was useful to explore uncertainties in parameter estimation and illustrates that input values used for mortality rates, in particular for juveniles and adults, and the percentage of females breeding are the most sensitive parameters of the model (Fig. 1). These parameters require further research in the field to better understand population viability and inform effective conservation actions. Other highly sensitive parameters include highly male-biased sex ratio at birth. Despite skewed birth sex ratios rates used in previous models (Diniz and Brito, 2013; Miranda, G.H.B, 2004) we are confident in using an equal sex ratio at birth. Male reproductive lifespan had little effect on model results, as would be expected for a polygynous species. The higher the certainty for these sensitive parameters the higher the confidence in the model results. The values for mortality rates varied greatly between this study and the other PVAs. This is understandable if other models were developed to represent populations under particular threats or different conditions.
 population viability analysis. The horizontal line at 5% represents the stochastic growth rate of the base. Mort_0−1: Mortality rates of Juveniles aged 0–1 years Mort_AD: Mortality rates of Adults % F_breeding: Percentage of females breeding F_Last_R: Age of last reproduction of females F_A_1_R: Age of first reproduction of females Mort_SubAD: Mortality rates of sub adults M_1_R: Age of first reproduction of males M_Last_R: Age of last reproduction of male")
Sensitivity analysis results for different scenarios regarding Vortex parameters of giant anteater (Myrmecophaga tridactyla) population viability analysis. The horizontal line at 5% represents the stochastic growth rate of the base.
Mort_0−1: Mortality rates of Juveniles aged 0–1 years
Mort_AD: Mortality rates of Adults
% F_breeding: Percentage of females breeding
F_Last_R: Age of last reproduction of females
F_A_1_R: Age of first reproduction of females
Mort_SubAD: Mortality rates of sub adults
M_1_R: Age of first reproduction of males
M_Last_R: Age of last reproduction of male
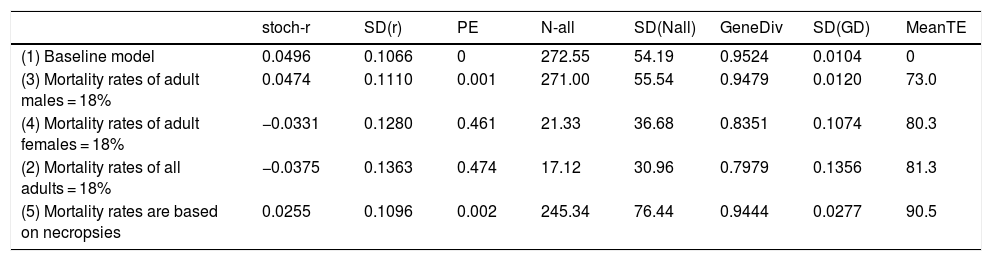
When mortality rates where adjusted using the sex ratio obtained from necropsies according to the data collected by the Anteaters & Highways Project in a 50% reduction in the stochastic growth rate of the population compared to the baseline model. While growth is still over 2% per year (Table 4), the population is much less resilient to other threats and slower to recover from catastrophic decline. If only males are lost due to road kill the overall impact is low, while if only females are killed the population is driven to extinction with a probability of extinction of 46% over 100 years (Table 4). Not surprisingly, a similar result is observed if higher mortality due to road kill is applied to both males and females, i.e., Pe = 47% over 100 years.
Impact of road kill on giant anteater (Myrmecophaga tridactyla) in different scenarios: (1) baseline in which no road mortality is incurred; (2) adult male mortality is increased to 18% (females remain at 8%); (3) female mortality is increased to 18% (males remain at 8%); (4) adult mortality rates of both sexes are increased from 8% to 18%; (5) mortality rates are increased according to the proportions found in necropsied road kills (ranging from 8% to 13%). stoch-r and SD(r) are the stochastic growth rate and it’s the standard deviation; PE is the probability of extinction of the population. N-all is the mean population size and it’s the standard deviation; GeneDiv is the genetic diversity and it’s the standard deviation; MeanTE is the mean time to extinction.
| stoch-r | SD(r) | PE | N-all | SD(Nall) | GeneDiv | SD(GD) | MeanTE | |
|---|---|---|---|---|---|---|---|---|
| (1) Baseline model | 0.0496 | 0.1066 | 0 | 272.55 | 54.19 | 0.9524 | 0.0104 | 0 |
| (3) Mortality rates of adult males = 18% | 0.0474 | 0.1110 | 0.001 | 271.00 | 55.54 | 0.9479 | 0.0120 | 73.0 |
| (4) Mortality rates of adult females = 18% | −0.0331 | 0.1280 | 0.461 | 21.33 | 36.68 | 0.8351 | 0.1074 | 80.3 |
| (2) Mortality rates of all adults = 18% | −0.0375 | 0.1363 | 0.474 | 17.12 | 30.96 | 0.7979 | 0.1356 | 81.3 |
| (5) Mortality rates are based on necropsies | 0.0255 | 0.1096 | 0.002 | 245.34 | 76.44 | 0.9444 | 0.0277 | 90.5 |
Attempts to determine the relative contribution of different life history parameters to population growth rates are an important part of population biology of any species (Caswell and Hastings, 1980). Our baseline model represents the biological potential of giant anteaters based on the parameters previously described focusing in the Cerrado biome. Although, we understand that this model does not represent a realistic simulation of giant anteater populations over its distribution range, it does provide the basis upon which future models can be developed. Researchers that have specific data on threats, for example, or on immigration and dispersal of individuals between populations may use the baseline model to construct more complex models; this is an important feature since data scarcity is probably a major limitation in assessing population viability (Radchuk et al., 2016).
A systematic review of PVA studies found that details of the baseline scenario were often lacking (Pe’er et al., 2013). Morrison et al. (2016) re-ran 90 PVA baseline models from the literature, 40% of which failed to be reproducible and therefore not available for future extended use. This paper provides a very detailed baseline model to avoid these restrictions and ensure that this study is repeatable and can be reproduced by other giant anteater projects.
Sensitivity analysis is a tool used to evaluate the robustness of a model to variations in parameter values (Tuberville et al., 2012). Our empirical evaluations of different models in sensitivity testing demonstrate that the more robust the model is to variations in a particular parameter, the less sensitive the model results are to the input values of that parameter. Our results show that the percentage of females breeding and mortality rates, particularly those of younger age classes, should be research priorities to increase the robustness of the baseline model. Age of first and last reproduction of males should not be a research priority for PVA analysis as they have very little influence on the overall model results for this polygynous species. While mortality rates are probably specific to particular conditions in each study site, the percentage of females breeding may be more related to female reproductive health (Amendolagine et al., 2018), which may or may not be associated with study site. Our results suggest that mortality rates, percentage of female breeding, and age at first reproduction for females should be research priorities in future studies (Fig. 1 and Supplementary material 2). This knowledge – key life parameters – will only be accurately achieved with long-term studies.
Bearing in mind that our baseline is reflecting a giant anteater scenario in the Brazilian Cerrado biome we applied an estimated annual mortality rate of 8% up to age 11 years, adding an additional 5% each subsequent year. Since this is a sensitive parameter this value must receive attention when conducting giant anteater PVAs for specific populations and in other biomes. Mortality rates may be lower in protected areas or higher in areas or populations under high anthropogenic threat.
Baseline values should be carefully analyzed when preparing and running PVA simulations (Pe’er et al., 2013); parameters need to make biological sense. These decisions made by researchers are essential to avoid incomprehensive and unreliable application of parameters (Morrison et al., 2016). This would avoid errors, such as the one that occurred in past giant anteater PVAs (Diniz and Brito, 2013 based on Miranda, 2004) when they erroneously estimated the sex ratio at birth. This parameter (Fig. 1 and Supplementary material 2) can greatly influence model results due the polygynous mating system. Male-biased sex ratios used in previous models traced back to the Ph.D thesis of Miranda (2004), where he used a male-biased sex ratio in the model developed due to the capture of more males than females. There is evidence in the literature that males are captured and collared more often than females (Shaw et al., 1987; Medri and Mourão, 2005; Bertassoni, 2017). However, in the Anteaters & Highways Project we captured 1M:1 F and we believe there is no a priori evidence to suggest a skewed sex ratio at birth in the wild. One potential explanation for a male-biased sex ratio in captures is that researchers usually only collar adult individuals and usually refrain from capturing females with pups on their back to prevent injury of the pup. This could decrease the number of females captured at any given time. Another possibility is that males move more than females and therefore are more prone to be captured (Bertassoni, 2017). In captivity the sex ratio at birth is not male biased (Schappert, I., 2019). Finally, sex ratio at birth cannot be inferred by adult sex ratios. A bias in the sex ratio of the adult population are much more likely due to differential mortality rates rather than skewed sex ratio at birth and are likely to be threat based and population specific.
Giant anteaters are impacted by road presence throughout their distribution (Freitas et al., 2014; Ribeiro et al., 2017; Ascensão et al., 2017). Our case study of the impact of road kill on wild giant anteaters applied our baseline model with real data collected during three years on the impact of vehicle collisions. Model results based on these observed road kill rates suggest that mortality due to road kill may not necessarily lead to the extinction of local populations of giant anteaters but may reduce the stochastic growth rate by half, reducing the population’s resilience and ability to withstand or recover from the other anthropogenic threats. It could actually be more than half as the population is slower to grow out of smaller, more vulnerable population sizes. Our case study model does not consider potential additional impacts of future habitat loss, pesticides, dog attacks, disease outbreaks or fire, but it does suggest that road kill may make local extinctions more likely if other threats occur. This example also clearly demonstrates the importance of gathering detailed data on threats. The impact of road kill was very different depending upon the sex ratio of the animals killed. The loss of females due to vehicle collisions can be more impacting and can even lead to local extinction, whereas road kill of males has little effect at the rates tested. This is standard for a polygynous species, in which females are the limiting sex on reproduction and population growth. Therefore, information on sex ratio and age class of road-killed giant anteaters is key to interpreting the influence of this threat on the population.
PVA models are living models, in the sense that they must be continuously updated as better or new data are compiled or available. The model proposed here has limitations; for example, we did not incorporate density-dependency into our PVA due to lack of data, although such processes often have effects on population dynamics and extinction risk if relevant for the species (Pe’er et al., 2013; Morrison et al., 2016). In addition, the field data used in this model for key parameters are only based on a few years of observations, which require caution when interpreting the model (Lacy, 2019)
ConclusionThe incorporation of the sensitivity analyses using PVA techniques can guide conservation efforts for different species. Here, we provide a complete and detailed presentation of PVA input parameters for the giant anteater, which can be used for conservation planning for the species. As more data about the species become available from long-term projects this model should be updated. The model should also be adapted to local realities, where threats not considered here will need to be included. We hope that long-term projects studying giant anteaters can generate extensive population-level data to accurately estimate demographic parameters, following research recommendations outlined here, to create more robust PVA models in the future.
Conflict of interestNone.
We thank the owners of over 50 ranches in the Cerrado of Mato Grosso do Sul, especially Fazenda Nhuvera and Santa Lourdes for their hospitality and generous support and permission to track animals on their land. We are grateful to Debora Yogui, Mario Alves, Danilo Kluyber and the numerous project trainees for their help in the field. Core funding for the Anteaters & Highways Project was provided by Fondation Segre as well as 20 other institutions, mostly zoos in North America and Europe listed at http://www.giantanteater.org/. Vortex PVA software (Lacy & Pollak 2014) was provided under a CreativeCommons Attribution-NoDerivatives International License, courtesy of the Species Conservation Toolkit Initiative (https://scti.tools).
The following are Supplementary data to this article:

