


Scorpions have high levels of endemism and their distributions are typically narrow, making them particularly vulnerable to changes in their environment. Unfortunately, little is known about the status of scorpion conservation worldwide. Here, we compiled information on scorpion diversity across the world and highlighted Mexican scorpion diversity. We created and overlapped scorpions’ hotspots with the Mexican system of protected areas. We also modeled the potential distribution area of 24 wide distributed scorpion species under current and future scenarios to evaluate their vulnerability to climate change considering full and null dispersal models, and calculated the percentage of their distribution that will be protected by the natural protected areas in the future. Our results indicate that while Mexico has the greatest diversity of scorpion species compared to any other country in the world, these animals are not sufficiently protected by the system of natural protected areas under neither current nor under future climatic conditions. In terms of climate change vulnerability, we assessed the impact to these species if their migration to future more climatically suitable areas is not feasible. However, if full migration is feasible for species with broad ecological habitats, nine species might have a more widespread distribution, including three species with medical importance (Centruroides spp.).
Scorpions are among the oldest extant animal groups, appearing around 433–438 mya (Dunlop and Selden, 2013; Waddington et al., 2015). Despite their body plan having remained almost unaltered since their origin, they have colonized different ecosystems and spread almost all over the world, except for Antarctica, the boreal areas and some oceanic islands (Polis,
1990; Prendini, 2005; Santibáñez-López et al., 2016). Unfortunately, they have traditionally been feared because of their dangerous stings rather than appreciated because of their evolutionary history, diversity and potential use in pharmacology (e.g. Ortiz et al., 2015); this situation translates into scorpions being unwanted and not considered for conservation.
Although scorpions are a taxonomically well-studied invertebrate group with several researchers working on its systematics, their inventory is still incomplete. Nevertheless, countries like Cuba (e.g. Teruel and Kovarik, 2012), China (e.g. Cao et al., 2014), Iran (e.g. Navidpour et al., 2010), Mexico (e.g Santibáñez-López et al., 2016) and the Southern area of Africa (sensuPrendini, 2005) have made important efforts to list the diversity of these arachnids. Through this information it is possible to affirm that Mexico stands out for its scorpions' diversity (almost 12% of scorpions’ diversity worldwide) (Santibáñez-López et al., 2016) and that as far as we know (Supplementary Material S1), there are very few studies focusing on scorpion conservation or ecology globally (but cf. Sissom and Hendrixson, 2005). What is known about this arachnid group is that in general they exhibit limited dispersal ability (Prendini, 2001; Sissom and Hendrixson, 2005; Bryson et al., 2013) and narrow geographic distributions, making some species highly vulnerable to changes in their environment, such as climate change. Climate change has been reported to be one of the major threats to biodiversity (IPCC, 2014) and there are limitations associated with evaluating the potential impacts on the distribution of scorpion species. Ecological niche modeling is an ecological tool that relates geographic records with their environment, creating a bioclimatic envelope with suitable conditions (bioclimatic niche) that is transferable in space and time (Peterson et al., 2011). It has been a useful tool to initiate insight on species vulnerability to climate change (Araújo et al., 2005).
In the present study, we aimed to: a) evaluate the vulnerability of scorpions to climate change, and b) evaluate the performance of the current NPA system in Mexico to protect this group of animals under future climate models. To achieve these objectives, first we highlight the relevance of the scorpion diversity in the country; then, we identify species and family hotspots that are currently protected by the NPA system in Mexico (the putative most scorpion diverse country worldwide). Using ecological niche modeling, we then model the distribution of all species and project their potential distribution under different climate change scenarios. Finally, we overlap these potential distributions over the NPA system and determine the percentage of area that will remain protected in the short (2015−2039) and long term (2075−2099).
Material and methodsScorpion diversity and current conservation statusTo highlight the importance of Mexican scorpion diversity, we compiled taxonomic species lists from 19 countries and one territory following the latest published scorpion systematics (Sharma et al., 2015; Santibáñez-López et al., 2018, 2019; shown in Supplementary Material S1).
To create a preliminary map of the scorpion diversity protected by the Mexican NPA system, we divided Mexico into 25-km2 cells, counted the number of species registered at each cell to find species hotspots, and overlapped our map with the current Mexican NPA map. We decided to keep the 25-km2 resolution criterion given the area size of the NPA system. In this way, it was possible to count the number of species protected by each NPA and at what percentage. This same exercise was carried out to create hotspots considering a higher taxonomic category, such as families. This category was favored because of the number of records. Species records were mainly taken from the Portal de Datos Abiertos UNAM (https://datosabiertos.unam.mx), which harbors data from the Colección Nacional de Arácnidos (CNAN). This database was examined by two of us (CESL and GCF) and all dubious records were discarded. In addition, data from the available literature on Mexican scorpion systematics (e.g. González-Santillán and Prendini, 2013; Santibáñez-López et al., 2016; Contreras-Félix and Francke, 2019) was also considered and included. Records from other databases (e.g. GBIF) were revised but not considered because most of them have species delimitation problems.
Evaluating climate change vulnerabilityThe ecological niche-modeling tool helps to identify geographically optimal environmental conditions by relating species records with environmental variables. A bioclimatic profile is created and can be looked for in other geographic areas or other times (Peterson et al., 2011). This approach has been very useful for climate change studies by evaluating how much area with optimal conditions will decrease, increase or shift in the forthcoming decades; information that helps suggesting where money and conservation effort should be focused.
Field records used in this study were taken by national and international scorpion experts, coming mainly from the Colección Nacional de Arácnidos, Instituto de Biología, UNAM which is the most well maintained, corroborated and complete data base for Mexican scorpions. In addition, we included geographical data from the original species descriptions when available. We geographically visualized these data before starting the modeling procedure and analyzed each datum to confirm that the species were observed in these distribution ranges. We also decided to use a minimum record distance of 10-km2 between data as a way of mitigating sampling bias in case it existed in specific parts of the country.
From the scorpion species reported in Mexico, we decided to model the most widely disperse species that passed our filters of quality information (curated by us, with more than five records). Most scorpion species in Mexico have very restricted distributions and consequently few unique geographic records with a 10-km2 resolution (Stockwell and Peterson, 2002). However, following the suggestion made by Pearson et al. (2007), we validated all modeled species with a jackkinfe procedure (all of which had < 25 records) (Table 1) to test the predictive capacity of our models with low data numbers. The jackkinfe procedure proposed by Pearson and collaborators involves performing n-1 replicates, leaving out one single training data each time. Each model is then evaluated to determine whether it suitably predicts the excluded locality. We continued our analyses with the 24 species that performed well in the jackknife procedure (Pearson et al., 2007) (a success rate of at least 60% and P < 0.01).
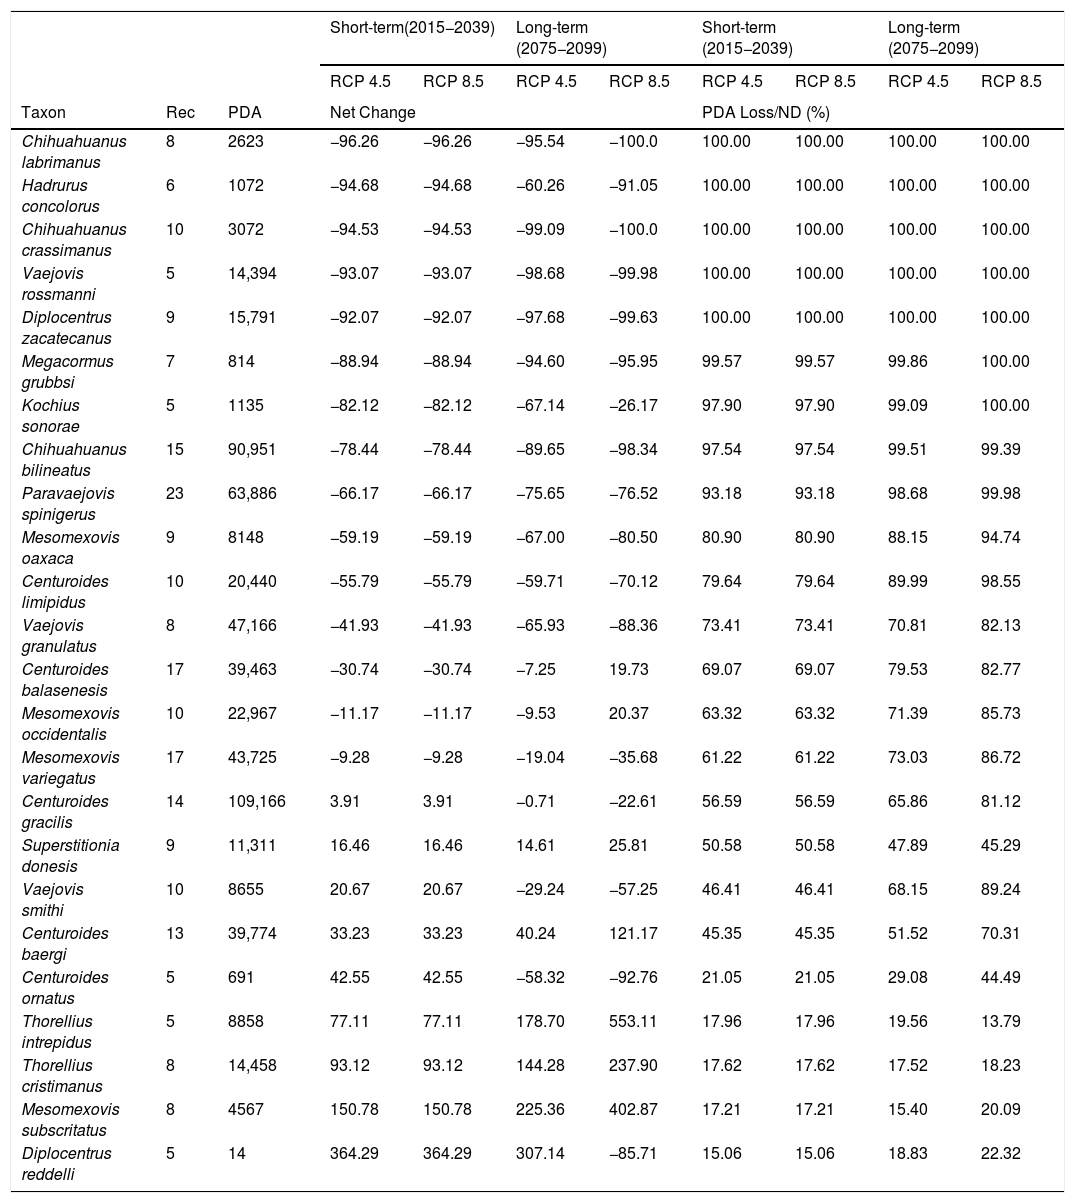
Scorpions net change and area loss without dispersion. Taxon = species evaluated, Rec = Number of unique records in a 10 km2 resolution, PDA (Potential Distribution Area) = Number of climatically suitable pixels, Net change = The change in climatically suitable pixels’s numbers between current model and future model with full dispersal and PDA Loss/ND (%)= Percentage of climatically suitable pixels loss considering no dispersal.
| Short-term(2015−2039) | Long-term (2075−2099) | Short-term (2015−2039) | Long-term (2075−2099) | |||||||
|---|---|---|---|---|---|---|---|---|---|---|
| RCP 4.5 | RCP 8.5 | RCP 4.5 | RCP 8.5 | RCP 4.5 | RCP 8.5 | RCP 4.5 | RCP 8.5 | |||
| Taxon | Rec | PDA | Net Change | PDA Loss/ND (%) | ||||||
| Chihuahuanus labrimanus | 8 | 2623 | −96.26 | −96.26 | −95.54 | −100.0 | 100.00 | 100.00 | 100.00 | 100.00 |
| Hadrurus concolorus | 6 | 1072 | −94.68 | −94.68 | −60.26 | −91.05 | 100.00 | 100.00 | 100.00 | 100.00 |
| Chihuahuanus crassimanus | 10 | 3072 | −94.53 | −94.53 | −99.09 | −100.0 | 100.00 | 100.00 | 100.00 | 100.00 |
| Vaejovis rossmanni | 5 | 14,394 | −93.07 | −93.07 | −98.68 | −99.98 | 100.00 | 100.00 | 100.00 | 100.00 |
| Diplocentrus zacatecanus | 9 | 15,791 | −92.07 | −92.07 | −97.68 | −99.63 | 100.00 | 100.00 | 100.00 | 100.00 |
| Megacormus grubbsi | 7 | 814 | −88.94 | −88.94 | −94.60 | −95.95 | 99.57 | 99.57 | 99.86 | 100.00 |
| Kochius sonorae | 5 | 1135 | −82.12 | −82.12 | −67.14 | −26.17 | 97.90 | 97.90 | 99.09 | 100.00 |
| Chihuahuanus bilineatus | 15 | 90,951 | −78.44 | −78.44 | −89.65 | −98.34 | 97.54 | 97.54 | 99.51 | 99.39 |
| Paravaejovis spinigerus | 23 | 63,886 | −66.17 | −66.17 | −75.65 | −76.52 | 93.18 | 93.18 | 98.68 | 99.98 |
| Mesomexovis oaxaca | 9 | 8148 | −59.19 | −59.19 | −67.00 | −80.50 | 80.90 | 80.90 | 88.15 | 94.74 |
| Centuroides limipidus | 10 | 20,440 | −55.79 | −55.79 | −59.71 | −70.12 | 79.64 | 79.64 | 89.99 | 98.55 |
| Vaejovis granulatus | 8 | 47,166 | −41.93 | −41.93 | −65.93 | −88.36 | 73.41 | 73.41 | 70.81 | 82.13 |
| Centuroides balasenesis | 17 | 39,463 | −30.74 | −30.74 | −7.25 | 19.73 | 69.07 | 69.07 | 79.53 | 82.77 |
| Mesomexovis occidentalis | 10 | 22,967 | −11.17 | −11.17 | −9.53 | 20.37 | 63.32 | 63.32 | 71.39 | 85.73 |
| Mesomexovis variegatus | 17 | 43,725 | −9.28 | −9.28 | −19.04 | −35.68 | 61.22 | 61.22 | 73.03 | 86.72 |
| Centuroides gracilis | 14 | 109,166 | 3.91 | 3.91 | −0.71 | −22.61 | 56.59 | 56.59 | 65.86 | 81.12 |
| Superstitionia donesis | 9 | 11,311 | 16.46 | 16.46 | 14.61 | 25.81 | 50.58 | 50.58 | 47.89 | 45.29 |
| Vaejovis smithi | 10 | 8655 | 20.67 | 20.67 | −29.24 | −57.25 | 46.41 | 46.41 | 68.15 | 89.24 |
| Centuroides baergi | 13 | 39,774 | 33.23 | 33.23 | 40.24 | 121.17 | 45.35 | 45.35 | 51.52 | 70.31 |
| Centuroides ornatus | 5 | 691 | 42.55 | 42.55 | −58.32 | −92.76 | 21.05 | 21.05 | 29.08 | 44.49 |
| Thorellius intrepidus | 5 | 8858 | 77.11 | 77.11 | 178.70 | 553.11 | 17.96 | 17.96 | 19.56 | 13.79 |
| Thorellius cristimanus | 8 | 14,458 | 93.12 | 93.12 | 144.28 | 237.90 | 17.62 | 17.62 | 17.52 | 18.23 |
| Mesomexovis subscritatus | 8 | 4567 | 150.78 | 150.78 | 225.36 | 402.87 | 17.21 | 17.21 | 15.40 | 20.09 |
| Diplocentrus reddelli | 5 | 14 | 364.29 | 364.29 | 307.14 | −85.71 | 15.06 | 15.06 | 18.83 | 22.32 |
To choose the ecological niche algorithm to be used in this study, we carried out a pilot test with the five scorpion species with highest recorded numbers (at least 15 records): Centruroides balsasensis Ponce-Saavedra & Francke, 2004, Centruroides baergi Hoffmann, 1932, Chihuahuanus bilineatus (Pocock, 1898), Mesomexovis variegatus (Pocock, 1898) and Paravaejovis spinigerus (Wood, 1863); and modeled their distribution with the nine different algorithms (MaxEnt, GAM, GBM, CTA, ANN, SER, FDA, MARS and RF) provided by the BIOMOD platform (Thuiller et al., 2009) in R (R Development Core Team, 2018). With these five species, record numbers were sufficient to carry out cross-validation, splitting our data in training (70%) and validating points (30%). We then validated our models with the most common validation tests used in ecological niche modeling: the true skill statistic (TSS), the area under the receiver operating characteristic curve (ROC) and the kappa statistic (KAPPA) (Allouche et al., 2006). The algorithms that best performed were MaxEnt and GBM. MaxEnt (Phillips et al., 2006) has already proved to have a good performance for modeling species distribution (Warren and Seifert, 2011). This method is a generative algorithm representing a great advantage when using scarce data (Phillips et al., 2006; Pearson et al., 2007). The GBM (Gradient Boosting Machine) is a machine-learning algorithm that, instead of fitting a model in a parameter space, it fits the model in a function space (Friedman, 2001). The GBM algorithm has shown robustness in species distribution modeling by capturing complex process-environment relationships giving very realistic outcomes (Hjort and Marmion, 2009). To increase MaxEnt performance, it has been suggested to evaluate different parameter combinations (features and regularization multiplier) for each species (Supplementary Material S2) through the ENMeval tool (Muscarella et al., 2014). ENMeval helps identifying the proper features prior to model building. It has been proven that using the default parameters, especially with small samples, can result in very different distribution maps (Muscarella et al., 2014). ENMeval also helps to increase performance when modeling takes place across space and time (Muscarella et al., 2014). The ENMeval tool uses as a first criterion to evaluate MaxEnt models with different features and a regularization multiplier, the sample-corrected Akaike information criterion (AICc). This criterion penalizes model complexity, an element that has to be controlled in order to increase extrapolation capability (Moreno-Amat et al., 2015). Among those models with small AICc, we used two more model-selection criteria: the area under the curve (AUC) value (metric to test predictability) and the parsimony principle. We then created 10,000 random pseudo-absences and used all records as training data.
We used the BIOMOD platform to carry out both algorithms chosen simultaneously. BIOMOD is a modeling system that automatically creates different ensemble types. Ensembles have been helpful in diminishing uncertainty coming from algorithms and climate models (Araújo and New, 2007), being desirable in analyses as the one presented in this work. We kept the mean-weight ensemble rule, which is the weighted sum of the model probabilities when the model performance is at least TSS ≥ 0.7 (Thuiller et al., 2009). To create a binary map for the ensemble, we used TSS maximization as a criterion. We decided to create binary maps to facilitate the interpretation of our results. We also took advantage of the BIOMOD platform to automatically calculate the suitable area that will be lost or gained in the future in the presence or absence of full dispersal (new potential distribution area).
To calibrate our models, we used different geographic areas for each evaluated species considering Mexican ecoregions instead of geopolitical limits (the M from the BAM diagram; Soberón and Nakamura, 2009). With this approach, projections are expected to be more ecologically meaningful (Peterson et al., 2011). Within each specific area for each species, we used monthly climate surfaces to create 19 bioclimatic variables that represent annual, seasonal and extreme climatic trends (Nix, 1986). We are aware that there are other environmental factors that influence scorpion species distribution (see e.g. Polis, 1990; Prendini, 2005); however, in this study we focused on bioclimatic variables since we wanted to evaluate the impact of climate change.
To obtain the bioclimatic variables, we used the biovars function of the dismo package (Hijmans and Elith, 2015) in R (R Core Team, 2017). We then carried out a correlation analysis of climatic variables for each species and discarded variables if their correlation was higher than 0.9, which are not expected to add more information to the model and could even increase overfitting and reduce extrapolation performance (Steen et al., 2017) (Supplementary Material S2). We used a regionalized climatology with a 1-km2 resolution under current (1961–2000) and future (short term, 2015−2039; and long term, 2075−2099) climatic conditions (Centro Meteorológico Nacional http://atlasclimatico.unam.mx/AECC_descargas/) under the worst-case representative concentration pathway (RCP) +8.5 W/m2, and under a more optimistic scenario +4.5 W/m2 (IPCC, 2014). The RCPs are greenhouse gas concentration pathways that relate to how much energy will stay on Earth instead of being projected to space, thus increasing temperature. Consequently, the W/m2 unity stands for the energy in watts that stays on Earth per m2.
We used a regionalized weighted atmospheric circulation scenario (REA, Reliability Ensemble Averaging) of general circulation models (IPCC, 2014), which gives more weight to those models that have better performance in projecting climate in different areas of Mexico (Ibarra-Cardeña et al., 2013). General circulation models are one of the greatest sources of uncertainty in climate-change vulnerability analyses (Steen et al., 2017), and using REA is a way to account for this vulnerability. We also used the ExDet tool (Mesgaran et al., 2014) to evaluate how bioclimatic variables range and combinations change under different climatic scenarios in the future (short and long term) in comparison to the current scenario. This tool allowed us to examine the geographic areas where greater changes will take place and extrapolation will be needed (Supplementary Material S3) (Mesgaran et al., 2014).
Once the species distribution modeling under future climatic conditions were created, we overlapped them with the NPA system in Mexico to evaluate the percentage of each species potential distribution area that will be protected in the future.
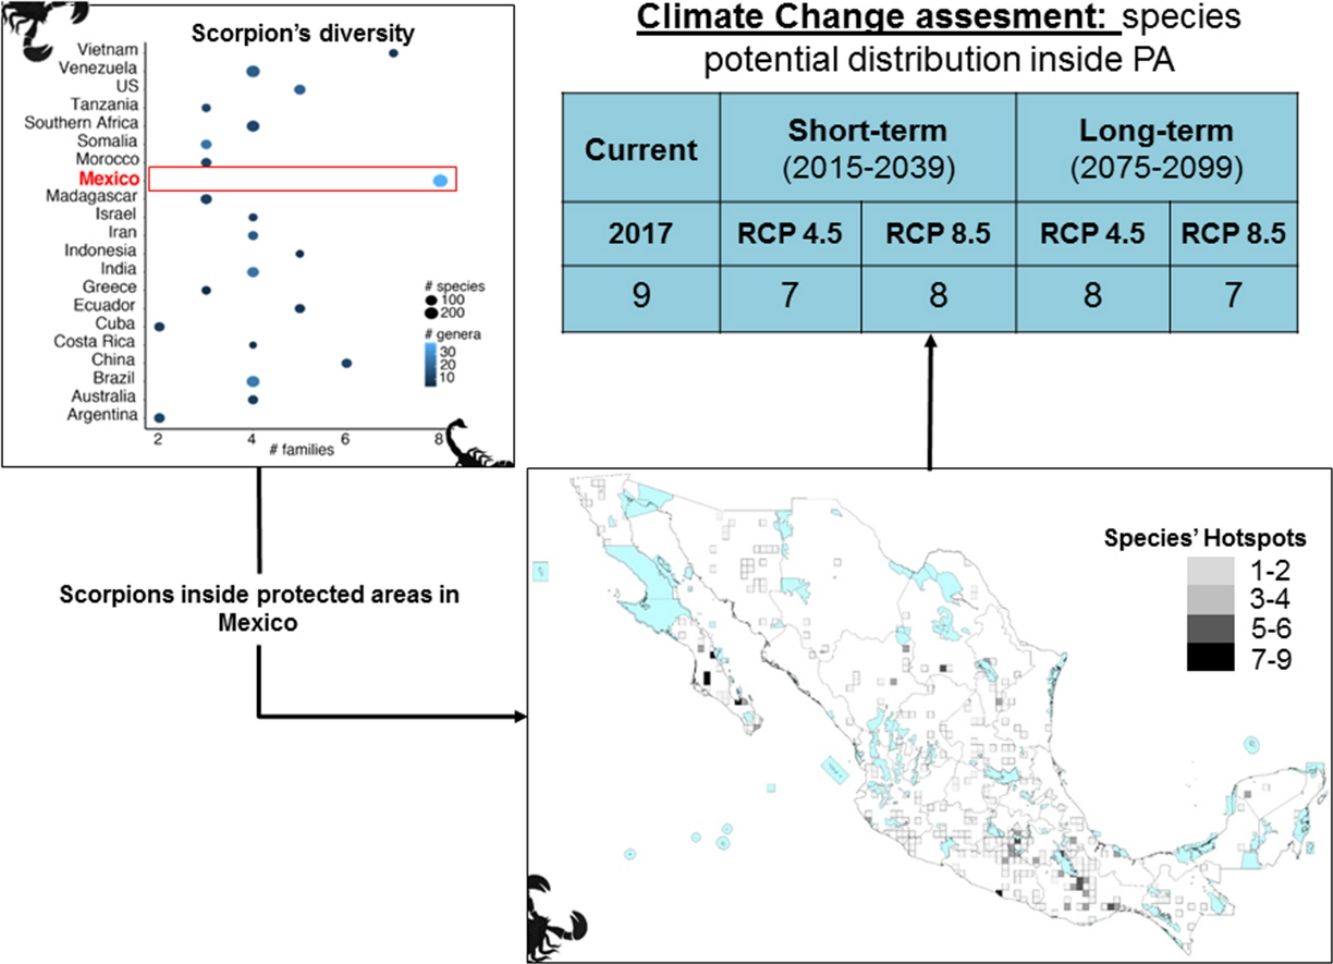
ResultsScorpion diversityGiven the current knowledge of the scorpion fauna, Mexico has the highest number of species (294), followed by Venezuela (199) (Fig. 1a; Supplementary Material S1). Furthermore, endemism is high in Mexico with 10.7% (245) of all scorpion species and 9% (19) of the scorpion genera (Supplementary Material S1). Despite having a limited sampling of its territory, Mexico's richness is quite dense (with a density of 0.015 spp/km2, Fig. 1b). Even if higher taxonomical categories are subjective, family diversity is a good indicator of a diversity-rich area (Lourenco et al., 2000). Eight families have been recorded in Mexico (Fig. 1a; Supplementary Material S1), whereas only six can be found in China or Vietnam, both with lower species and genera counts.
 Scorpion species, genus and family richness in 19 countries and one territory (Southern Africa). In the “x” axis the number of families, number of genera per country is indicated by the intensity of coloration of the circle (lighter represents more genera) and the size of the circle indicates the number of species (the bigger the circle the more species). (b) Correlation of species richness and the area in km2 per country or territory (US is only represented by the area of 11 states in which scorpions have been reported). (c) Heatmap of the number of species per family (in phylogenetic order) and their representation in each country. Warm colors indicate fewer species. Phylogeny was modified from Coddington et al. 2004, Santibáñez-López et al., 2019). (d) A subdadult female of Typhlochactas sp. (Typhlochactidae), a representative from the endemic family in Mexico (highlighted in red in panel c; photo courtesy of Jorge Mendoza).")
(a) Scorpion species, genus and family richness in 19 countries and one territory (Southern Africa). In the “x” axis the number of families, number of genera per country is indicated by the intensity of coloration of the circle (lighter represents more genera) and the size of the circle indicates the number of species (the bigger the circle the more species). (b) Correlation of species richness and the area in km2 per country or territory (US is only represented by the area of 11 states in which scorpions have been reported). (c) Heatmap of the number of species per family (in phylogenetic order) and their representation in each country. Warm colors indicate fewer species. Phylogeny was modified from Coddington et al. 2004, Santibáñez-López et al., 2019). (d) A subdadult female of Typhlochactas sp. (Typhlochactidae), a representative from the endemic family in Mexico (highlighted in red in panel c; photo courtesy of Jorge Mendoza).
Taken together, this information evidences hotspots of scorpion species diversity in the Mexican states of Baja California Sur, Coahuila, Guerrero, Oaxaca, Morelos and Yucatán (Fig. 2B). These hotspots have between five and nine different species. In particular, Baja California Sur has the greatest species richness, reaching up to nine species in 25 km2, followed by Coahuila and Oaxaca. None of these hotspots is under protection by an NPA (Fig. 2B). Other hotspots with fewer species in Coahuila, Oaxaca, Puebla and Morelos do overlap with existing NPAs: Cuatro Ciénegas, Don Martín, Tehuacán-Cuicatlán and Corredor Biológico Chichinautzin, respectively.
 Species records inside a natural protected area, B) species hotspots and C) family hotspots. The area in blue indicates the area of the natural protected area system.")
In terms of family richness, Baja California Sur was also the state with the highest family richness, reaching up to six different families in a 25-km2 cell (Fig. 2C). Other hotspots with fewer families can be found in Puebla, Oaxaca, Guerrero and Veracruz. Of these family hotspots, only one is protected by an NPA, located in the Tehuacán-Cuicatlán NPA, Puebla state (Fig. 2C).
Scorpion vulnerability to climate changeThe range change in bioclimatic variables between scenarios was very small for the short term in both RCPs. Only small areas in the north of the country have changes in ranges in comparison with the current scenario, which reduced the level of extrapolation needed (Supplementary Material S3). There is a similar situation in the long-term RCP 4.5; however, there is a more important extrapolation need in around 30% of the territory for the long-term RCP 8.5. Uncertainty in our ecological niche modeling increases when more extrapolation is needed. Consequently, greater precaution needs to be taken with this RCP (Supplementary Material S3 and S4).
Both individual models, MaxEnt and GBM, as well as the weighted ensembles had a model performance of TSS > 0.7 and full AUC > 0.9. If we assume no dispersal of scorpions in the forthcoming decades, all the evaluated species are expected to reduce their potential distribution area (PDA; see column PDA Loss/ND in Table 1). In other words, geographical regions with optimal climatic conditions inside their current distribution area will decrease in both time periods considered (2015−2039 and 2075−2099). However, if species dispersal ability is considered, new PDAs are expected to appear in other geographic regions, resulting in a less negative net change. If we take into account this net change, in the short term for RCP 4.5 and 8.5 W/m2, 15 out of the 24 evaluated species are expected to have negative net changes. This result means that more species are expected to lose rather than win PDA. Similarly, in the long term this tendency can also be seen, with 18 and 17 species having negative net changes under the two different scenarios evaluated, RCP 4.5 and RCP 8.5 W/m2, respectively (Table 1).
Still, with or without dispersal, the three most vulnerable species are Chihuahuanus labrimanus, Hadrurus concolorus Stahnke, 1969 and Chihuahuanus crassimanus (Pocock, 1898). They lose their entire current distribution area, but also will gain very little suitable area in the future. Consequently, even if they had free dispersal abilities, they would have very few climatically suitable areas to go. Other species that lose their entire current PDA under a future evaluated scenario are Vaejovis rossmanni, Diplocentrum zacatecanus Hoffmann, 1931, Megacorums grubbsi Sissom, 1994 and Kochius sonorae (Williams, 1971). Finally, Vaejovis rossmanni Sissom, 1989, Diplocentrum zacatecanus Hoffmann, 1931 and Chihuahuanus bilineatus were species with very negative net changes.
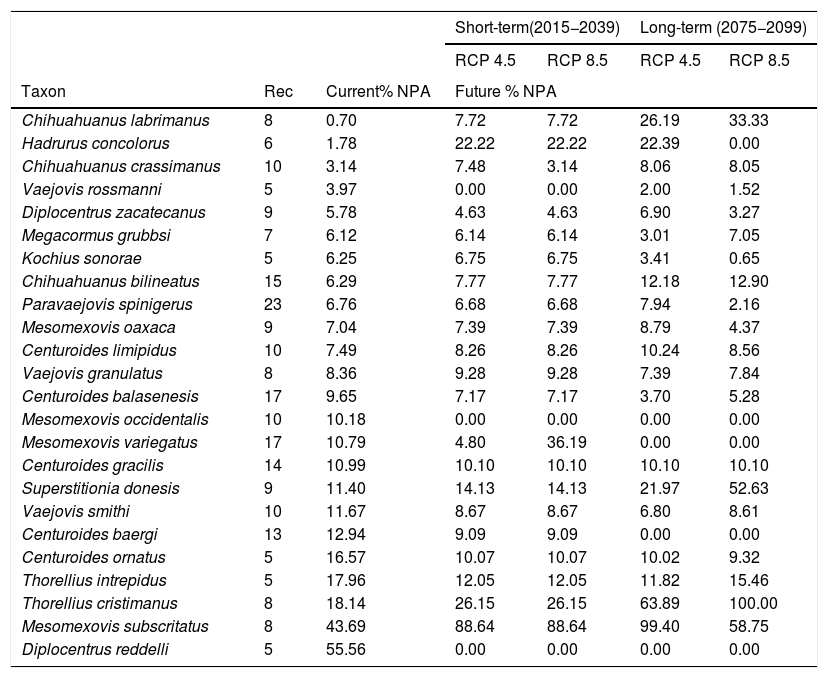
All modeled species had a percentage of their PDA in an NPA under current climatic conditions, although this varied widely among species and went from a minimum of 0.7 % to a maximum of 55.56 % (Table 2, Supplementary Material S4). The average percentage of protected PDA under current conditions was 12.21 % and it did not differ significantly (Mann-Whitney-Wilcoxon test, P > 0.5) from the PDA that will be protected in the future (short and long terms). Nevertheless, 10 species out of 13 did not reach even 10 % of their PDA inside an NPA under current climatic conditions and up to 17 species did not under future climatic conditions (Table 2).
Scorpions percentage in protection under current and future climatic conditions. Taxon = species evaluated, Rec = Number of unique records in a 10 km2 resolution, Current % NPA = Percentage of climatically suitable pixels under current climatic conditions in a Natural Protected Area (NPA) and Future % NPA = Percentage of climatically suitable pixels under future climatic conditions in a Natural Protected Area (NPA).
| Short-term(2015−2039) | Long-term (2075−2099) | |||||
|---|---|---|---|---|---|---|
| RCP 4.5 | RCP 8.5 | RCP 4.5 | RCP 8.5 | |||
| Taxon | Rec | Current% NPA | Future % NPA | |||
| Chihuahuanus labrimanus | 8 | 0.70 | 7.72 | 7.72 | 26.19 | 33.33 |
| Hadrurus concolorus | 6 | 1.78 | 22.22 | 22.22 | 22.39 | 0.00 |
| Chihuahuanus crassimanus | 10 | 3.14 | 7.48 | 3.14 | 8.06 | 8.05 |
| Vaejovis rossmanni | 5 | 3.97 | 0.00 | 0.00 | 2.00 | 1.52 |
| Diplocentrus zacatecanus | 9 | 5.78 | 4.63 | 4.63 | 6.90 | 3.27 |
| Megacormus grubbsi | 7 | 6.12 | 6.14 | 6.14 | 3.01 | 7.05 |
| Kochius sonorae | 5 | 6.25 | 6.75 | 6.75 | 3.41 | 0.65 |
| Chihuahuanus bilineatus | 15 | 6.29 | 7.77 | 7.77 | 12.18 | 12.90 |
| Paravaejovis spinigerus | 23 | 6.76 | 6.68 | 6.68 | 7.94 | 2.16 |
| Mesomexovis oaxaca | 9 | 7.04 | 7.39 | 7.39 | 8.79 | 4.37 |
| Centuroides limipidus | 10 | 7.49 | 8.26 | 8.26 | 10.24 | 8.56 |
| Vaejovis granulatus | 8 | 8.36 | 9.28 | 9.28 | 7.39 | 7.84 |
| Centuroides balasenesis | 17 | 9.65 | 7.17 | 7.17 | 3.70 | 5.28 |
| Mesomexovis occidentalis | 10 | 10.18 | 0.00 | 0.00 | 0.00 | 0.00 |
| Mesomexovis variegatus | 17 | 10.79 | 4.80 | 36.19 | 0.00 | 0.00 |
| Centuroides gracilis | 14 | 10.99 | 10.10 | 10.10 | 10.10 | 10.10 |
| Superstitionia donesis | 9 | 11.40 | 14.13 | 14.13 | 21.97 | 52.63 |
| Vaejovis smithi | 10 | 11.67 | 8.67 | 8.67 | 6.80 | 8.61 |
| Centuroides baergi | 13 | 12.94 | 9.09 | 9.09 | 0.00 | 0.00 |
| Centuroides ornatus | 5 | 16.57 | 10.07 | 10.07 | 10.02 | 9.32 |
| Thorellius intrepidus | 5 | 17.96 | 12.05 | 12.05 | 11.82 | 15.46 |
| Thorellius cristimanus | 8 | 18.14 | 26.15 | 26.15 | 63.89 | 100.00 |
| Mesomexovis subscritatus | 8 | 43.69 | 88.64 | 88.64 | 99.40 | 58.75 |
| Diplocentrus reddelli | 5 | 55.56 | 0.00 | 0.00 | 0.00 | 0.00 |
Positive impacts in terms of PDA caused by climate change could also be seen. The top five species with higher positive net changes were the following species: Diplocentrus reddelli, Mesomexovis subcristatus (Pocock, 1898), Thorellius cristamanus (Pocock, 1898), Thorellius intrepidus (Thorell, 1876), C. ornatus and C. baergi (Table 1). Of these, D. reddelli had over 50% of their PDA protected by a NPA under current conditions and is not being protected in the future (Table 2).
DiscussionWe are still far from having a complete worldwide taxonomical inventory of scorpions, but as of today, Mexico is the most important country in terms of scorpion taxonomic diversity and, consequently, studies about their ecology and conservation status under current and future conditions should be given importance. Besides their evolutionary value, they are also important because their venom has been shown to have value for drug development against human diseases, such as bacterial infections and cancer (e.g. Ortiz et al., 2015). Invertebrates have not been the targets of conservation efforts in Mexico or at a global level (e.g. Myers et al., 2000). This lack of effort becomes clear when we evaluate the role of NPAs in protecting scorpion hotspots (species and families) under current climate conditions. None of the most important scorpion hotspots is currently protected. The hotspots with the highest species richness, which were also the ones with the highest family richness, found in Baja California Sur, are currently unprotected by any NPA. This is an area of great importance due to its unique diversity, potentially resulting from paleoclimatic changes leading to a speciation through vicariance (Prendini, 2005; Sissom and Hendrixson, 2005). The fact that this area is not protected does not necessarily mean a lack of political will, but probably a dearth of scientific knowledge, and thus there is a need for more ecological and conservation studies on scorpions and invertebrates in general. We propose that new NPAs should be decreed in upcoming years or the limits of the NPAs should be revised. In delineating these areas, we strongly recommend considering those hotspots with higher (species and family) counts. Under future scenarios, the level of protection (percentage of potential distribution area inside a NPA) at the species level does not change significantly, and even when the PDA is larger than the real distribution, most of the species have less than 10% of their current and future PDA within an NPA. This situation means that scorpions will remain unprotected under future climatic conditions.
In general, all evaluated species present reductions in their PDA if dispersal is not taken into account, especially in the long term. The reality is that, even if scorpions did not find any type of barrier to their dispersion, most species do not display great dispersal abilities (Prendini, 2005), increasing their vulnerability to climate change. The species most vulnerable to climate change were Ch. labrimanus, H. concolorus, Ch. crassimanus, V. rossmanni and D. zacatecanus. Not only do they lose their current distribution, but gain little area in the future. From these five species D. zacatecanus is one of the species least protected by an NPA. Diplocentrus zacatecanus is a fossorial species, inhabiting burrows dug on the soil (Santibáñez-López and Francke, 2013). It depends entirely on the granulometry and humidity of the soil, factors closely related to climate (Polis, 1990).
If full dispersal is assumed, nine species showed positive net changes in their distribution, meaning that gains in PDA are greater than its losses. Three out of these nine species belong to the genus Centruroides. Some species within this genus have life history characteristics suggesting that they are opportunistic species (Polis, 1990), meaning that they display plasticity in their development stages, greatly accelerated maturity, and many clutches per year. In addition to this, to our knowledge, all Centruroides species are lapidicolous (sensuPrendini, 2001); therefore, their mobility is greater than that of those building burrows (e.g., fossorial species in the Diplocentrus genus). Unfortunately, these species also represent a health problem for humans, so an increase in their distribution may be a cause of concern (e.g. Francke and Córdova-Athanasiadis, 2011). Consequently, we would recommend making a risk analysis map under climate change with species belonging to this genus (more records and field work is needed), because in terms of climate, their distribution is expected to shift to places where they have never before been recorded (including highly populated areas, Ureta et al. in prep.).
It is important to bear in mind that extrapolations under climate change will always represent a risk. In terms of ecological niche modeling, results can vary depending on the decisions taken. We tried to mitigate uncertainty by: a) taking a data base that has been revised in detail by experts (some of these data have been published), b) evaluating the performance of different algorithms for suitability (Steen, 2017), c) carrying out algorithm ensembles (Araújo et al., 2017) and d) diminishing model complexity with ENMeval to improve extrapolations (Moreno-Amat et al., 2015). However, the greatest uncertainty source comes from general circulation models (Steen, 2017) that in this case we tried to mitigate by using REA instead of a single circulation model. Nevertheless, there is an important range change in 11 bioclimatic variables in the long-term RCP 8.5 W/m2. Consequently, results under this model need to be taken with precaution.
Conflict of interestNone.
We would like to thank CONACyT for the economic support to Carolina Ureta as a “Catedrática CONACyT” and the economic support to Gerardo Contreras. Carlos Santibanez was supported partially by a postdoctoral CONACYT fellowship. We would also like to thank Ángela Cuervo-Robayo for giving us scientific advice.
The following are Supplementary data to this article:

