


Ecologists commonly use ecological niche models (ENMs) to undertake invasive species risk assessments; however, knowledge shortfalls introduce bias in these models and increase uncertainty while addressing questions in biogeography. Therefore, our objective was to investigate how the lack of information related to population viability impairs invasive species risk assessments. We built ENMs for the invasive slider turtle (Trachemys scripta) and compared the native and invaded portions of its niches. Both analyses were generated based on two approaches: a conservative one, which excluded occurrence records where the establishment of invasive populations was not confirmed; and a non-conservative one, which encompassed all occurrence records. Under the conservative approach, the niche similarity test revealed that the similitude between native and invasive populations was not different than the expected by chance. Conversely, under the non-conservative approach, the test revealed that native and invasive populations use a similar ecological niche, despite that the occupied portion of the species’ niche during the invasion was quite larger than the native one. In fact, non-conservative models projected wider areas with high risk of invasion that were not detected by the conservative approach. While models’ outcomes were markedly different, both provide valuable information in terms of evolution and conservation. We found that information about population viability is really valuable and should be incorporated in risk assessment, invasive records without this information should not be discarded under any point of view. Finally, we discussed the best way to consider this kind of information to assess the management of invasive species.
Invasive species are a major cause of species extinctions worldwide (Bellard et al., 2016; Gurevitch and Padilla, 2004; Lowe et al., 2000). This global phenomenon not only generates huge economic losses (Pimentel et al., 2005; Simberloff et al., 2013) and affects human health (Bayliss et al., 2017; Pimentel et al., 2000), but also heavily impacts natural environments, their biodiversity and delivery of ecosystem services (Campbell and Donlan, 2005; Nogales et al., 2006; Walsh et al., 2016). Thus, it is essential to have the capacity of anticipating the consequences of biological invasions before they impact on native communities.
Ecologists have used ecological niche models (ENMs) to map suitable areas for potential invaders and, therefore, to guide conservation and management strategies (Gama et al., 2017; Jiménez-Valverde et al., 2011; Nori et al., 2011a; Sales et al., 2017). These models establish correlations among environmental conditions and species occurrence records, to identify suitable climatic conditions (Broennimann et al., 2012; Gallagher et al., 2010). It has been highlighted that invasive species frequently show a wider range of climatic conditions during the invasion process, than those described in their areas of origin (Peterson and Nakazawa, 2008; Beaumont et al., 2009; Gallagher et al., 2010; Rodrigues et al., 2016), i.e. they can invade areas where climatic conditions are different to those manifested in their native ranges. Thus, in order to capture a major proportion of suitable conditions for the invader, ENMs must be calibrated considering both the native and invasive geographic ranges of the species (Fitzpatrick et al., 2008, 2007; Peterson and Nakazawa, 2008; Sales et al., 2017).
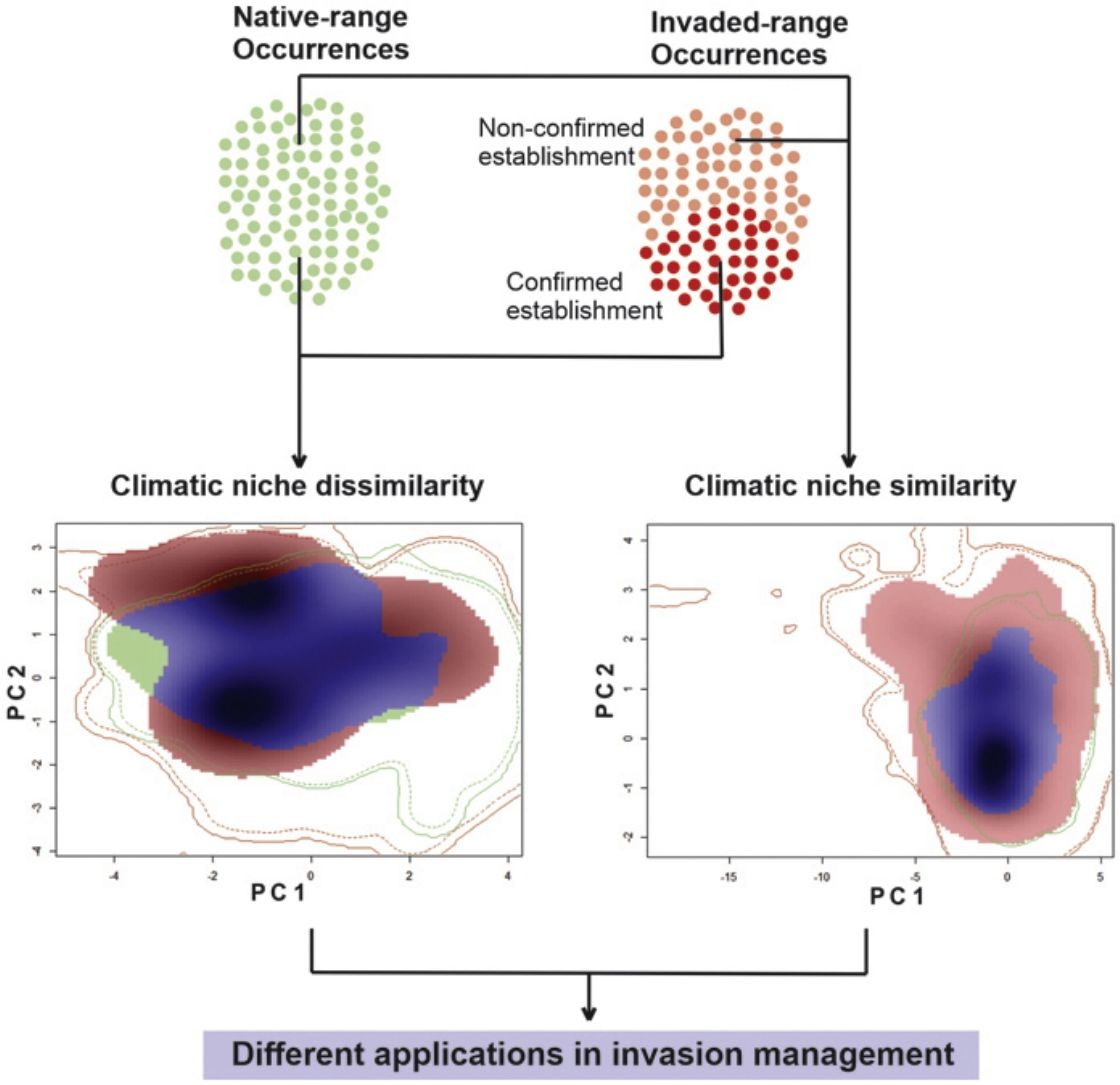
Typically, during ENM calibration it is assumed that all native records belong to the realized niche of the species (i.e. where the species is able to complete its life cycle). However, outside the native range, this is especially problematic given the lack of information associated with the demography of invasive populations. For example, there is uncertainty associated to the information of occurrence records inside the invaded range, because those records could reflect occasional sampling or even isolated individuals under unsuitable climatic conditions to complete the life cycle of the species. This lack of information is especially important in wide developing countries, where the conservation/research investments are scarce and the (invaded) surface great. In any case, this uncertainty precludes the researcher to infer about population viability within the invaded range. In the context of the BAM diagram of Soberón and Peterson (2005) and Soberón (2007), the area of intersection among the three major factors: biotic (B; also called bionomic factors), abiotic (A; or scenopoetic factors) and mobility (M; the area of accessibility), define the area of presence, or the geography of occupation (Go) and it is usually the area of interest when the tackled question is related with the species distribution. But when the focus of study is an invasion phenomenon, arises another area defined by the BAM diagram, and it is the area of intersection between A and B, that leaves outside the M factor. This particular area has been defined as the area of potential invasion (Gi) and represents the area that satisfy all environmental (A) and species-interaction elements (B) for the species presence, except for the ability to access to such region in the geography (M). However, as soon as populations can jump the accessibility barriers, the area of potential invasion (Gi) become occupied areas (Go). Invasive occurrences (both, non-confirmed and established), as the natives, should be in the intersection of B, A, and M (i.e. areas with scenopoetic and biotic suitable conditions inside of the accessible areas which gradually increase as the invasion advance).
Considering the above-mentioned issue, it has been proposed that ENMs should be calibrated only with those records where populations have been established, and therefore, discarding records where there are no signs of reproductive activity (e.g. Nori et al., 2017; Rödder et al., 2009; Rodrigues et al., 2016). The main consequence of such modeling approach is the exclusion of a great deal of information, which could be valuable in terms of prevention, but for which there is no certainty about the population viability (i.e. regions of the space containing environmental parameters capable of producing positive growth rates). In fact, other authors have theoretically assessed the problem and suggested that, given the context, it is crucial the inclusion of all available information about the climatic tolerance of invasive species (Jiménez-Valverde et al., 2011), which could lead important commission errors in predictions associated with the inclusion of non-established populations in model calibration. In this context, we analyze how lack of information related to population viability impairs invasive species risk assessments for a highly invasive species, the slider turtle Trachemys scripta, by comparing the performance and geographic projections of models in which we excluded occurrence records where the establishment of invasive populations has not been confirmed, with those where all occurrence records were considered.
MethodsSpecies occurrence recordsFor reptiles, in particular, pet trading is a major cause of invasive species introduction (Auliya et al., 2016; Bush et al., 2014; Capinha et al., 2017). Here, we used the dataset of Kikillus et al. (2010) (complemented by Nori et al. (2017)), which gathers occurrence records from all over the world, for both native and non-native geographical ranges for the slider turtle Trachemys scripta. While the dataset was generated from an extensive literature review from scientific publications, online database, and wildlife field guides, most of the data comes from Kikillus et al. (2010), complemented by Nori et al. (2017). For each record it was included whether the successful breed was reported in both, native and invaded ranges (information included in Kikillus et al. (2010) and Nori et al. (2017)). If an occurrence record did not list breeding status, even if successful breeding was highly likely (e.g. juveniles found in the wild), it is considered as non-confirmed establishment of the population. Thus offering a clear distinction between invasive populations that has been confirmed as established, and those for which there are no reliable information on their establishment.
We rearranged the dataset into five data subsets: two datasets for ecological niche modelling, with information on both the native and invaded ranges; the former contained 213 records that includes the native records, and only those whose populations within the invaded ranges were confirmed as established, hereafter named ‘conservative’ dataset. The second ‘non-conservative’ dataset which held 440 records, encompassing all the records from the first data subset, and those from invasive populations for which there is no information on their establishment. The remaining three additional subsets were generated for ecological niche comparisons of the native and invasive portions of Trachemys scripta climatic niche: a ‘native’ data subset with 155 records from the native range of the species, an ‘invaded’ subset with 227 records comprising all the information from the invaded range, and an ‘invaded & established’ subset with 58 records from the invaded range and confirmed as biologically-established populations.
Climatic variablesWe considered 19 bioclimatic variables at 30 arc-seconds (∼1 km2) resolution from the WorldClim project (Hijmans et al., 2005). First, we developed a Pearson’s correlation test to select those variables with low collinearity (<0.75) although the next selection of variables also included biological criteria such as the knowledge of natural history and physiological limits of the slider turtle (Rödder et al., 2009), retaining for our analyzes four bioclimatic variables. Freshwater turtles, in general, depend heavily on the availability of water bodies for survival, therefore annual precipitation and precipitation in the driest quarter were variables included in the final dataset. Also, turtles are ectothermic, oviparous, and mainly diurnal; so reproduction, activity periods, feeding and survival are all strongly related to the availability of thermal energy (Buckley and Kingsolver, 2012); thus, the annual mean temperature (in accordance with an energy balance throughout the year; Rödder et al., 2009) and the mean diurnal range of temperatures, were also included.
Climatic backgroundGiven the crucial role of the extent of the selected area for model calibration (Barve et al., 2011), we defined the historical accessible areas for the species (Soberón and Peterson, 2005) taking into account its dispersion capacity, by using a buffer considering the maximum distance between two adjacent established populations in the native geographical range of the species (Nori et al., 2017). The resulting buffer radius was of 300 km approximately. In addition, given the implications of restricting calibration areas based on natural history of species; we considered only those pixels overlapping with permanent waterbodies as rivers, ponds, and lakes and its buffer areas (Nori and Rojas-Soto, 2019). River networks, watershed boundaries, drainage directions, and flow accumulation information, was obtained from the global river network HydroSHEDS at 30 arc-seconds resolution (available at www.hydrosheds.org). Thus, we generated a specific climatic background for each of the five modelled conditions (‘native’, ‘invaded’, ‘invaded & established’, ‘conservative’, and ‘non-conservative’) considering the selected bioclimatic variables constrained by the HydroSHEDS network raster. When a record was not exactly located in a permanent waterbody (less than 5% of the total records for each dataset), using “average nearest neighbor algorithm” in GIS platform, we relocated the record in the nearest pixels corresponding to a water body. In addition, we used the above mentioned buffer to create a climatic envelope considering all the presence locations for each condition.
Comparison between native and invasive nichesIn order to investigate whether the comparison between climatic requirements manifested in the native and invasive ranges of the species, is influenced by the lack of information associated with the establishment of invasive populations; first, we evaluated the climatic similarity between the portions of the niche of the species characterized with a conservative approach (i.e by comparing the ‘native’ and ‘invaded but established’ datasets), hereafter named as NAE comparison. Then, the same analysis was performed between niches under a non-conservative approach characterized with the ‘native’ and ‘complete & invasive’ datasets (named as NAC comparison). We used the niche similarity tests (Broennimann et al., 2012) available in the package ‘ecospat’ (Di Cola et al., 2017) for R ver. 3.1.2 (R Development Core Team, 2008).
The niche similarity test comprises several consecutive steps, starting with an ordination technique (PCA) used to transform the selected variables (carefully chosen and described in “Climatic variables” in methods) into two uncorrelated linear combinations (PC1 and PC2) of the original variables. The PCA is then calibrated using environmental values from all the pixels of both the native and the invaded study areas. The axes of the PCA thus maximize the ecological variance present in the study areas. Then the PCA scores of the two distributions, for which the niches must be compared, are projected onto a grid of cells bounded by the minimum and maximum PCA scores in the study areas. A smoothed density of occurrences for each species in each cell of the grid is then estimated using a kernel density function, and the global overlap between the niches can be calculated using the metric Schoener’s D (or Hellinger’s I, but see Broennimann et al. (2012) and di Cola et al. (2017) for details of the procedure and metrics). In order to evaluate the statistical significance of D, all the occurrences (of each comparison) are pooled and randomly split into two datasets, maintaining the number of occurrences as in the original datasets, and the niche overlap statistic D is calculated. This process is repeated throughout 100 times randomizations and a histogram of simulated D values is constructed. The null hypothesis (H0) determines whether the observed overlap between the two niches, is not different than the simulated overlap between random niches (null models) in the study area. The alternative of the test (H1) can be set to “greater”, which means that rejection of H0 indicates that the two niches are more similar than would be expected by chance, directing the result towards to niche conservatism. On the opposite, if H1 is set to “lower”, rejection of H0 indicates that the two niches are less similar than expected by chance, indicating niche divergence. In our study, we wanted to test for niche conservatism, so we used the alternative “greater”, i.e. the niche overlap is more similar than random expectations. Furthermore, the number of background points used for the analysis was limited to 1000.The Schoener’s D metric spans from 0 to 1, where 0 means no overlap between native and invasive portions of the niche, and 1, a complete overlap between them. These analyses also allow us to calculate three a-posteriori metrics: Niche Stability (i.e. the proportion of the native region of the niche represented in the exotic region), Niche Unfilling (i.e. proportion of the native region of the niche not found in the exotic region), and Niche Expansion (i.e. region of the niche space occurring only in the exotic region) in both comparisons, NAC and NAE.
Ecological niche modellingWe followed the suggestion of Qiao et al. (2015) to choose the models with highest accuracy, arising from different modeling algorithms, in order to arbitrarily avoid the selection of one particular model. We initially built the models using five algorithms: surface range envelope (SRE), generalized linear models (GLM), maximum entropy algorithm (MAXENT), random forest (RF), and classification tree analysis (CTA). These algorithms were implemented through “biomod2” package (Thuiller et al., 2016) with the same model parameterization (Table S1). We then selected the maximum entropy algorithm (MAXENT Ver. 3.4.3.e; Phillips et al., 2006), based on its highest AUC values (see Table S2). We used the additional settings in Maxent: maximum number of background points: 1000, number of iterations = 500, convergence threshold = 0.00001, regularization value = 1, but with five replicates using subsample as run type. We did not allow the algorithm to perform clamping or extrapolation, as suggested by Owens et al. (2013), to avoid artificial extrapolations of extreme values of environmental variables.
For each dataset used to perform the ENMs (‘conservative’ and ‘non-conservative’), we randomly selected 75% of the records for calibration and the remaining 25% for model evaluation to generate the Receiver Operating Characteristic (ROC) curve and evaluate the area under it (AUC; Fielding and Bell, 1997). However, due to the critics that this test has received (Lobo et al., 2008; Peterson et al., 2008), as additional evaluation criterion, we calculated the partial-ROC (pROC) to provide a more robust evaluation of predictions from the resulting ENMs (Peterson et al., 2008).
The environmentally peripheral, but stable populations, are supposed to be precisely those that are most informative about the limits of tolerance for the species (Jiménez-Valverde et al., 2011). Accordingly to this and in order to avoid an important lack of information, we reclassified ENMs into binary maps using a threshold considering an omission error of 1%, which is a permissive threshold and it was suggested for invasive species (e.g. Nori et al., 2011a, b; Rodda et al., 2011). On the other hand, by tolerating 1% of omission error, we avoided marginal spurious projections associated with the major problems of the datasets.
ResultsThe niche similarity test for NAE showed that the observed similarity does not differs from the expected by the null models (Schroener’s D = 0.310, P = 0.198, Fig. 1-A); with a mild expansion (NE = 0.369), an unfilling region of the native niche (NU = 0.110), and a relative high niche stability (NS = 0.630). In contrast, the niche similarity test for NAC showed that the observed similarity differs from the expected by the null models (Schoener’s D: 0.372, P = 0.039, Fig. 1-B), suggesting niche conservatism between both niches. In addition, the invaded region of the niche captured all the climatic variability of the ecological region of the native range (NU = 0,000), with a relative high stability (NS = 0.602) and mild expansion (NE = 0.391).
 calibrated axes, (a) between NAE, this is, comparing the native portion of the niche of Trachemys scripta with the invaded portion of niche (considering only invasive range with establishment evidence); and (b) between NAC, this is, comparing the native portion of the niche and the invasive portion of the niche (considering all the records in invasive range). For NAE: PC1 = 62.01%, PC2 = 25.76%; for NAC: PC1 = 63.75%, PC2 = 24.5%. PC is the contribution (in %) for each principal component of the analysis. The solid and dashed contour lines illustrate 100% and 50%, respectively, of the available (background) environment. Color shading represents the density of the occurrences by cell.")
Niche similarity test represented along two Principal Component Analysis (PCA) calibrated axes, (a) between NAE, this is, comparing the native portion of the niche of Trachemys scripta with the invaded portion of niche (considering only invasive range with establishment evidence); and (b) between NAC, this is, comparing the native portion of the niche and the invasive portion of the niche (considering all the records in invasive range). For NAE: PC1 = 62.01%, PC2 = 25.76%; for NAC: PC1 = 63.75%, PC2 = 24.5%. PC is the contribution (in %) for each principal component of the analysis. The solid and dashed contour lines illustrate 100% and 50%, respectively, of the available (background) environment. Color shading represents the density of the occurrences by cell.
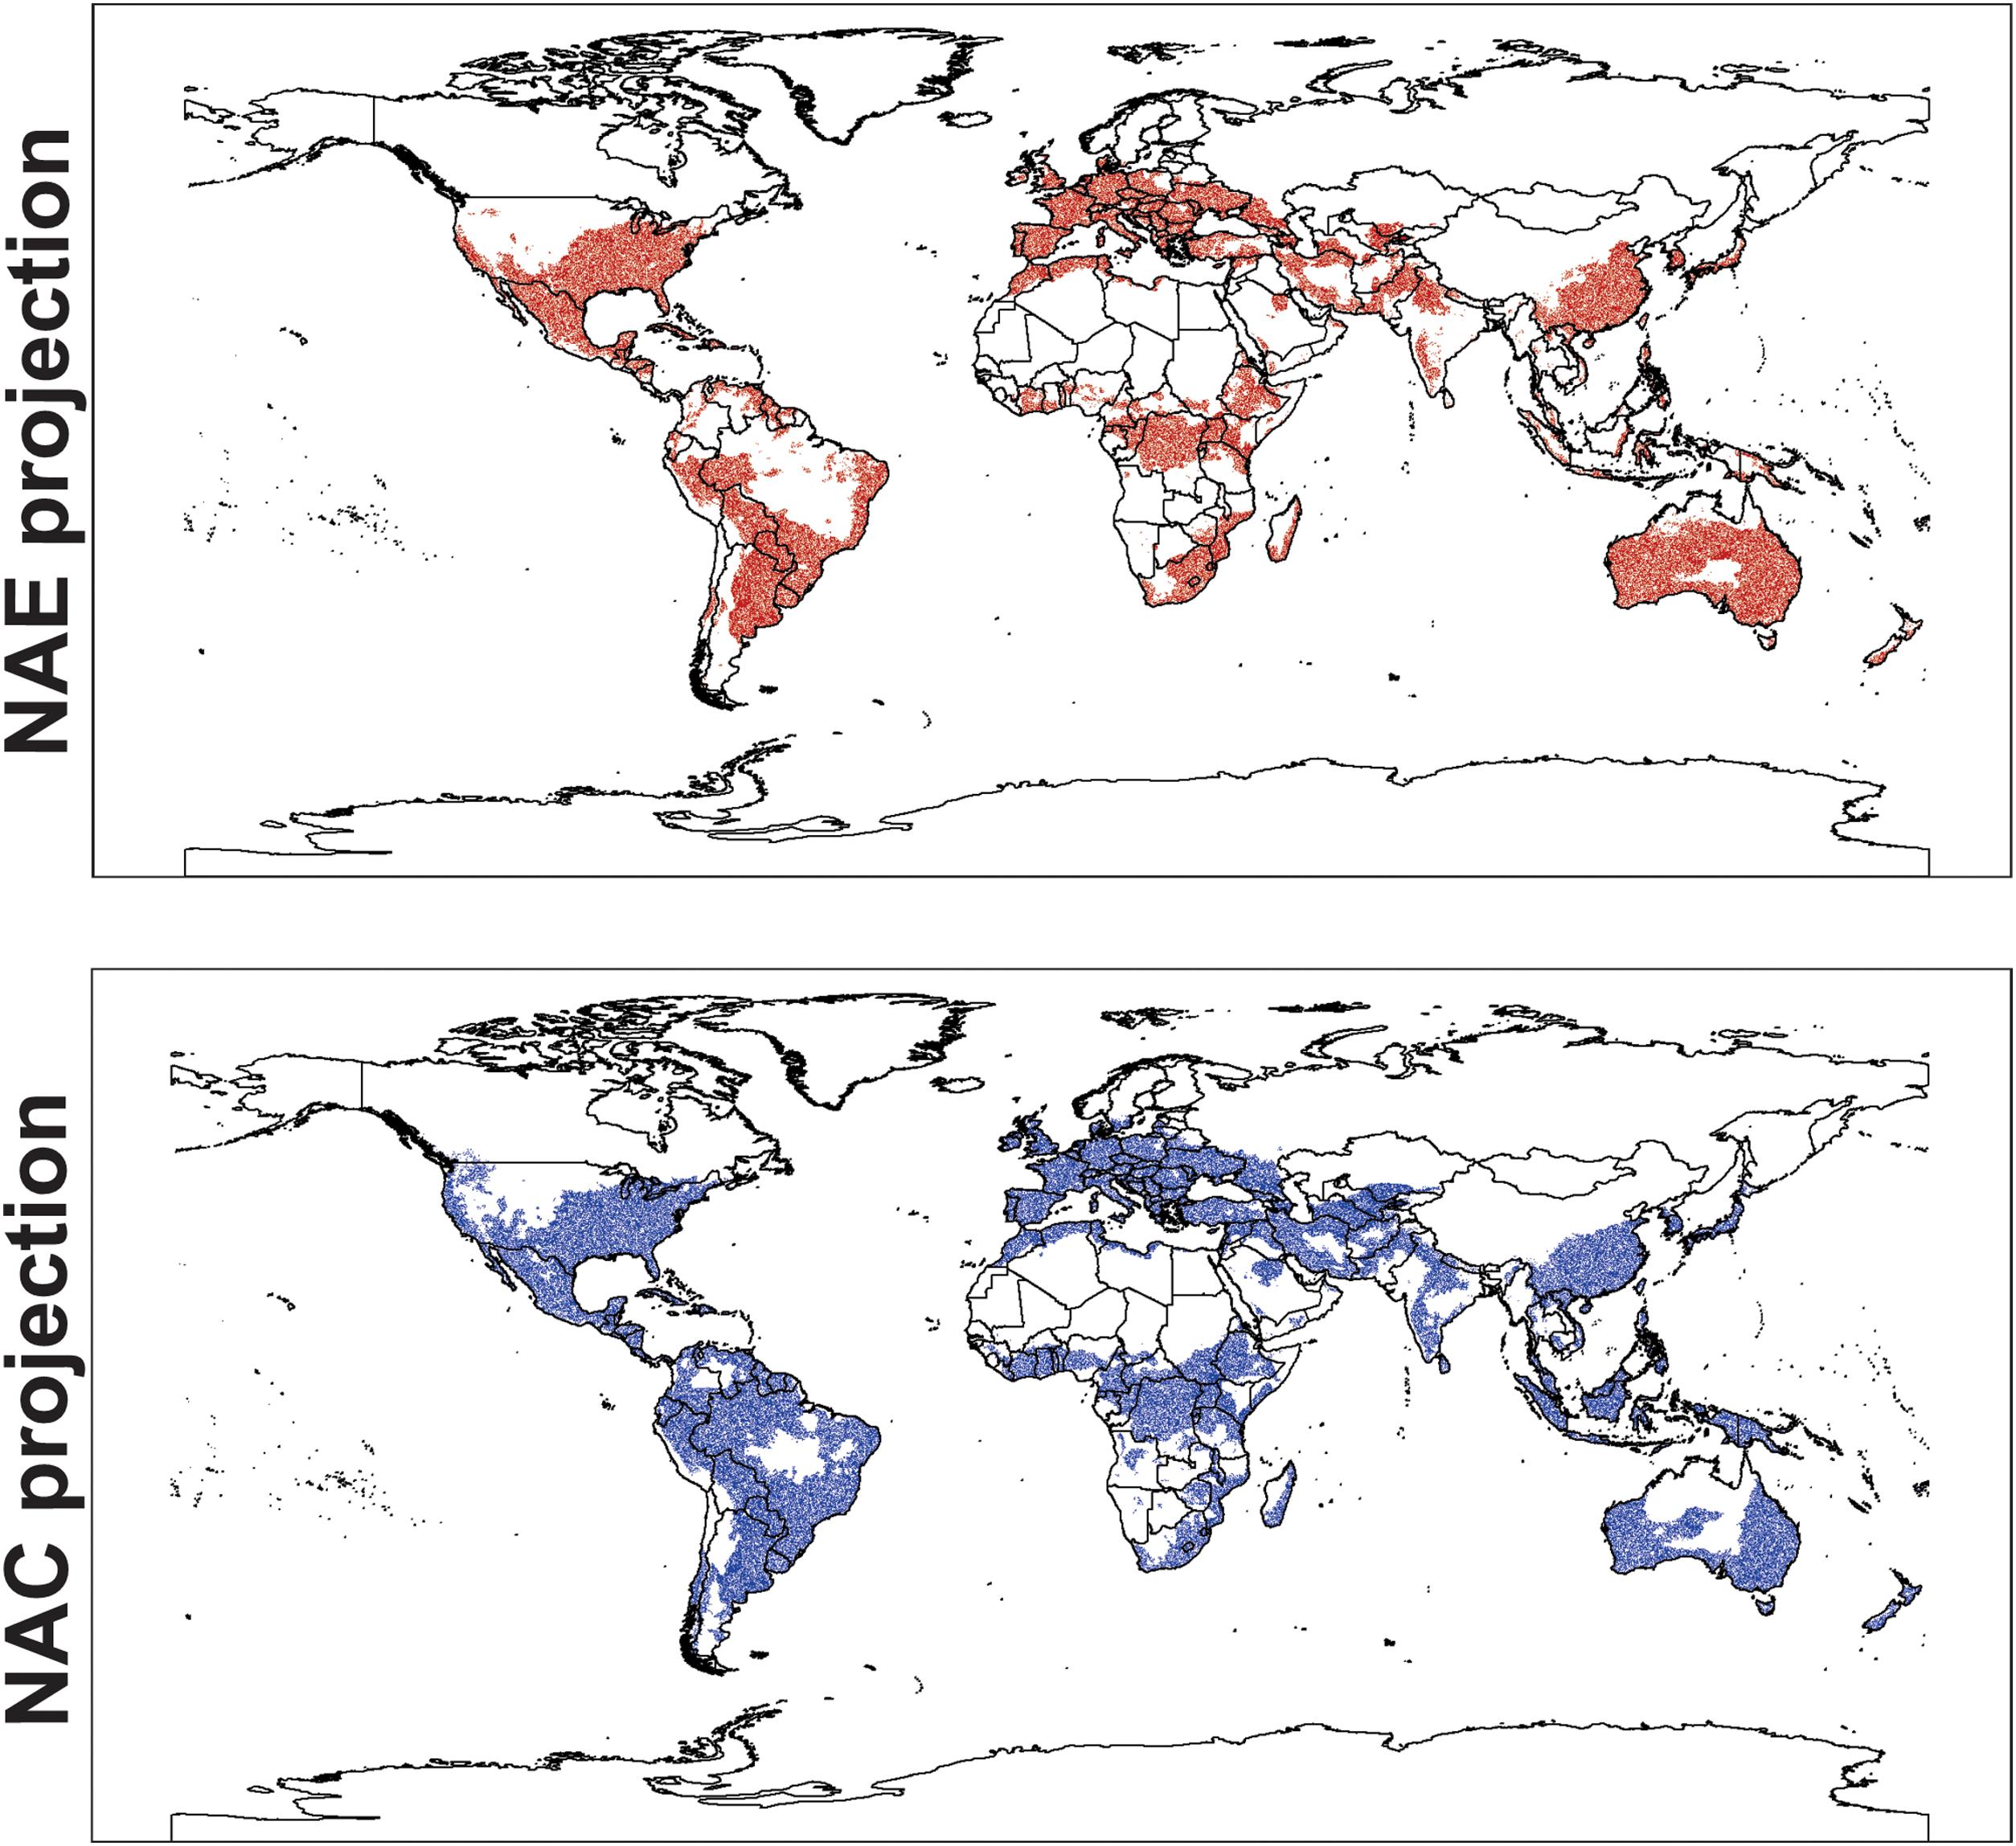
For the ENMs, the conservative model had a high AUC score (0.766 ± 0.029), and also performed well when evaluated with pROC (1.581 ± 0.003, p-value = 0.001). The global projections for this model indicated a suitable area of 10,007,633 km2of rivers and riparian areas for Trachemys scripta. To sum up, this area encompasses the native range of the species in North America and reaches to the west coasts of this subcontinent, also including the Gulf of Mexico. It also encompasses the central and southern portion of South America, most of Europe, part of the south of continental Asia, along with vast part of its insular extension. Further, Australia and small portions of Central and South Africa were also projected to be suitable (Fig. 2).

Global geographic projection of the resultant models for Trachemys scripta. NAE model was created with the ‘conservative’ dataset, and NAC was created with the ‘non-conservative’ dataset. Areas of consensus in green. Overlapping dots corresponding to locality records used to perform the models. NAC is “native and invasive populations”; NAE is “native and invasive but established populations”.
The non-conservative model performed similar (AUC = 0.750 ± 0.031, pROC = 1.505 ± 0.055, p-value = 0.001) and the projected area for suitable climate conditions was approximately 30% more extensive (13,416,277 km2) than for the ‘conservative’ projection, showing a predominant expansion of suitable area in tropical and subtropical regions, as Amazonia, central Brazil and Southeast Asia. Both projections showed a high overlapping (9,261,357 km2), and the ‘non-conservative’ model could accurately predict almost every region projected by the ‘conservative’ model, only with slight differences, mainly in Australia Fig. 2).
DiscussionOur results showed that including information only based on the reported establishment of invasive species population limits the analysis of the true understanding of the occupation of the environments by invasive populations, also reflected in different model projections; suggesting that all the existing information should be considered in studies that analyze the invasive potential of species. Despite it has been proposed that the best way to calibrate ENMs for invasive species should be based on confirmed records on viable established populations considering both the native and invaded range (Gallagher et al., 2010), this in fact could be limiting the niche characterization as has been shown; besides that, the information associated with the viability of the invasive populations is generally not available (Kikillus et al., 2010).
Building models with all records (not only with those confirmed established populations) generates differences in the areas of high risk of invasion for the species. When we used the non-conservative approach, the area of suitable climatic conditions for the species was notably more extensive than the area predicted for the conservative approach. Besides, the differences in the use of ecological space (within the same fundamental niche) could suggest that the conservative approach datasets tend toward incompleteness, failing in capture the climatic variability of invasive populations. We are aware that knowledge shortfalls can introduce bias while addressing questions in biogeography (Hortal et al., 2015), such as predicting the risk of invasion in a particular region, and might have even conservation implications (Bini et al., 2006; Diniz-Filho et al., 2013) which reinforces our findings. For many invasive species, for example, it is possible to find a great deal of information on species distribution outside their native range, but it is not the case for their population dynamics (Harper and Bunbury, 2015; Grayson and Johnson, 2018). This Prestonian shortfall – the lack of information in regards with species abundance and population dynamics – could cause flaws when addressing the invasive potential of a given species (Hortal et al., 2015). In spite of these well-known knowledge gaps, the evaluation and assessment of the invasive potential of alien species it is very important for decision making and should be assessed despite the knowledge of this limitations. In any case, the criteria/s adopted for model/s calibration is/are crucial and should be carefully thought based on the objectives of the study.
Indeed, both kind of approaches (‘conservative’ and ‘non-conservative’), provide useful information depending of the nature of the problem to solve. For example, let us put it in the context of the Aichi Target 9 of the 2011–2020 Strategic Plan for Biodiversity (CBD, 2010), which calls for the prevention, control and eradication of invasive populations. In one hand, our ‘conservative’ model could detect regions where there are populations without information on its viability, but inhabiting environments where we can be sure about their high suitability, and consequently, probability of establishment. Also to detect not invaded key-conservation regions (i.e. protected areas) where the species is not introduced but the risk of establishment is high, areas which should be focus of environmental education efforts. On the other hand, when the aim is to generate a proactive map of risk aimed to preventing future invasions, for example by implementing polices to restrict trade of invasive species (Bradley et al., 2010), models should be calibrated with a comprehensive (non-conservative) dataset, although this information could produce some geographical bias, given that in some regions the animals might not complete its life cycle. But still, predictions of potential distributions of invasive species should be considered as risk maps, in which case the over-prediction is a desirable property that reflects the very nature of invasive species (Jiménez-Valverde et al., 2011).
Niche comparisons showed different results depending on the data used to characterize the invasive portion of the niche. That is, we could detect wider areas in new regions where the species could potentially invade when more data is used for characterize the ecological niches; and conversely, the niche would likely be partially recover when only established population are considered. The proper estimation of the capacity of the species to use a portion of its climatic niche, different from the observed in its native range during the invasion process, is key to understand its invasive potential (Gallagher et al., 2010) and therefore generate accurate conservation policies (Beaumont et al., 2009). This simple controversy generated by different datasets could lead to the underestimation of the invasive potential of the species, which could be translated into erroneous management policies, e.g. allowing trade for a given species, assuming that it would not be able to establish alien populations under novel climate conditions. Therefore, to prevent errors like this one, we recommend using all available data to model the invasive niche, given that an overestimation of the invasive potential of the species, would not lead to such serious consequences when compared to the underestimation of potential of invasion.
Here, through a careful analysis of the dataset of invasive records of the slider turtle –one of the most problematic reptiles worldwide – we pinpointed the great importance of including information on population viability of invasive populations in macroecological and biogeographical studies, aimed to generating conservation recommendations. This important aspect has not been considered by previous studies analyzing the invasive potential and delimiting areas of risk of invasion of alien species (e.g. Ficetola et al., 2007; Gama et al., 2017; Nori et al., 2011a, b), except for rare exceptions (Kikillus et al., 2010). In this sense, we want to highlight that the inclusion of this simple step in the analyses, could significantly improve the results, and consequently help to arrive at decisions with more and better information. We recommend to not reject taxonomically reliable occurrence data based solely on absence of population status data, because valuable information regarding the complete environmental domain that the species can reach may be discarded.
Finally, it is noticeable the great importance of allocating research investment for generating public information in population dynamics of invasive species, and to take advantage of alternative sources of information such as citizen science (see Kobori et al., 2016), generating more and more accurate information. Meanwhile it is important to guide our actions based on the precautionary principle enshrined in the Convention on Biological Diversity: “Noting also that where there is a threat of significant reduction or loss of biological diversity, lack of full scientific certainty should not be used as a reason for postponing measures to avoid or minimize such a threat” (Convention on Biological Diversity 2010 preamble).
Declaration of interestsThe authors declare that they have no known competing financial interests or personal relationships that could have appeared to influence the work reported in this paper.
JMC and JN research is funded by FONCyT (PICT 2017-2666) and Secretaria de Ciencia y Técnica de la Universidad Nacional de Córdoba. JMC research is supported by CONICET doctoral fellowship. RL research is funded by CNPq (grant 308532/2014-7) and O Boticário Group Foundation for Nature Protection (grant PROG_0008_2013). This paper is a contribution of the INCT in Ecology, Evolution and Biodiversity Conservation founded by MCTIC/CNPq/FAPEG (grant 465610/2014-5).
The following are Supplementary data to this article:
Worldwide model projections for both compared conditions: “conservative” and “non-conservative”. The “conservative” dataset comprises the native and all the invasive populations; the “non-conservative” dataset comprises the native and the invasive but established populations.

