


It is imperative that decision-makers recognize when the intensity of human interference in regard to forest losses may result in adverse conditions for water ecosystem services. Several studies have indicated that defining thresholds is appropriate for indicating the ideal relationship between natural ecosystems and land uses in such a way as to ensure ecosystem service supply, but this knowledge is not readily available for different water services. To predict tipping points of change in the availability of seven water-related services, we assessed 11 catchments with different proportions of natural forests (Brazilian cerradão) and eucalyptus plantations. We analyzed water samples for 13 physical–chemical–biological parameters, which by specific aggregation functions define indices for each water service. We applied the piecewise model to evaluate the relationships between water service indices and natural forest cover. The results indicated that the highest potential gains occurred above 45% of forest. Landscapes with less than 20% natural forests tended to become unsustainable in maintaining services. Erosion control had a higher correlation with the decrease in natural forests.
The ecosystem services (ES) approach is currently being employed as a guideline for resource management and decision-making, even though its practical use may still prove difficult (Daily et al., 2009; Hummel et al., 2019). They are often linked to the irreparable loss of natural resources due to land usage and environmental degradation (Daily et al., 2009; Doherty et al., 2014). Changes in land use/cover are the main human-driven impacts on natural ecosystems, with direct implications for ES provisioning (Metzger et al., 2006; Turner et al., 2013). Several authors have recognized the importance of improving evaluations regarding the impact of land use/cover changes on ES and trade-offs between them (De Groot et al., 2010; Feng et al., 2012; Jones et al. 2017). Researchers have also emphasized difficulties in converting ES knowledge into actual public policies (De Groot et al., 2010; Bennett, 2017), notably in regard to water resources (Hackbart et al., 2017).
Water resources are strongly related to human well-being and survival, as they represent one of the most valuable benefits humans acquire from nature; meanwhile, water quality conditions can be indicators of landscape sustainability (Brauman et al., 2007; Martin-Ortega, 2015; La Notte et al., 2015). While water quality is often misrepresented as a final ES, it is most likely an important contributor to many different services (Keeler et al., 2012) since it involves ecological processes that intertwine and affect human well-being in several ways, each of which can be interpreted as specific benefits (Hackbart et al., 2017) and therefore should be evaluated as distinct water-related ecosystem services (ESw).
Landscapes undergoing strong changes in land use represent threats to water resources, as is the case in the Cerrado biome (Brazilian savanna), which originally covered 23% of the country, but 43% of this domain was already deforested by 2013 (MMA, 2015). The devastation of this complex biome continues to increase, fulfilling the interests of the agricultural sector while threatening the continued viability of agriculture (Lahsen et al., 2016). The Cerrado has been less monitored in comparison with other biomes, such as the Amazon; all the while facing intense pressure (Pennington et al., 2006). Therefore, the Cerrado is one of the most threatened biomes nationwide (Klink and Machado, 2005; Pennington et al., 2006; Beuchle et al., 2015). Within its vast territory, water springs feed three of the largest watersheds in Brazil, as well as important aquifers (Lima and Silva, 2007). These characteristics make the Cerrado’s preservation fundamental to the hydrological balance of this country (MMA, 2006). Land cover changes in these conditions become particularly dangerous if not monitored.
In the past thirty years of agricultural expansion over Cerrado landscapes, over 3 million hectares have been replaced with silviculture (MMA, 2015), mostly with eucalyptus plantations (IBÁ, 2017). Most plantations are fast growing, highly productive, and have short-rotation cycles (up to 7 years) (Rodrigues et al., 2019).
Commercial eucalyptus plantations are one of the most discussed topics in regard to water availability and performance relating to ESw (Ferraz et al., 2013). The possible impacts of eucalyptus plantations on water resources include siltation, increase in soil loss during harvesting, changes in water and nutrient cycling and reduction of water yield (Vital, 2007; Lima, 2011a, 2011b; Oliveira et al., 2015; Gonçalves et al., 2017; Jones et al., 2017). Although there are some negative effects related to water use and clear-cut management, soil protection practices, road conservation and management activities may diminish possible impacts on water quality (Ferraz et al., 2007; Silva et al., 2007; Rodrigues et al., 2019). The increase in riparian forest area has been highlighted as an example (Lara et al., 2009; Cassiano et al., 2013, 2020). On the other hand, natural forests provide several ecohydrological functions, such as the regulation of water quantity, erosion control, and nutrient loss control, which are therefore reflected in water quality (Lima et al., 2013). By easing the water passage through the soil, natural forests improve water quality (Brauman et al., 2007; Fiquepron et al., 2013; Cassiano et al., 2020). Therefore, water quality tends to be higher when watersheds are at least partially covered by natural forests in comparison to human land uses (Lara et al., 2009; Ferraz et al., 2013; Cassiano et al., 2020). Even when landscapes have fragmented patterns, studies have shown their importance in assuring ES supply (Cassiano et al., 2013; Little et al., 2015) or reducing further impacts on water resources (Ding et al., 2016; Mello et al., 2018). The intensity of ESw provisioning is likely related to the amount, configuration and quality of the natural forests (Ferraz et al., 2014). From this perspective, we need to assess the effects of human activities on stream conditions by developing adequate indicators that establish an equitable relationship between water quality and combined anthropogenic/natural elements (Uriarte et al., 2011), such as the contribution of landscape components to ESw provisioning (Maes et al., 2012).
The prediction of impacts of land use/cover changes over ESw supply may become one way to avoid losses or even obtain improvements by tracking changes in specific landscape characteristics linked to the maintenance of the service. Therefore, this prediction demands a broader and more diversified approach, from ecological processes to valuation (Rieb et al., 2017) to the recognition of thresholds that indicate adverse conditions (Rieb et al., 2017). Finding answers to these issues can help decision-makers improve alternatives in land use and conservation to preserve water resources.
Several studies have attempted to identify gains or losses in water services to obtain realistic scenarios, sometimes presenting monetary valuations (Keeler et al., 2012; Di Sabatino et al., 2013; Ojea and Martin-Ortega, 2015; La Notte et al., 2015; Zheng et al., 2016; Ding et al., 2016). Other researchers have preferred the ecological assessment based on water quality indices, inferring ESw supply (Keeler et al., 2012; Pesce, Wunderlin, 2000).
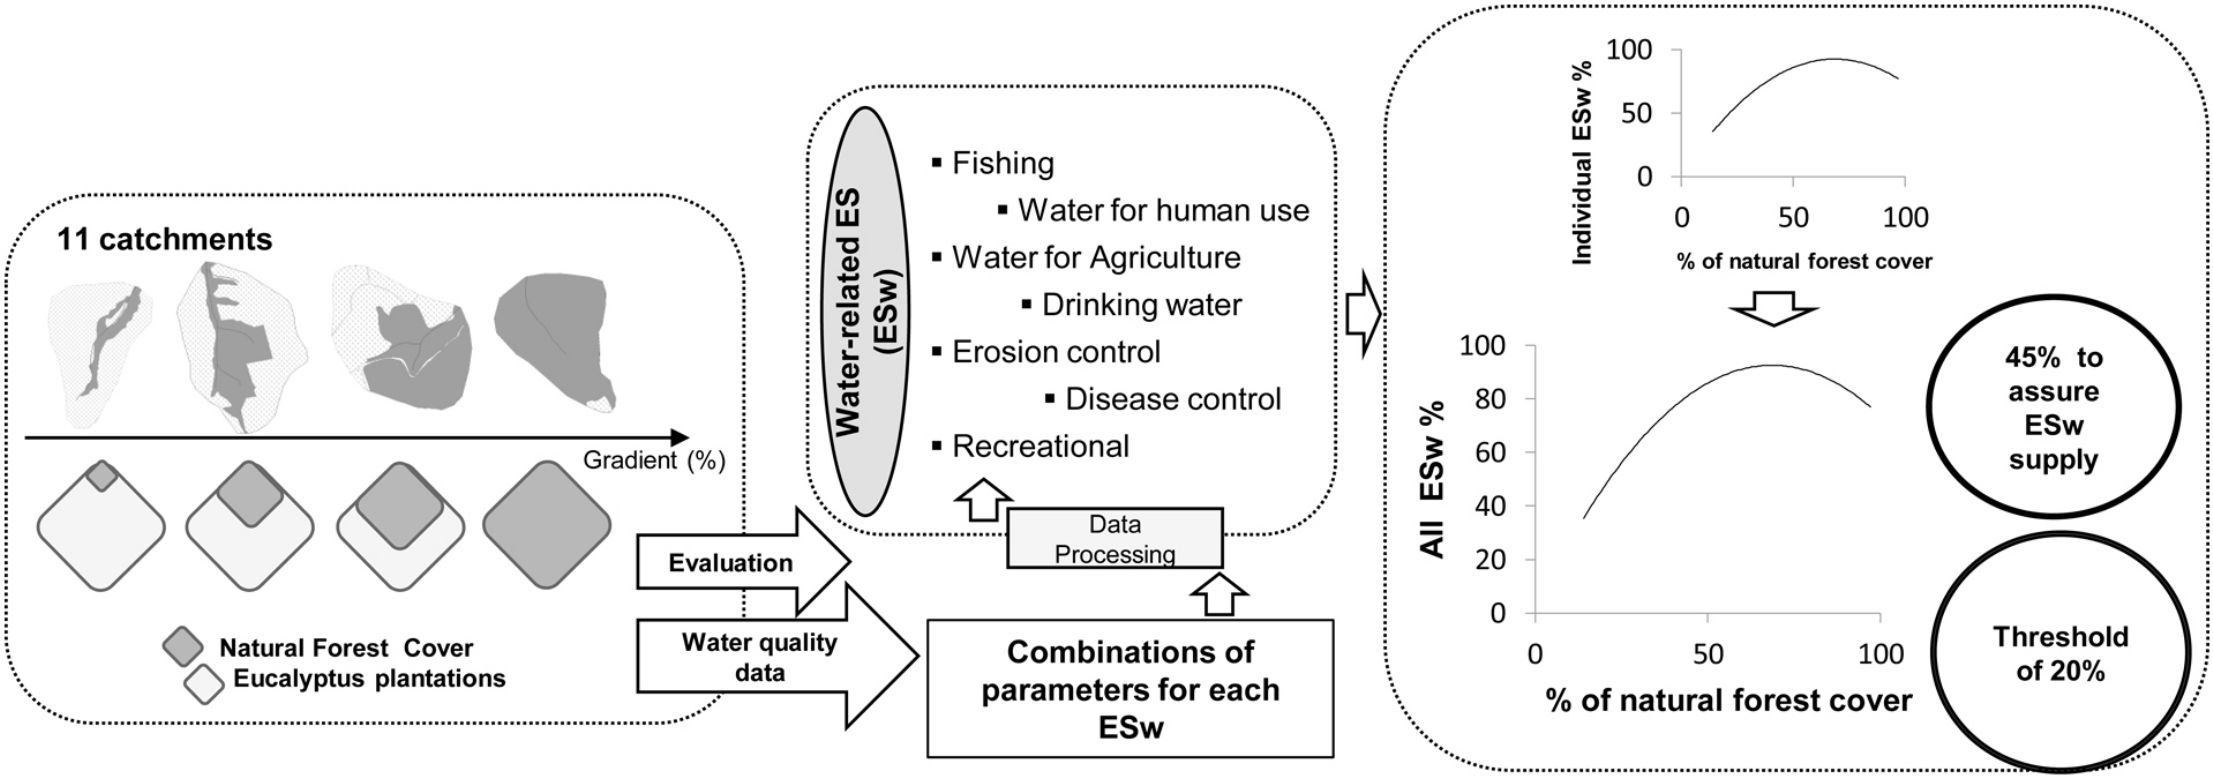
Encouraged by this background, we estimated the potential supply of seven ESw in eleven catchments in the Cerrado biome with several proportions of natural forests and eucalyptus plantations. To this end, we evaluated trends and thresholds regarding ESw represented by water quality indices.
Materials and methodsStudy area and landscape selectionFieldwork was carried out within the Cerrado biome in four municipalities of São Paulo state, Brazil (SM-1). This region has been undergoing major land use changes, yet it contains a few remaining patches of native vegetation physiognomies. The landscapes studied had native vegetation composed of cerradão, with the presence of tree species that occur in woodland savanna systems but also species from Atlantic semideciduous forests. Such mixed forest formations are known to be common within this region and extend to riparian zones (Durigan et al., 2004; Nobrega et al., 2020). For this reason, despite the cerradão physiognomy being broadly dominant, we named the mapped fragments natural forests. Under the physiognomic aspect, these forest formations have unique compositions and structures, which are much more complex than those found in eucalyptus plantations (Durigan et al., 2004). Landscapes ranged from 600 m to 880 m over Red Latosol and Red‒Yellow Latosol soil types (SM-1) and they have a tropical climate: Köeppen classification “Cfa” (Alvares et al., 2013). The dry season occurs from April to late September (rainfall below 75 mm/month), while the rainy season ranges from October to March (rainfall over 75 mm/month).
We delimited and mapped the land use/cover of several landscapes and selected 11 catchments of second and third orders that would represent a gradient from 0 to 100 % of natural forest cover (Fig. 1). Further details on landscape mapping and selection can be found in SM-1. All remaining natural forest patches were over 35 years old, while eucalyptus plantations ranged from 0 to 8 years old. We found other land uses with a maximum of 6% occupying the landscapes. Three catchments with more than 97 % natural forest cover were considered to have the best natural capacity for potential ESw provisioning.
ESw and water quality parameter selection and their locations in the Brazilian Cerrado biome (c).")
We selected seven ESw (Table 1) according to Lima (2011a, 2011b) and Hackbart et al. (2017), which links ESw with water quality, by utilizing several combinations of 13 water quality parameters (WQp) relevant to the maintenance of the service (Table 2). In short, we considered (i) at least one water service in the provisioning, regulation, and cultural categories; (ii) services intended for the common good or of public interest, whether in the landscape of interest or downstream; (iii) water services that could be quantified through measurable water quality indicators; (iv) indicators able to indicate some variation in the supply of water services and being related to human activities; (v) services that can be reported by a combination of the indicators as indices; and (iv) indicators that fit the usual time, field and laboratory constraints. These attributes have been shown in the cited literature to be useful in support monitoring and management actions that identify and estimate changes in service provisioning. To make the chemical parameter concentrations comparable, we also measured the streamflow (Q L/s) in each catchment so that the values could be normalized.
Description of the seven ESw and their categories based on TEEB (2008).
| Category | Basis | ESw | Description |
|---|---|---|---|
| ESw provisioning | Includes all ecosystem products intended for direct human use, such as food and energy, which may be placed on the market, consumed or directly used. | Fishing | The ability to contribute to the presence of river fish through water quality natural maintenance. |
| ESw regulation | Benefits acquired from nature due to the regulation of natural processes | Water for human use | The ability to provide water quality for different human uses, such as domestic or industrial; not necessarily drinkable water. |
| Water for Agriculture | The ability to provide quality water for agricultural production. | ||
| Drinking water | The capacity of water purification, of maintaining a quality condition that allows human consumption. | ||
| Erosion control | The control of suspended materials in the water due to the surrounding erosion that interferes directly with water quality. | ||
| Disease control | The capacity to control disease transmission. | ||
| ESw cultural | Intangible benefits that people acquire from ecosystems in the form of spiritual, religious, contemplative and educational experiences | Recreational purposes | The ability to provide conditions for direct and prolonged contact with water. |
ESw and respective water quality parameters.
| Classified as | ESw | T | pH | EC | DO | TDS | COLF | COLT | TSS | TURB | P | NO2 | NO3 | NH4 |
|---|---|---|---|---|---|---|---|---|---|---|---|---|---|---|
| Provisioning | Fishing | x | x | x | x | x | x | x | x | x | ||||
| Regulation-Maintenance | Human use water | x | x | x | x | x | x | x | x | x | x | |||
| Agriculture | x | x | x | x | x | x | x | |||||||
| Drinking water | x | x | x | x | x | x | x | x | x | |||||
| Erosion control | x | x | x | x | x | |||||||||
| Disease control | x | x | x | x | x | x | x | x | x | x | ||||
| Cultural | Recreational | x | x | x | x | x | x | x |
Temperature (T, °C); conductivity (EC, μg/cm²); dissolved oxygen (DO, ppm); total dissolved solids (TDS, ppm); fecal coliforms (COLF, CFU/10 mL); total coliforms (COLT, CFU/10 mL); total suspended solids (TSS, mg/L); turbidity (Turb, NTU); total phosphorus (P, μg/L); nitrite (NO2, μg/L); nitrate (NO3, μg/L); and ammoniacal nitrogen (NH4, μg/L).
We collected water samples every two months in each stream, seven times, from December 2017 to December 2018. Detailed procedures of data collection, sampling and water analysis can be found in SM-2. We sampled separately during the dry and rainy hydroperiods based on daily precipitation official bulletins from two different pluviometers close to all sampling spots (SM-3). All parameters needed as input for calculation of the seven ESw were measured, namely, 938 raw data (SM-4). Stream flow measurements were obtained by the float method (Palhares et al., 2007). To standardize the procedures, all samples were collected at low-flow conditions.
Data analysis and ESw estimationOverviewA previous evaluation was carried out to remove outliers from the total sample and establish the WQp that best suited the variations in natural forest proportion. Data were normalized per variable using the Z score method (values from 0 to 1). Mardia's multivariate normality test was applied (SM-5). DO values had the opposite pattern when compared to other parameters, as higher values are representative of better water conditions; therefore, we used a DO value of -1 for the next steps. Second-degree polynomial functions were applied since they were able to improve the representation of the complexity in WQp (Gotelli and Ellison, 2011). We also verified the coefficients of variation across the gradient, given that the increase in variation may indicate impacts on WQp.
Normality and homoscedasticity were checked by monitoring WQp for annual, rainy, and dry hydroperiods (SM-4), which revealed that the majority of our data had nonnormal distributions and resulted in no multivariate normality. Therefore, we proceeded with nonparametric tests to assess differences between the hydroperiods. To better understand if each parameter could, alone, respond differently, we applied the Kruskal‒Wallis test, which showed no significant differences between the hydroperiods to the majority of WQp. To test if the hydroperiods differed considering all parameters together, statistical multivariate differences were tested by ANOSIM, and disparities over hydroperiods were very low (SM-5).
ESw estimationWe defined seven ESw as simple sums of normalized WQp data, based on the work of Hackbart (2016). We applied the random forest hierarchical method (Breiman, 2001), which is efficient in working with nonlinear data and is able to relate parameters of different natures, to develop indices that consider the relative contributions of each parameter for a specific ESw in an expression of landscape forest quantity (Eq. 1). Details on how the random forest approach was applied can be found in SM-6.
where ESwIi is the index for ESwi; wpqi are the normalized parameters for each quality condition; and rvi represents the respective relevance value of each parameter by random forest.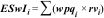
To compare the indices of the seven ESw, we converted all ESwI to a scale of 0–100, according to Eq. 2.
where ESwIi0,100 represents the distributed values in this scale; ymax refers to the maximum possible value assigned to ESwI on a scale (0,1); ymin refers to the minimum possible value assigned to ESwI on a scale (0,1); xn is the value of ESwIi obtained for each landscape by Eq. 1; xmin is the minimum value of ESwIi among all landscapes; and xmax is the maximum value of a ESwIi among all landscapes.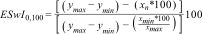
We applied the piecewise linear regression model to evaluate the relationship between ESw and forest cover to validate the occurrence of thresholds throughout possible breakpoints (Toms and Lesperance, 2003). Statistical analyses and graphs were built in R software 3.5.2 and MATLAB, 2017a (R Core Team, 2013; MATLAB, 2017).
ResultsThe eleven catchments selected and mapped for land use/cover compositions are presented in Fig. 1. Scenarios such as 55 % or more of natural forest cover were found primarily within the vicinities of protected areas. Drainage densities were considered regular (Carvalho, Silva, 2006) and ranged from 7.3 m/ha (0.73 km/km²) to 14.5 m/ha (1.45 km/km²); road densities ranged from 3.4–55.5 m/ha, with most eucalyptus plantation densities being considered regular/high pressure, while preserved areas had a low pressure of road density (Prado, 2015); landscapes presented mild slopes (details in SM-1).
WQp variation according to natural forest percent coverWe identified trends throughout the gradient, even though the regressions for WQp showed R² < 0.5 (Fig. 2; SM-8). In general, Turb (4.45 NTU mean), TSS (3.29 mg/l mean), pH (6.54 mean), EC (21.84 μg/cm² mean), and TDS (10.78 ppm mean) had inverse trends in response to the increase in natural forest (Fig. 2). Separating hydroperiods allowed us to show a higher fit during the dry hydroperiod for seven parameters (pH, EC, TDS, 1-DO, COLT, TURB, and P) (SM-8). Among this group of variables, Turb and TSS in stream water are likely the most appropriate to reflect the forest percent cover within a landscape.
 Turb, (b) TSS, (c) pH, (d) EC, and (e) TDS.")
We observed a higher amplitude and asymmetry of the coefficient of variation (CV) in landscapes between 14% and 31% of natural forest, especially for Turb, TDS, and EC (Fig. 3). The CV also indicated that four parameters had a higher fit during the dry hydroperiod (EC, TDS, COLT, and TSS), while two (NO3 and P) had a higher fit during the rainy hydroperiod (SM-8).
ESw supply and natural forest cover Turb, (b) EC, and (c) TDS.")
From all WQp that entered the random forest algorithm (SM-9) to estimate each of the seven ESw, Turb (rvι = 1) and pH (rvι > 0.9) had the highest relevance values. These results followed trends detected by simple regressions (Fig. 2). The indices of the seven ESw supplies, calculated by Eq. (1), are presented in SM-9. To better understand the general trends in ecosystem services (Fig. 4), we removed catchment B99, since its general results differed substantially from those of other natural forest landscapes. We named this selection of landscapes the “reduced sample”, and the results considering B99 (total sample) can be found in SM-10. Trendlines for the ESw displayed service gains as the natural forest percentage increased in the landscape in all cases.
. Dashed lines indicate potential changes in the ESw provisioning trend.")
Trendlines indicate that all ESw potential provisions increased with the percentage of natural forests (Fig. 4). Erosion control had the best fit (R² = 0.45), followed by direct use (R² = 0.31) and agriculture (R² = 0.28). The quadratic regressions indicated that the ESw supply for landscapes of lower natural forest percentages had a more unstable condition. In situations of less than 40%–55% natural forest, the curves indicated a quick loss in ESw supply.
To assess the potential provisioning for all seven ESw added up, we generated the trendline for the reduced sample (Fig. 5), resulting in a general increase in ESw supply along the gradient.

Since the ESw results presented a normal distribution detected by the Shapiro‒Wilk test (SM-5), we proceeded with the piecewise model (Fig. 6). The threshold was estimated between 14% and 31% of natural forest cover, with one breakpoint at 20% (R2 = 0.5; adjusted R2 = 0.21). It is crucial to point out that the reduction to only 20% of natural forest led to a fast decrease in ESw supply.
Discussion
We analyzed thirteen water quality parameters (WQp) from streams, assuming that they should be responsive to natural forest proportions within catchments and, consequently, that their combinations are fair representations of ESw supply for these landscapes. When assessing each parameter individually, we found that turbidity, total suspended solids (TSS), pH, conductivity, and total dissolved solids (TDS) showed higher contributions to the detection of stream quality in landscapes of natural forest and eucalyptus plantations, which allows us to consider that they may be suitable for monitoring water quality and ESw supply. The importance of turbidity and total suspended solids for landscapes of natural forests and eucalyptus plantations has been identified by other studies (Mosca, 2008; Lara et al., 2009; Hackbart, 2016; Cassiano et al., 2020), which suggests that these WQp can provide important information in this regard. Several studies have investigated the effects of land use conversion as a key factor on ecohydrological processes and water quality changes for land uses other than eucalyptus, with TDS and Turb also being usual referral parameters (Amiri and Nakane, 2009; Ding et al., 2016; Sutadian et al., 2016; Avigliano, Schenone 2016; Clément et al., 2017; Taniwaki et al., 2017; Afed Ullah et al., 2018; Mello et al., 2018).
Despite the low discrepancies detected by the ANOSIM test, differentiating the hydroperiods allowed us to identify that Turb, pH, and EC can be informative regardless of rainy/dry periods, therefore contributing to general information throughout the year. On the other hand, trendlines and coefficients of variation showed some differences between hydroperiods, as already noted by Hackbart (2016) for eucalyptus plantations in the Atlantic Forests and Bitencourt (2017) for pasture in forest savannas, both using the same methodology. Considering that watersheds can respond to precipitation patterns, which change stream outflow and influence water quality (Garcia et al., 2018; Paul et al., 2019), it is desirable to monitor catchments throughout both periods, since many studies have assumed annual values that camouflaged seasonal variability, possibly covering up relevant information (Kandziora et al., 2013; Schmalz et al., 2016).
Parameters that presented the best correlation to natural forest proportion (Turb, TSS, pH, EC, and TDS) and presented higher coefficients of variation in landscapes with lower percentages of natural forest cover (Turb, EC, and TDS) are related to the leaching process of dissolved particles (EC, TDS, and pH) and erosion of larger particles (Turb and TSS). These results are consistent with the reality of eucalyptus plantations, since soil loss is often pointed out as a frequent impact on water resources (Lima, 1996; Ferraz et al., 2007; Rodrigues et al., 2019; Cassiano et al., 2020) due to clear cuts, heavy machinery transit, soil exposure after planting or coppicing, and the presence of dirt roads, each of which is an important sediment source (Garcia et al., 2003; Ferraz et al., 2007; Prado, 2015; Rodrigues et al., 2019; Ogasawara et al., 2021). In our findings, the increase in natural forest cover surrounding streams across the gradient was followed by better quality and more stability, supporting the role of natural forests as buffers to protect streams from alterations caused by land use changes, as shown by other studies as well (Ferraz et al., 2014; Sweeney, Newbold, 2014; Little et al., 2015; Cassiano et al., 2020; Mello et al., 2018; Fiquepron et al., 2013).
Pristine streams are expected to present a low nutrient baseline for Cerrado landscapes, as well as a low EC (Hunke et al., 2015). Our studied catchments fully covered by natural forests had low values for most parameters (SM-7), with smaller CVs, as expected. When compared to the other two catchments (SM-1), B99 showed higher than expected WQp values for a preserved forest, but the steeper slope may have had a role in this regard.
It is important to point out that our study did not assess the landscape configuration and position of natural forests within the catchments, which may influence the observed trends, as already evidenced in other studies (Ferraz et al., 2014; Mello et al., 2018). Investigation is still needed to better understand how the position of the forests within the catchments relates to WQp and its possible impacts on ESw supply. Similarly, the sample size and number of landscapes that we were able to address may limit the generalization of our findings.
All samples were taken during low-flow conditions. Even though sampling during low-flow condistions can help us to reveal patterns and avoid nutrients being undetected because of water dilution, such a choice made in our experimental design has its own limitations, as stormflow conditions are known to increase concentrations of solids and particles transported by rainfall into streams, therefore giving it a better view of the magnitude to which eucalyptus plantations impact small streams.
Results have shown that the increase in natural forests can help maintain water quality chemical conditions, therefore increasing potential ESw supply either locally or downstream. As vegetation patches are frequently located in riparian zones, it is possible to indicate that nutrient regulation and retention may be associated with these natural forests (Mello et al., 2018). Meanwhile, in Cerrado landscapes, where water quantity may present limitations across the year (Nóbrega et al., 2017), bigger proportions of natural forests alongside eucalyptus plantations could also reduce water use within catchments, increasing water availability, especially during the dry season (Ferraz et al., 2019). Therefore, ESw in catchments with bigger proportions of natural forest cover may also benefit from the increase in water availability, by increasing nutrient dilution and the riparian zone effect in retaining and regulating these compounds.
ESw provisioning: outcomes for environmental planning and managementLow-order streams (1st to 3rd orders) contribute to the functioning, biodiversity, and water quality of the entire river network (Vannote et al., 1980), therefore directly contributing to the ESw supply downstream. They can represent over half the natural stream network length, and yet, large-scale studies have often neglected them due to their relatively small size (Taniwaki et al., 2017). We conclude that the quality of this contribution may change in catchments below 45% natural forest cover when combined with eucalyptus plantations and tends to become too unpredictable in situations of less than 20%. Our results also indicated that the provisioning of the seven ESw decreased with a higher extension of eucalyptus plantations in all cases, conforming the role of natural forests in maintaining the provisioning of ESw.
Low-order streams are known for their importance in providing ES to downstream areas. Catchments with streams with small water volumes and natural forest cover below the critical threshold can be highly affected by human activities; therefore, water-related ES may present a steep decline in such landscapes. The loss of the ES presented here can reveal that landscape functions essential to local human populations may be jeopardized, such as a decrease in stream flow, an increase in turbidity and diffuse nutrient pollution, and changes in the structure of aquatic communities, among others, which affect downstream water quality and productivity (Meyer et al., 2007; McGarrigle, 2014). They play an essential role in the transfer of nutrients and influence the supply of sediment from hillslopes to downstream. Therefore, streams have a strong impact on downstream water quality, in addition to having aesthetic value, giving conditions to create a sense of place and contributing to recreation (Biggs et al., 2017). Our findings point to a plural value of ecosystem services resulting from the presence of more than 45% of forests in headwater catchments. The literature reveals that ESw supply can extend downstream (Biggs et al. 2017), providing social benefits to people other than local land users. As warned by Biggs et al. (2017), policy-makers and legislators should have responsible conduct over small catchments just as they usually do for watersheds by improving management models to support forest conservation. It is worth highlighting that erosion control ESw presented the highest R² value (0.45) in the quadratic regression, and the combined parameters related to this service were composed of variables that presented a higher fit concerning the increase in natural forests. The productivity of eucalyptus-planted forests heavily depends on a healthy water cycle and sustainable management, which avoids ecosystem damage at the local scale. Two major stages of management are particularly challenging in this regard: soil preparation and site harvesting, as well as the density and spatial location of dirt roads (Garcia et al., 2003; Ferraz et al., 2007; Cassiano et al., 2020). Other studies have shown the linkage between the increase in natural forest proportions within landscapes and lower soil losses to streams (Little et al., 2015; Sweeney, Newbold, 2014; Cassiano et al., 2020). Despite the results observed for ESw provisioning, the plantations in this area did not present a correlation as high as that detected by Hackbart (2016) for Atlantic Forests, which had a steeper slope, using the same methodology.
Even though our findings indicate the potential damage related to eucalyptus plantations, in general, losses in the seven ESw were not as intense as they were for pastures within the same region, in a study conducted with the same methodology that we applied (Bitencourt, 2017). Studies have shown that the presence of eucalyptus canopy helps reduce the speed and impact with which rainfall reaches the soil, decreasing particulate loading to streams, which is also due to litter deposition and the presence of woody roots that protect the soil surface (Ferraz et al., 2013; Padilha et al., 2018; Ferraz et al., 2019; Ogasawara et al., 2021). For the studied region, these characteristics, added to the mild slope, may enhance the protection of the soil and diminish nutrient losses when compared to pasture (Bitencourt, 2017) or eucalyptus plantations in the Atlantic forests (Hackbart, 2016).
Soil types and textures presented some variation within our sampling spots (SM-1), and this is expected of soil types to be reflected in stream water parameter values (Lima et al., 2013). This variation may have diminished the adherence of our model. Increasing the number of sampling spots may be one way to address this issue. Ruggiero et al. (2002) also highlighted that parameters vary depending on the species compositions and structure within natural forest areas, which may also explain some of the variation within our data. Some researchers have emphasized the importance of the quality and composition of natural forest patches in ES provisioning (Ferraz et al., 2013, 2014). Future studies on the species composition of the native areas in these landscapes may provide important information in this regard.
As mentioned before, for the sum of the seven ESw, provisioning increased along a gradient, and the estimated threshold indicated that situations below 20% of natural forest cover tended to abruptly lose provisioning, suggesting that these landscapes may become too unstable. The trendlines and the awareness of the limits for ESw provisioning are important since they can address possible outcomes for decision-makers interested in preserving one or more of these specific services. In this sense, other studies have had similar results. The pasture landscapes studied by Bitencourt (2017) required at least 50% natural forest preservation to maintain 70% of ESw provisioning. The author noted that less than 20% forest cover creates circumstances where ESw loses provisioning, and at this point, the catchments can be considered unsustainable. When compared to eucalyptus plantations, the threshold of 20% natural forest cover presented similar outcomes. Likewise, in the results reported by Hackbart (2016) regarding the ESw supply, a proportion of 20% of natural forest preservation was able to ensure good ESw provisioning at first sight, but harvesting events throughout the entire catchment decreased the ESw provisioning in landscapes containing 20–60 % forest cover, pushing the threshold up to 70% preservation needed to ensure ESw supply.
Limitations and future challengesThe thresholds presented here shed some light on ESw provisioning in small catchments, but they do not address the full range of ecological complexity of the mosaic within the landscape; therefore, these numbers may not reflect the most adequate distribution of natural forest to guarantee other features needed for better conditions in general; that, in turn, is usually indicated with a critical threshold close to 40% of natural forest cover (Wies et al., 2021). Despite the limitations, there is a presumable benefit from making some generalizations in water ES planning, and the use of thresholds can be considered a guiding principle to communicate specific information and decision-making in a direct and unmistakable way.
The conclusions made in this study assume that the chosen WQp represents the addressed ESw, as we were faithful to water quality indices specific to human activities presented in the literature. Further investigations into this topic could require other combinations of WQp. Similarly, we understand that collecting samples only during low-flow conditions may have an influence on underestimating the impacts eucalyptus plantations have on small streams. We encourage future research to increase sampling, including stormflow conditions.
We evaluated the concomitant provisioning of seven ESw, assuming that the predominant elements of the landscapes represent change-inducing forces. The outcomes provide support for setting priorities and adjusting land use/cover to guarantee the desired ESw provisions. However, we did not investigate the strength of the relationships between them, such as measuring the correlation or statistical dependencies between these and other potential services provided in these landscapes. It is possible that more extensive evaluation to determine p.eg service bundles considering other possible driving forces (such as socioeconomic gains or institutional decisions) could detail the consequences of management actions on multiple functions (Raudsepp-Hearne et al., 2010; Jacobs et al., 2015; Hersperger et al., 2021). It would also be relevant to explore potential changes in ESw and bundles across different spatiotemporal scales, since the literature has shown that ecological processes and interactions between services may differ from one scale to another (Lee and Lautenbach, 2016; Qiu et al., 2018; Qiao et al., 2019). Establishing links between processes and critical ES changes on several scales could improve decisions in regard to management actions (Scholes, 2017; Qiu et al., 2018). Therefore, we encourage future studies to unravel the gaps and provide an understanding of this topic.
ConclusionOur results highlight the importance of Turb, pH, and EC as parameters to monitor water resources in landscapes of eucalyptus plantations. All service supplies increased with higher percentages of forest cover, confirming the importance of increasing natural forest percentages within catchments. We suggest that decisions on land use for headwater catchments with eucalyptus plantations consider the value of approximately 45% of natural forest to guarantee ESw supply. We also emphasize the simultaneous and large losses of services when the threshold of approximately 20% of natural forest is exceeded. Among all seven ESw, erosion control had the best relationship to eucalyptus/natural forest proportions, therefore making this variable a good and simple indicator to trigger public debate regarding water conservation and human well-being within these areas.
We are very thankful to professor Maria José “Zezé” Brito Zakia for the theorical support. We also thank “Estação Ecológica de Angatuba” - IF (COTEC nº 856/2017 D109/2015), “Estação Experimental de Itatinga” - ESALQ, and Suzano S.A., for giving us access to their properties.

