
Sharks play an essential role in maintaining the health of ecosystems, but many species are endangered and have locally disappeared around the world. Their management, where established Marine Protected Areas (MPAs) and strict fishing regulations exist, has contributed to the recovery and maintenance of shark populations. However, the overlap between shark populations and increasing human activities can result in incidents and socio-environmental conflicts. The present study used data from baited remote underwater video systems, citizen science, drones, and scientific captures to identify drivers of shark distribution around the Fernando de Noronha Archipelago (FNA), a tourist destination offshore Brazil. Our findings place FNA among the world’s shark aggregation spots for both richness and abundance. They also show that both environmental (reef, trophic level, sea turtle grounds) and anthropogenic variables (fishing grounds, diving sites, beaches) are important predictors of shark distribution, signaling strong overlap and competition with humans for space and resources. This intensive space sharing is also corroborated by a species distribution model developed for tiger sharks. Furthermore, it is shown that the home range of adults and some species extend beyond its limits into areas where fishing is allowed with restrictions. Therefore, this study proposes an extension of the limits of the MPA and methods for human-shark interaction mitigation. The island’s economy strictly depends on ecotourism and these conservation measures are essential for a sustainable future to both sharks and humans.

Sharks play a critical ecological role as predators, maintaining the balance of marine ecosystems by regulating populations of prey species, such as fish, and removing weak or sick individuals, thus preventing trophic cascades (Heithaus and Dill, 2002). Despite their importance, significant gaps remain in our understanding of shark diversity, distribution, and life history (Ritter and Amin, 2017; Dulvy et al., 2021). Many shark species are now threatened or have already experienced local extinctions, primarily due to overfishing, with tens of millions of sharks being caught and traded annually (Pacoureau et al., 2021). Their slow reproductive rates and late maturity, characteristic of K-strategists, limit their ability to recover from population declines, exacerbating their vulnerability. Consequently, there has been growing urgency to develop and implement effective conservation strategies at both local and global levels (MacKeracher et al., 2019).
Marine Protected Areas (MPAs) have become a cornerstone of shark conservation efforts, with the aim of safeguarding local biodiversity by restricting human activities such as fishing (MacKeracher et al., 2019). However, MPAs are often designed with political rather than biological considerations, leading to gaps in protection that fail to cover critical habitats such as breeding grounds or migration routes (Halpern, 2014). In addition to MPAs, species-specific Shark Sanctuaries have been established globally. These differ in specifics, but they all ban targeted commercial shark fishing and aim to make it illegal to possess, sell, or trade sharks or their parts (Ward-Paige, 2017). They often face challenges such as weak enforcement and continued exploitation of prey species, which can undermine their effectiveness (Ward-Paige, 2017). Nonetheless, research indicates that shark populations can recover within sanctuary boundaries (Ward-Paige and Worm, 2017; Bond et al., 2012; Speed et al., 2018).
The Fernando de Noronha Marine National Park, a no-take MPA situated in the Fernando de Noronha Archipelago (FNA), has become a notable example of successful shark conservation, with high shark abundance recorded within its waters (Rangel et al., 2023). This area, covering 70% of the main island's coastal zone and extending to depths of 50 meters (ICMBio, 2017), has been identified as a critical habitat for juvenile sharks and a key breeding ground for several species (Garla et al., 2006; Afonso et al., 2016). Despite the park's designation, the increasing popularity of tourism in FNA has led to greater human-shark interactions, raising concerns about public safety. While shark-related injuries in the archipelago have been limited to smaller individuals of non-threatening species, the recorded incidents involving tiger sharks in 2015 and 2022 have sparked debates over shark management strategies (CEMIT, 2022).
This study aimed to address the distribution of sharks around FNA and the drivers of their abundance and biomass. Therefore using baited remote underwater videos (BRUVs), the study assessed local shark populations and identified key environmental factors (e.g., distance to beaches, distance to the harbor, being inside or outside of the MPA) influencing their distribution. The hypothesis was that sharks are more abundant near beaches, known as nursery habitats for different species (Garla et al., 2006), and feeding grounds, such as sea turtle nesting sites or areas of higher trophic level and biomass values of reef fishes. Additionally, we used records derived of multiple sampling methods to develop a species distribution model for tiger sharks around FNA. Based on the information on shark abundance and distribution, this research proposes non-invasive and cost-effective strategies, including educational initiatives, to balance human activities and shark conservation, promoting safe water use while protecting shark habitats. The ultimate goal is to foster a sustainable coexistence between sharks and human users of the coastal waters of FNA.
Material and methodsStudy siteThe FNA (03°51′S, 32°25′W) is composed of one large volcanic island (16.4 km2) and 18 islets, and it is located 360 km off the coast of north-eastern Brazil (ICMBio, 2017). FNA is influenced by the South Equatorial Current and tropical oceanic climate, presenting warm waters (around 26 °C) and two seasons, a wet (February to July) and a dry (August to January) (Garla et al., 2017). The no-take MPA has a size of 10,927.4 hectares (Dominguez et al., 2013) and the remaining coastal waters consist of a sustainable use area, where fishing is allowed with some restrictions (e.g., gill-nets, bottom longlines, spearfishing and shark fishing are prohibited whereas traditional methods like hand lines, trolling, and cast nets are allowed) (ICMBio, 2017). Both protected areas are monitored by the Instituto Chico Mendes de Conservação da Biodiversidade (ICMBio).
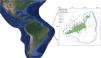
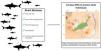
Sampling procedures and datasetsSampling was performed using baited remote underwater videos (BRUVs), which is a metal structure composed of a high-definition video camera and a pole with bait attached (∼500 g to 1 kg of sardines), aiming to record the biodiversity attracted. BRUVs were launched from the boat, stayed at least 60 min recording on the seafloor, and then retrieved by pulling the rope and buoy. The data was obtained during two sampling expeditions, described in Schmid et al. (2020) and Pimentel et al. (2020). The first one was conducted over eleven days between July and August 2017, when 79 single BRUVs (with one forward facing camera) were deployed in shallow waters (<30 m deep) off the north-west side of FNA, both inside the no-take MPA and the sustainable use area. The second expedition occurred during fifteen days in October 2019, when 39 stereo-BRUVs were deployed down to 80 m depth all around the archipelago, but mostly inside the no-take MPA. A total of 200 h of videos were available (161 h from 2017 and 39 from 2019, 134 h inside and 66 h outside of the MPA; Fig. 1A).

The databases contained the day and time of recording, depth, coordinates, type of substrate / habitat, and the relative abundance (MaxN; the maximum number of individuals of a species that can be observed in a single video frame) of all species. Identification and length measurements (in stereo-BRUVs) were performed in the SeaGIS software EventMeasure (version 6.10). A second dataset encompassed the documented occurrences of tiger sharks (Galeocerdo cuvier) and incorporated data of BRUV-sightings, shark captures (fisheries-independent scientific expeditions) since the year 2000, and information from citizen science (e.g., sightings during dives or boat tours) and drone surveillance (58 occurrences, Supplementary material; Fig. A1B).
Statistical data analysisTwelve socio-environmental predictor variables were assessed to describe the distribution of sharks around FNA, with some of them being continuous and others categorial. The five categorical factors consisted of depth classes (shallow: 0−30 m, n = 92; medium: 31−60 m, n = 14; deep: 61–80, n = 12), substrate / habitat types (Reef: 39, Sand: 54, Rhodolith: 25), time of sampling (morning: 7:00−12:59 o’clock: 69; afternoon: 13:00−17:59 o’clock: 49), deployment location on the sheltered (North-West: 96) or exposed (South-East: 22) side of the main island, and whether the BRUV was inside (70) or outside (48) the no-take MPA.
The continuous factors included the distance of each shark sighting (in km) to the Santo Antonio Port, and the weighted average of distances (thereafter ‘distance’) to relevant locations: beaches, fishing grounds, dive sites, and sea turtle nesting grounds (Supplementary Fig. A1A). Before averaging, all distances were weighed according to the location´s use, i.e., the relative (%) abundance of people for beaches, percentual fish landings (Dominguez et al., 2013), percentual maximum carrying capacity for dive sites (Luiz, 2009), and the percentual total number for sea turtle grounds (Sanches and Bellini, 1999). The distribution of beach visitors was estimated based on information retrieved from conversations with researchers who have been to Fernando de Noronha. The beaches in the sustainable use area are not environmentally managed and are closer to the inhabited part of the main island, therefore they were weighted higher (0.3) than those further away and environmentally managed (0.05), leading to a total weight of 0.9 for the beaches outside of the no-take MPA and 0.1 for those within. Lastly, the continuous drivers included information on community trophic level and biomass. The community trophic level (thereafter ‘trophic level’) was estimated for each BRUVs sampling as the sum of the trophic level value of each fish recorded (except sharks). Trophic level values, which indicate the position of each species in the food chain based on their diet, were compiled from Quimbayo et al. (2021) and FishBase (Froese and Pauly, 2023), and greater values are related to more productive food webs. To calculate the biomass (in gram), mean lengths were first estimated for all species from all available measurements (in stereo-BRUVs) and transformed into mean weight using the parameters for the allometric length-biomass equation, compiled from Quimbayo et al. (2021). Six species could not be measured or only occurred in non-stereo BRUVs. In that case, information about common length was retrieved from FishBase.
Generalized linear models (GLM). Five GLMs were carried out to explore the factors related to the total biomass of sharks, the total abundance of sharks, and the abundance of each of the three most abundant species: the nurse (Ginglymostoma cirratum), lemon (Negaprion brevirostris), and Caribbean reef sharks (Carcharhinus perezii). As biomass is continuous but can contain zeros, the Gaussian family was included in the first GLM, and the dependent variable was box-cox transformed to provide the best data normalization. For the other four abundance models, the Poisson family was used with non-transformed data. The model was run in R using the ‘MuMIn’ R-package (Version 1.47.5; Bartón, 2023) along with the function ‘dredge’ and ‘model.avg’, which generate a table containing models with combinations of the included factors. Among those, the model having the smallest Akaike’s Information Criterion (AIC) was used. The pseudo-R2 and AIC were used to determine the goodness of fit of all models with a confidence interval of 95 %.
Species distribution model (SDM). A species distribution model was built to explore the potential distribution and indicators of habitat suitability of tiger sharks around FNA and to identify its most important drivers. The algorithm fitted distance-based factors similar to those in GLMs against presence and pseudo-absence data. A spatial grid (each cell 100 m by 100 m) for each of the predictor factors was created by calculating the distance or weighted average of distances between all grid cells and locations (e.g., beaches; Supplementary Fig. A2). The pseudo-absences (100) were randomly added over the sampling area to account for spatial bias due to unbalanced sampling of occurrences (Phillips et al., 2009). Before building the model, correlations between factors were assessed based on GVIF; also, the distance to Santo Antonio Port was removed. The species distribution model was executed with random cross-validation using the ‘sdm’ R-package (version 1.1–8; Naimi and Araújo, 2016) while using the Generalized Linear Models (GLM) for the fitting (Araújo and New, 2007). A total of ten replicates were carried out for each method. The performance of the ensembled model was assessed with the area under the curve (AUC) along with the true skill statistics (TSS), basing the final map projection on the AUC.
ResultsDrivers for shark distributionIn both BRUVs expeditions together, 156 sharks of five species were recorded (0.78 sharks per hour): C. perezi (53 in.ividuals), N. brevirostris (49), G. cirratum (46), G. cuvier (5), and Sphyrna mokarran (1). Shark biomass was higher in areas of higher trophic level of the fish community and closer to diving sites and to sea turtle grounds (p < 0.001; Table 1). In addition, BRUVs located in the sustainable use area (p = 0.007; Table 1) and those closer to the beaches (p = 0.030; Table 1) also showed higher shark biomass.
Outputs of GLMs on shark biomass (pseudo-R2 = 0.23, AIC = 639.54) and abundance (pseudo-R2 = 0.42, AIC = 333.27). Predictors are depth class medium and shallow (Depth Med, Depth Shal), rhodolith and sand substrates (Sub Rhod, Sub Sand), sheltered side of the archipelago (Shel Side), outside of the no-take MPA (Out MPA), time of day (Time), distance to port (D Port), distances to beaches, fishing grounds, diving sites and sea turtle grounds (D Beach, D Fishing, D Diving, D Turtle), fish biomass (Fish Bio), and trophic level of all fish excluding sharks (Trop Lev). The top part of the table contains the results of the analysis for biomass (uses the t-value and Pr(>|t|)) and the lower one the results for abundance (uses the z-value and Pr(>|z|)). Empty rows result from factors not being part of the model describing biomass and abundance. Additional results and supporting plots are included in the supplementary material.
| Biomass | Estimate | Std. Error | t or z-value | Pr (>|t or z|) | Sig. |
|---|---|---|---|---|---|
| (Intercept) | 17.820 | 4.237 | 4.206 | <0.001 | 0.001 |
| Depth Med | |||||
| Depth Shal | |||||
| Sub Rhod | |||||
| Sub Sand | |||||
| Shel Side | 2.607 | 1.387 | 1.879 | 0.063 | |
| Out MPA | 2.331 | 0.852 | 2.736 | 0.007 | 0.01 |
| Time | |||||
| D Beach | −0.381 | 0.174 | −2.192 | 0.030 | 0.05 |
| D Fishing | |||||
| D Diving | −0.594 | 0.202 | −2.936 | 0.004 | 0.01 |
| D Turtle | −1.126 | 0.288 | −3.919 | <0.001 | 0.001 |
| Fish Bio | |||||
| Troph Lev | 0.010 | 0.002 | 4.314 | <0.001 | 0.001 |
| Abundance | |||||
| (Intercept) | 9.412 | 3.107 | 3.029 | 0.002 | 0.01 |
| Depth Med | |||||
| Depth Shal | |||||
| Sub Rhod | −0.798 | 0.266 | −3.001 | 0.003 | 0.01 |
| Sub Sand | −1.112 | 0.199 | −5.594 | <0.001 | 0.001 |
| Shel Side | |||||
| Out MPA | |||||
| Time | 0.061 | 0.040 | 1.523 | 0.128 | |
| D Beach | −0.117 | 0.047 | −2.525 | 0.012 | 0.05 |
| D Fishing | −0.736 | 0.250 | −2.945 | 0.003 | 0.01 |
| D Diving | |||||
| D Turtle | |||||
| Troph Lev |
The total shark abundance and the abundance of C. perezi were partly driven by the distance to beaches, with higher abundance closer to beaches (p = 0.012 and: p = 0.003, respectively; Table 1; Supplementary Table A2). The other factors describing shark abundance, however, strongly differed from those identified for the shark biomass (Table 1). The main driver for higher total shark abundances (Table 1), C. perezi and G. cirratum abundance was reef substrate (Supplementary Table A2). Proximity to fishing grounds (p = 0.003, Table 1) and to sea turtle grounds (p < 0.001; Table 1) were also related, respectively, to higher total shark and C. perezi abundance. Finally, the abundance of C. perezi increased throughout the day (p = 0.048; Supplementary Table A2).
When analyzing all drivers independently, only the type of substrate showed a positive correlation with the abundance of sharks (pseudo-R2 = 0.36; Supplementary Fig. A4C), C. perezi (pseudo-R2 = 0.29; Supplementary Fig. A5D), and G. cirratum (pseudo-R2 = 0.30; Supplementary Fig. A6).
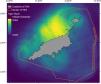
Tiger shark distribution modelThe performance of the SDM for tiger shark received good discrimination through AUC (0.878) and TSS (0.651). The importance of the variables considered in the model which was based on permutation importance showed that tiger sharks are mainly driven toward beaches (41.2 %), associated with diving sites (15.5 %), fishing grounds (12.2 %) and sea turtle grounds (8.2 %). The probability of occurrence peaks off the north-west coast of FNA, outside the no-take MPA and close to the main beaches and the port (Fig. 2 and Supplementary Fig. A1). The south-eastern side of the archipelago displays two high-abundance locations in close proximity to beaches, although with lower levels of occurrences compared to the north-west side.
DiscussionShark diversity
This study provides the first attempt to analyze social-environmental drivers of shark abundance and biomass for a tropical oceanic island of the south Atlantic Ocean. According to our results, FNA stands out as a hotspot for sharks. While five shark species were found in 200 h of BRUVs observation in FNA, most reefs in the world show deficits and absence of shark species (MacNeil et al., 2020). Shark richness is highest in the Pacific Ocean, where some sites present more than 15 species, while a few sites show more than five species in the Atlantic (Simpfendorfer et al., 2023). Some of the shark hotspots include the Bahamas and New Caledonia, where studies of about 400 h BRUV observation revealed eight and nine species (Brooks et al., 2011; Juhel et al., 2018). Moreover, FNA showed a high abundance of sharks, which seems greater than the Bahamas (i.e., 0.78 vs. 0.28 shark/hour, Brooks et al., 2011) and other south Atlantic oceanic islands such as Ascension (0.57, Weber et al., 2018), Trindade (0.21, Pimentel et al., 2019), Saint Peter and Saint Paul Archipelago (0.36, Pimentel et al., 2019), and Principe (0, Vasco-Rodrigues et al., 2016). In general, the shark abundance in FNA is three-fold the estimates for Western Atlantic reefs and 1.3–2.7 times (depending of the model) the estimates of the Central Pacific (MacNeil et al., 2020), where hotspots such as New Caledonia (1.5, Juhel et al., 2018) and the Palmyra Atoll (>2, Bradley et al., 2017) are found.
Small-scale protection can promote positive effects for shark abundance (Young et al., 2015). In some cases, shark abundance inside MPAs is higher than in adjacent areas, such as in Fiji (inside no-take reserve: 0.8, outside: 0.3 in.; Goetze and Fullwood, 2013) and Indonesia (inside MPA: 0.6−0.8, outside: <0.1 in.; Jaiteh et al., 2016). In FNA, similarly, shark abundance inside the no-take MPA is almost twice the outside level (inside: 0.94, outside: 0.54 in.), a difference that could be related to the fact that 70 % of the island has been under protection since 1988 (ICMBio, 2017). However, the biomass of sharks was higher outside the no-take MPA, and the protection level was not the main driver of shark abundance in FNA. The greater abundance inside FNA’s no-take MPA is probably due to the avoidance behavior of sharks to higher human use such as boating and fishing in the sustainable use area. It might, however, also be related to the presence of nursery and feeding grounds in shallow waters with beaches and reefs (Afonso et al., 2016; Bond et al., 2012; Garla et al., 2006; Rangel et al., 2023), showcasing the protection of essential habitats as fundamental to shark conservation success in MPAs.
The establishment of MPAs is indeed among the best strategies for marine conservation, allowing shark population maintenance and recovery when properly created and managed (Halpern, 2014; MacKeracher et al., 2019; Young et al., 2015). For instance, the three most abundant shark species in FNA (C. perezi, N. brevirostris and G. cirratum) are considered Endangered or Vulnerable by the International Union for the Conservation of Nature (IUCN, 2022). These animals are only recovering in locations with special shark protection and fisheries management measures, like the shark sanctuary established 2011 in the Bahamas (Gallagher et al., 2021).
Drivers of shark distributionAccording to previous studies, the observed species are commonly found in shallow waters, reefs and sandy areas of insular shelves (Garla et al., 2006; Wetherbee et al., 2007). The present study cannot confirm depth as a driver of abundance but it showed – as hypothesized - higher abundances on reefs and closer to beaches. Both environments are important areas for reproduction (Afonso et al., 2016), feeding (Garla et al., 2017), and nursery grounds of local sharks (Garla et al., 2006; Wetherbee et al., 2007), and for the occurrence of migratory species, such as tiger sharks, as shown here. In fact, dependence on coastal habitats brings numerous, and growing, challenges to marine species. For example, Garla et al. (2017) showed that N. brevirostris behavior is easily altered as they retreat to deeper waters as soon as people enter the water for a swim. Many anthropogenic activities affect sharks (Bond et al., 2012; Garla et al., 2006), including habitat degradation, boat traffic, pollution, and tourism (Afonso, 2024; Garla et al., 2017). Thus, the growing tourism and pollution in shallow waters of FNA have a high potential to impact local and migratory shark species.
Reef environments also drive shark abundance (Espinoza et al., 2014), even when composed of rocky formation as in FNA (Floeter et al., 2008). These same healthy reefs attract divers since reefs aggregate the marine life that most divers want to enjoy. The high shark abundance close to diving sites, which includes local and migratory species, signals that coastal waters are shared by sharks and divers. An increase in the frequency of interactions could lead to heightened stress levels in sharks and changes in their behavioral ecology (Gayford et al., 2023).
Fishing grounds are also correlated with shark abundance, suggesting sharks are squeezed by human activities from both inside the no-take MPA and sustainable use area. Therefore, in these locations, sharks are affected by several human activities at once. Bond et al. (2012) conducted a study in the Caribbean showing that fishing pressure can be a more important driver than environmental factors to describe the abundance of sharks. Fishing has a long tradition in FNA, and some resources dependent on deeper habitats found outside the no-take MPA are currently overexploited (Pimentel et al., 2020). Although the prey of sharks found around the FNA include cephalopods, crustaceans, marine mammals, and sea turtles, the majority is composed by teleosts (Garla et al., 2017; Simpfendorfer, 1992). As also seen in other places around the world, sharks seem to compete with fishermen for areas with still flourishing fish assemblages (Robinson et al., 2022). Indeed, as hypothesized, this research showed a strong relation between sharks, fishing grounds, and fish communities of high trophic levels, signaling a bottom-up control process in the food web and in fishing activities. This corroborates that prey biomass is among the most important drivers for shark abundance (Goetze and Fullwood, 2013), as fishing resources are for fishermen (Tanaka et al., 1991). This overlap of frequently used areas and resources represents a serious conflict and is worrisome, especially for remote and small oceanic islands where even low fishing effort can cause resource overexploitation and local extinctions (Luiz and Edwards, 2011; Pimentel et al., 2020).
Although the results of this study are robust, a clear sampling effort imbalance towards the insular western side exists. One reason for the imbalance is the relative inaccessibility of the exposed southeast side (therefore costlier), which experiences rough sea conditions, making it unsuitable for research for most of the year. While the imbalance does not introduce a bias in the analysis, it is advisable to gather more information on the southeast side of the island to enhance our understanding and representation of shark numbers, distribution, and biodiversity.
Conservation measuresThe no-take MPA, which has rigorous regulations for the use of its natural resources and strict rules for visitation (ICMBio, 2017), is one step to protect the marine ecosystem around the archipelago. The area is important for sharks because it includes nurseries (Bond et al., 2012; Garla et al., 2006), biodiversity hotspots (Rangel et al., 2023), and reproduction sites (Afonso et al., 2016; Rangel et al., 2023), and is part of an intercontinental migratory corridor of tiger sharks (Afonso et al., 2017), being recently considered an international Important Shark and Rays Area (IUCN SSC Shark Specialist Group, 2025). However, many FNA reefs and beaches are in the sustainable-use zone, an area heavily shared between human- and shark kind (and other users), and site maintenance will need to keep relying on careful management for long-term sustainability. Therefore, despite increasing tourism, the carrying capacity of dive sites and beaches should not be exceeded.
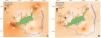
The discrepancy between the biomass and abundance of sharks analyzed in this study (Fig. 3A and B) suggests that while the current no-take MPA protects the majority of small sharks, it does not encompass the entire home range of resident sharks (Fig. 3B). Critical sites for larger and more fecund adult sharks remain unprotected. Adults and juveniles reside in different locations according to size, vulnerability, behavior, and prey (Afonso et al., 2016; Garla et al., 2017), and adults (e.g., C. perezi) often have a larger home range while juveniles show a higher - but decreasing - site fidelity (Garla et al., 2006; Wetherbee et al., 2007). For this reason, an increase of 1,500 hectares in the west of the no-take MPA is proposed for the protection of deeper sites where the largest and more fecund sharks were found (Fig. 3B, purple line). Studies carried out on the mesophotic reefs around FNA have suggested a similar approach based on the presence of unique diversity and ecosystems (Pimentel et al., 2020) and of fish spawning aggregations (Pinheiro et al., 2021). Based on these and other results, Pinheiro and Pimentel (2021) and colleagues proposed a revised border of the no-take MPA which could be combined with the extension suggested here (Fig. 3B, purple line). Alternatively, a fishing ban could be achieved during the revision of the management plan of the sustainable-use MPA, which is assessed every five years. Merging the two proposals would encompass more habitats under protection and monitoring, but also would increase prey availability for predators. This expanded area, in addition to protecting local sharks, would enhance the conservation of a critical migratory zone for species such as tiger sharks. FNA lies within their migratory route, indicating that it serves as a key breeding aggregation site (Carmo et al., 2019; Rangel et al., 2023).

The coastline of FNA along with the border of the existing no-take MPA (blue) with an interpolation over the abundance of sharks, lower abundances being lighter than high abundances (A) and an interpolation over the sum of the biomass of sharks, lower biomasses being lighter than high biomasses along with the proposed extension (purple) in the south-west part of the no-take MPA (B).
Shark-human interactions, particularly with tiger sharks, are an ongoing concern in FNA due to shared use of coastal waters. While tiger sharks only account for a small percentage of sharks in the area, they pose a greater risk due to their size and predatory behavior, and the fact that they occur near areas extensively used by tourists and divers in FNA. Non-invasive methods such as drones, shark spotter programs, and electronic deterrents can help reduce risks by providing early warnings and deterring sharks from populated areas. Educating the public about shark presence and behavior is essential for reducing dangerous interactions. Implementing such measures, alongside enhanced shark habitat protection, can ensure the safety of both humans and sharks while promoting sustainable ecotourism in FNA.
This study provides the first assessment of social-environmental drivers for shark abundance and biomass in the southwestern Atlantic Ocean using BRUVs. While the abundance was high compared to that of other areas on a global and a regional scale, the data show that shark populations might be affected by interactions with men. Sharks are exposed to pressures from fisheries, tourists, and divers. It is crucial to maintain the current level of management of tourism and diving to avoid increasing the stress on natural environments (Luiz, 2009; Mello et al., 2025), which include sharks. Moreover, our results indicate the necessity of a larger no-take zone as the home ranges of larger individuals – which present higher fecundity and play an important ecological role – of endangered species are not fully protected by the current no-take MPA. Besides further protecting shark habitats, an enlargement of the no-take zone could reduce the competition with fisheries for prey as well as benefit mesophotic reefs where shark prey could accumulate. Since the island’s economy strictly depends on ecotourism, these conservation and management measures are potential drivers for a sustainable future for both sharks and humans in FNA.
CRediT authorship contribution statementKirsten Wohak and Hudson T. Pinheiro conceived the ideas and designed the analyzes; Hudson T. Pinheiro, Caio R. Pimentel, Stephanie D.T. Delfino, Bianca Rangel, Ricardo C. Garla, and André S. Afonso collected the data; Kirsten Wohak led the writing of the manuscript. All authors contributed critically to the drafts and gave final approval for publication.
The authors declare that they have no known competing financial interests or personal relationships that could have appeared to influence the work reported in this paper.
We would like to thank our great friend M. Vilella and the staff at his Pizzaria Namoita for all their care during our stay in Noronha. We are grateful to K. V. Bastos (CIUFES) and R. Francini-Filho (CEBIMar-USP) for help with logistics; J. C. Marenga, A. Carvalho and the crew of the vessel Capitania I; the whole Marine National Park team for their support. Fee waivers, administrative and environmental authorizations were provided by the Administration of Fernando de Noronha (ATDEFN), the Brazilian Environmental Agency (ICMBio, license #64991-3). We thank professors S. Floeter, and C.E. Ferreira and the students of the discipline Ecology, Evolution and Conservation of Reef Fishes (2023), for constructive feedback on the project. On top, we thank the Fundação Grupo O Boticário de Proteção à Natureza (grant 1141_20182) for research funding, the Fundação de Amparo à Pesquisa do Estado de São Paulo (FAPESP) for research funding and fellowship (grants 2019/24215-2 and 2021/07039-6), and M. Zinneck and I. dos Santos for administrative support. Paul G. Allen Philanthropies/ Global FinPrint initiative provided RCG with equipment and resources for the 2017 BRUV data collection. Finally, this work was supported by Fundação para a Ciência e Tecnologia, I. P (FCT, Portugal) through national funds granted to ASA (2021.02566.CEECIND/CP1656/CT0026; https://doi.org/10.54499/2021.02566.CEECIND/CP1656/CT0026), to the Centre for Functional Ecology - Science for People and the Planet (UIDB/04004/2020; https://doi.org/10.54499/UIDB/04004/2020), and to Associate Laboratory TERRA (LA/P/0092/2020).
The following is Supplementary data to this article: