


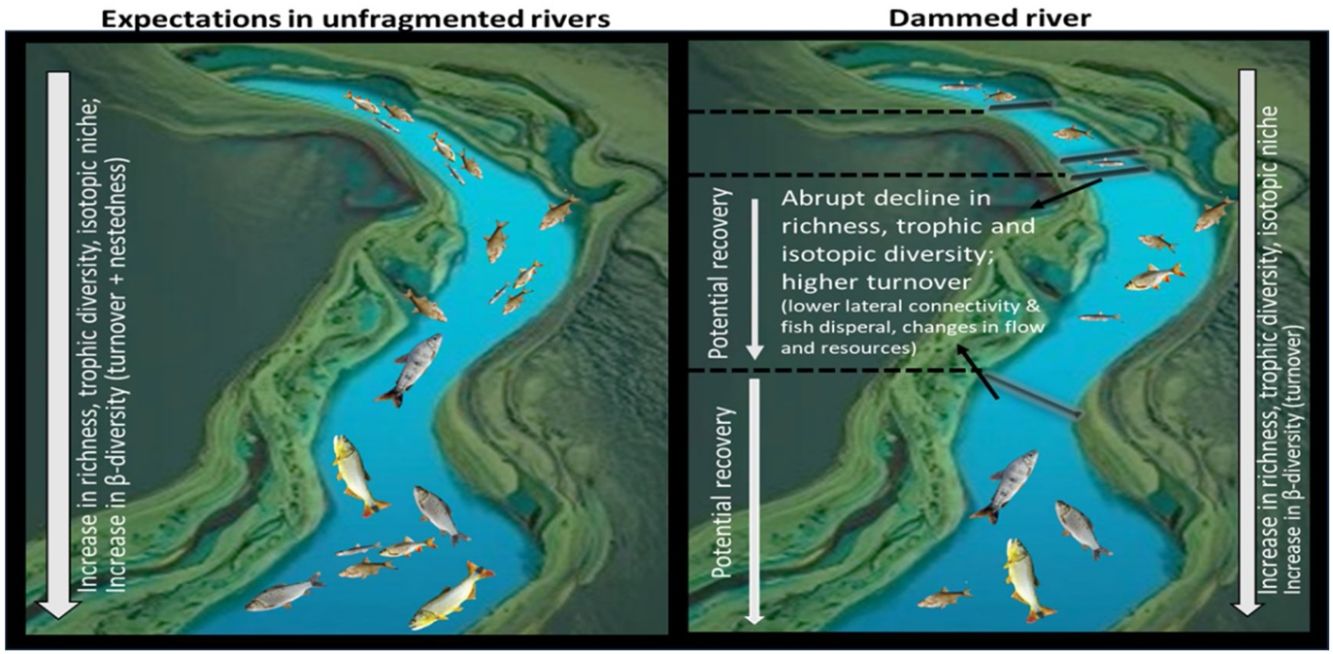

In naturally flowing waters, communities are expected to increase their taxonomic and functional diversity as well as increase the complexity of food web architecture along the longitudinal gradient from headwaters to mouth. However, these theories do not necessarily apply to dammed rivers. We analysed fish communities at 12 locations along the 1700 km stretch of the transnational Uruguay River. We determined species richness, beta-diversity and its components (turnover and nestedness), trophic diversity, and isotopic niches at community level, with particular focus on areas upstream and downstream of the four existing dams. We estimated trophic diversity metrics based on diet analysis, and isotopic niche breadth based on Bayesian isotopic niche models. We detected consistent longitudinal changes, supporting predictions from the River Continuum Concept. However, taxonomic richness, trophic diversity, and isotopic niche decreased abruptly immediately downstream of dams, and the component contributing the most to beta diversity was turnover, with the highest values occurring mainly after the cascade of dams in the upper Uruguay River, fitting expectations from the Serial Discontinuity Concept. The dam-free stretches of the Uruguay River allowed the recovery of ecological diversity as fish richness and trophic and isotopic niche increased. The negative impacts of dams should urgently be considered in the Neotropics, where many large dams are projected.

Several theories have been proposed to explain the functioning of river systems, predicting changes in communities and the architecture of food webs along the longitudinal gradients (e.g., Vannote et al., 1980; Junk et al., 1989; Thorp et al., 2008). One of the earliest theories, known as the River Continuum Concept (RCC) (Vannote et al., 1980), predicts longitudinal gradients in community composition, food webs, and ecosystem-scale processes from headwaters to mouth. Evidence from different climatic regions shows increasing ecological diversity (e.g., increase in species richness and number of links in trophic webs) from headwaters to mouth (e.g., Pease et al., 2012). However, most large river basins in different parts of the world have been significantly altered in their hydrology and geomorphology due to dam construction (Dudgeon et al., 2005) and South America is no exception (Agostinho et al., 2007; Winemiller et al., 2016). The Serial Discontinuity Concept (SDC) (Ward and Stanford, 1983; 1995) arose as a modification of the RCC to explain the functioning of flow-regulated ecosystems. This theory postulates that fluvial ecosystems have a predictable longitudinal gradient in biophysical conditions, which depend on environmental conditions and the position, functioning, and distance to dams (Ward and Stanford, 1983; 1995). Often, river stretches are interrupted by a series of consecutive dams. The spatial distribution of barriers along the longitudinal gradient of the river (i.e., dam cascades) can strongly affect downstream ecological patterns (e.g., Barbosa et al., 1999; Santos et al., 2018). The cumulative effects of such series of dams on changes in hydrology, sediment and nutrient retention, and physico-chemical processes represent a stronger impact than the combined effects of independent dams (Santos et al., 2018). These environmental changes can affect local communities, including shifts in fish composition (Barletta et al., 2010), and the structure of food webs (Ruhí et al., 2016). Some studies have found pauperization of some functional groups upstream and downstream of dams (e.g., de Bem et al., 2021), and an increase in the proportion of generalist species of fishes after dams (Turgeon et al., 2019). Declines in downstream diversity, population sizes, and genetic diversity in upstream reaches of the dam cascade due to isolation caused by habitat fragmentation have also been reported (Ribolli et al., 2021). Moreover, habitat fragmentation due to dams could result in species loss but also the addition of other species downstream of the dams, thus altering beta diversity (i.e., changes in species diversity between communities within a region) by modifying longitudinal patterns of turnover (degree of species replacement) and nestedness (subset of species present in the most diverse site) (Ganassin et al., 2021).
The presence of dams also affects the availability of basal food sources, leading to changes in the ecological niche utilized by the species (Guo et al., 2023). Stable isotope analyses (SIA) facilitate the study of global changes in ecological niches using, for example, isotopic niches areas as proxies of trophic diversity in food webs (Newsome et al., 2007) over a relatively long-time span (as stated originally by Layman et al., 2007a). In particular, SIA has enabled the identification of changes in community functioning indirectly induced by the presence of dams (primarily changes in hydrological flows affecting basal resources) (Guo et al., 2023).
The aim of this work was to determine the changes in ecological fish diversity, as a combination of different metrics of diversity (i.e., species richness, beta-diversity, trophic and isotopic diversity) along the fluvial gradient of a major South American river, the Uruguay River, within the framework of existing theories for regulated and unregulated rivers. We hypothesized that, in contrast to expectations from unregulated systems, dams would promote a decline in ecological niche, species diversity and a higher species turnover along this long river longitudinal gradient.
MethodsStudy areaThis research was conducted along a stretch of approximately 1700 km of the main course of the Uruguay River, which originates in Brazil and whose middle and lower sections separate Argentina and Uruguay (for more information see Appendix S1 in Supporting Material [SM]). Four hydroelectric dams operate along the Uruguay River: three in the upper section: Machadinho (1140 MW/h capacity; opening date: 2002), Itá (1450 MW/h; opening date: 2000), and Foz de Chapecó (855 MW/h; opening date: 2010), and one in the lower section, Salto Grande Dam (1890 MW/h; opening date: 1979) (Table S1in SM).
The middle as well as the final section of the upper section of the river remain largely undisturbed in terms of hydrology, with an unfragmented section of ca. 1,000 km. The upper Uruguay River and the upper part of the Middle Uruguay River are characterized by a channelized system (sites 1, 2, 3, 4) without floodplains and a few low-flow tributaries. The largest floodplains and main tributaries occur in the lower part of the Middle (sites 5, 6, 7, 8) and in the Lower sections (sites 9, 10, 11, 12) of the Uruguay River. The latter has high productivity, associated with floodplains and the formation of marginal pools (Zaniboni-Filho and Schulz, 2003) (Appendix S1 in SM).
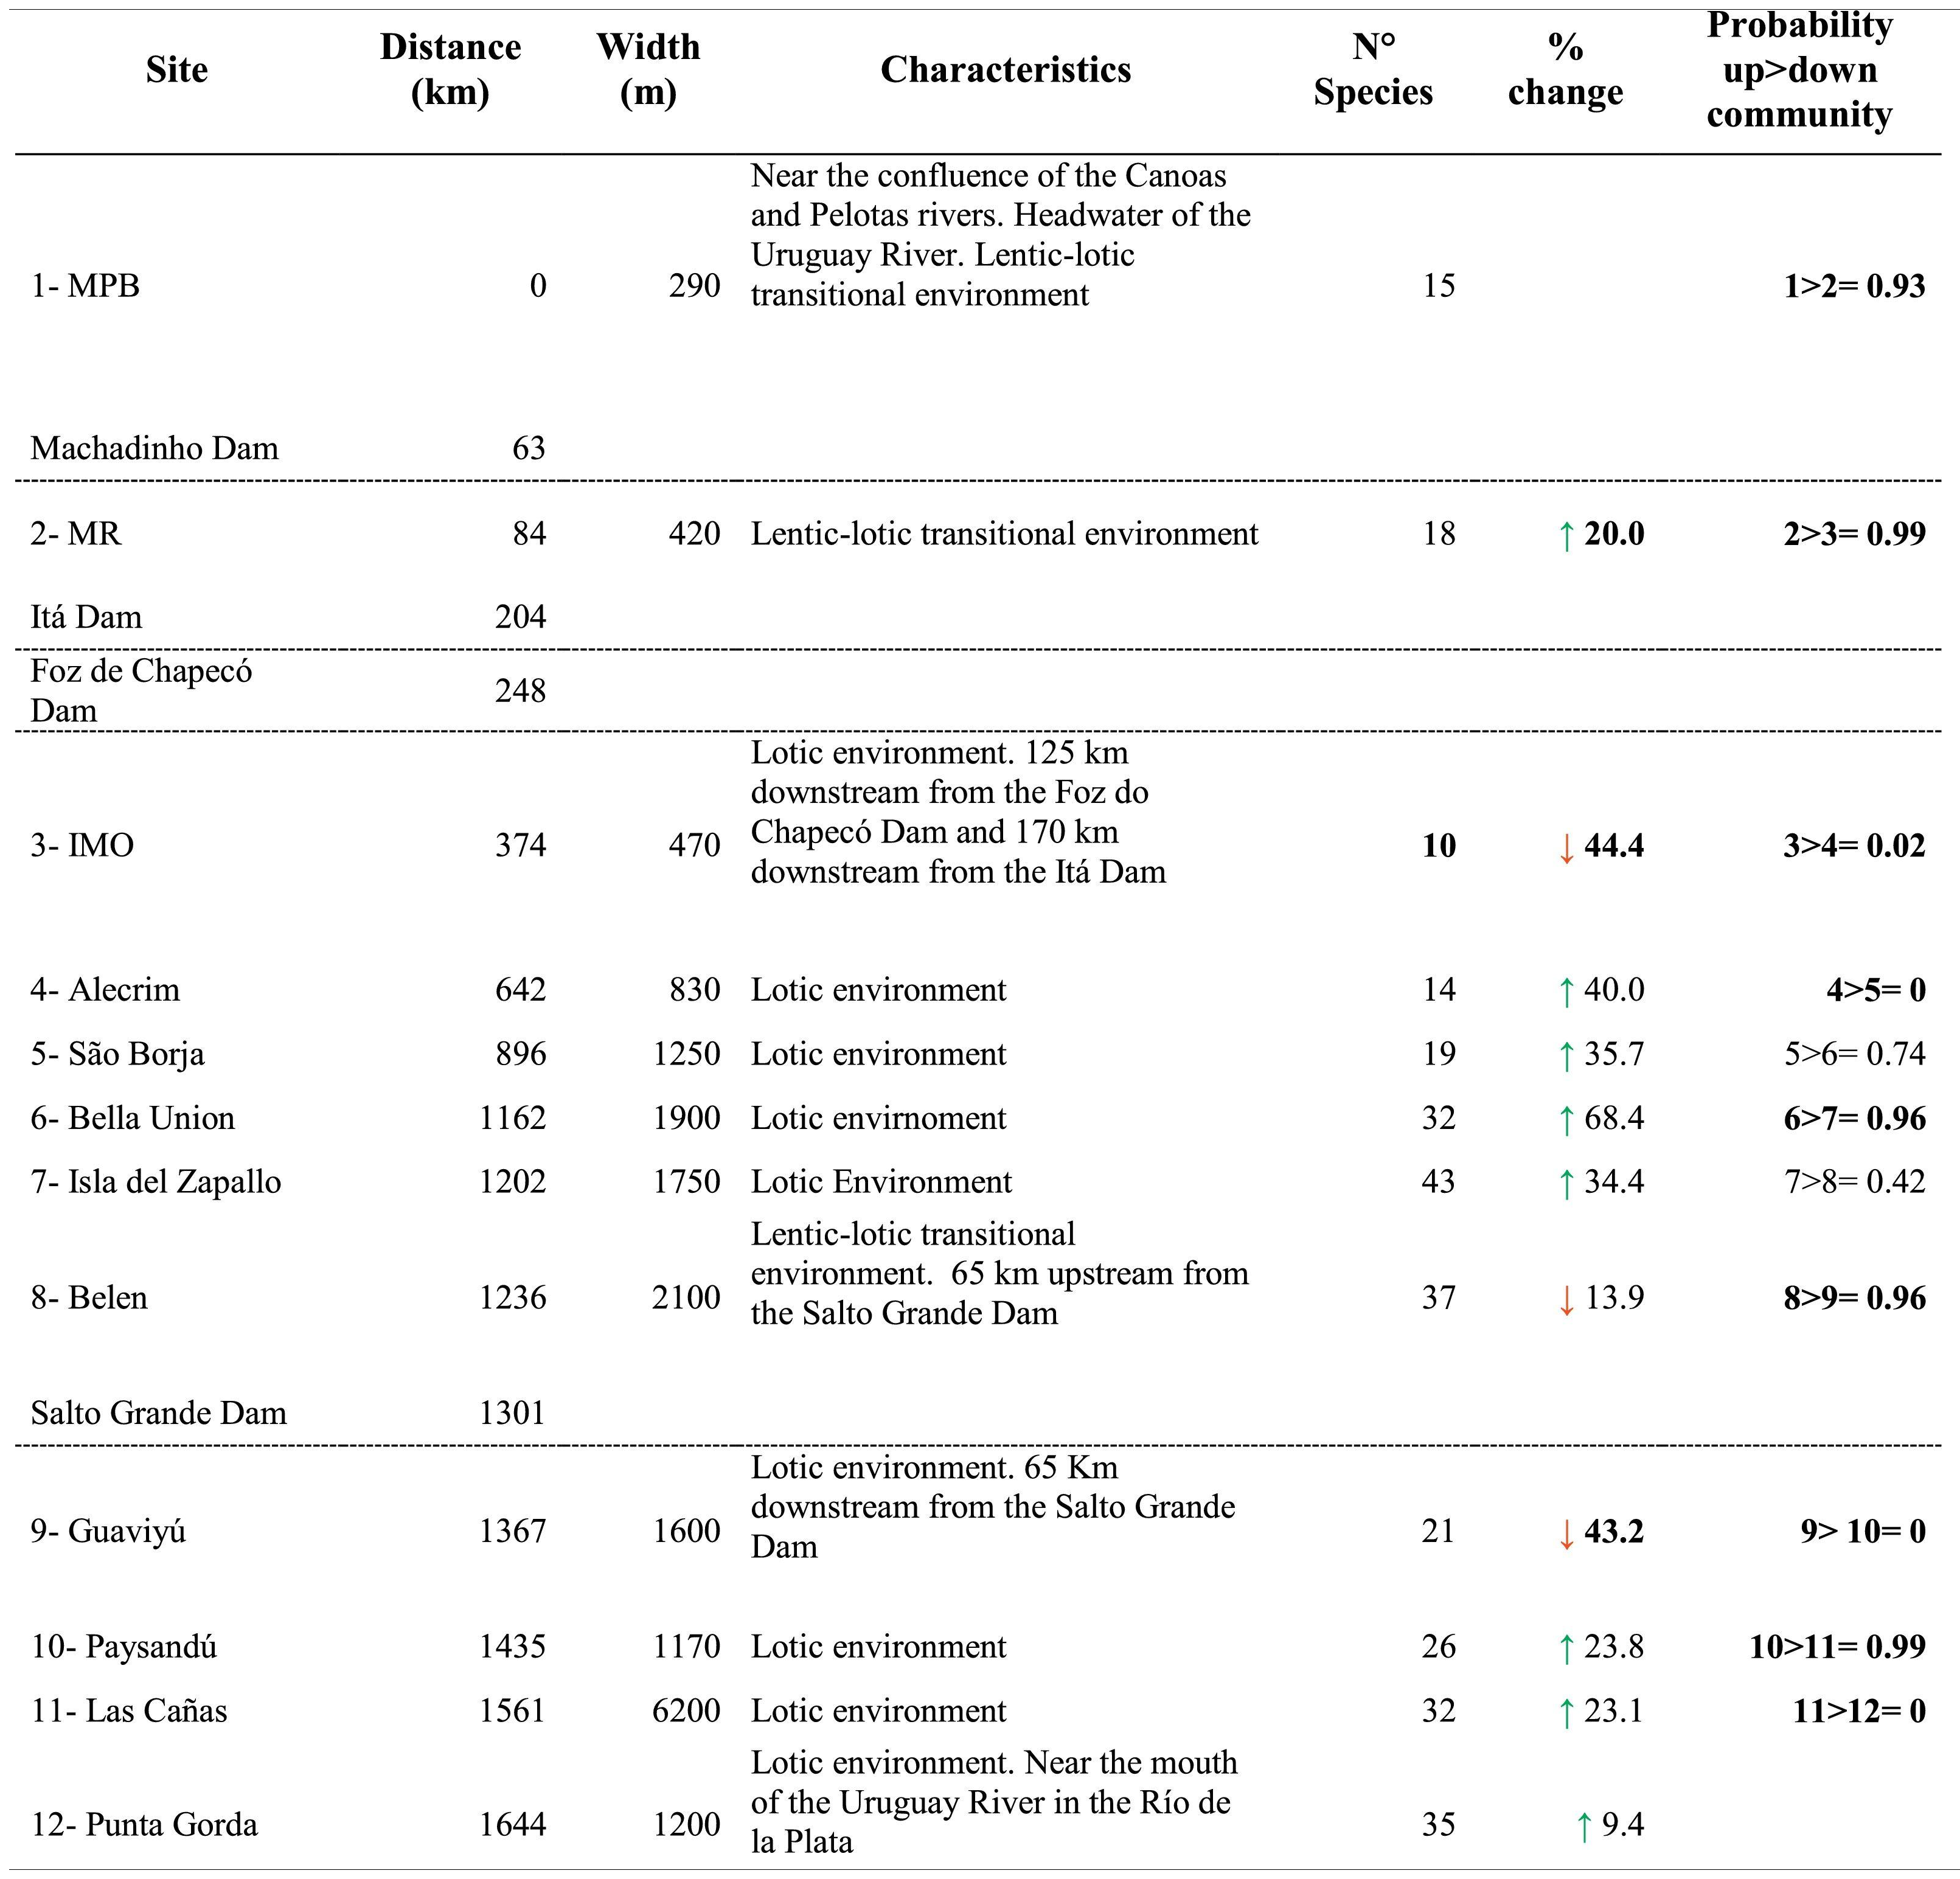
Fish samplingFish communities were sampled during the austral autumn of 2017 (May-early June) at 12 sites along the main course. Three sites were sampled in the upper river section, five in the middle, and four in the lower section (Fig. 1; Table S2 in SM). Some of the sites are located in the areas of influence of the dams, in transition zones between the lentic-lotic environment (e.g., sites 1, 2 and 8), while others are located in running sections (Table 1). The sampling sites were chosen considering available monitoring programs along the river to facilitate logistics.

Location of the 12 sampling sites along the Uruguay River. From headwaters to mouth: site 1-MPB: Barracão; Site 2-MR: Marcelino Ramos; Site 3-IMO: Mondaí; Site 4-ALE: Alecrim; Site 5-SB: São Borja; site 6- BU: Bella Unión; Site 7-IZ: Isla del Zapallo; Site 8-BEL: Belén; Site 9-GVY: Guaviyú; Site 10-PAY: Paysandú; Site 11-LC: Las Cañas; Site 12- PG: Punta Gorda. The location of sampling sites is represented by black circles; the location of dams is represented by white circles. Sites 1 to 5 are in Brazil, sites 6 to 12 were sampled from the Uruguayan side of the river.
Sampling sites and dams’ location, fish species richness with change relative to the upstream site (%) and probability of differences in SEAc between sites along the longitudinal gradient of the Uruguay River.
Distance = distance from each site to site 1, located at the headwaters of the Uruguay River (km); the green arrow represents species gained; the red arrow represents species lost. Probability up > down* = Probability that a given site has a higher SEAc than the site immediately downstream. Significant probabilities (i.e., higher than 90%) in Bayesian analysis are shown in bold. Dotted lines indicate the presence of dams.
*Probability in Bayesian statistics models is a degree of plausibility of occurrence of a specific event, based on prior distribution that depends on previous knowledge.
In the upper section of the Uruguay River (sites 1-MPB, 2-MR, 3-IMO, Brazil), ongoing monitoring programs utilized a combination of gillnets and trammel nets (Appendix S1, SM). Both sets of nets were deployed in the littoral zone in the evening and left in place for ca. 12 h. Also, a seine net trawl and 3 casts of cast nets (with a mesh size of 8.0 mm) were placed in the littoral zone during the daytime. The fish community of the middle and lower sections was sampled using multi-mesh Nordic gillnets (Appendix S1 in SM). At each site, eight sets of gillnets were placed, four in the littoral zone and four in the pelagic zone at 2–5.0 m depth, and left in place for ca. 12 h from sunset to sunrise. Whenever possible, commercially important large fish specimens were obtained from local fishermen (at sites 6, 7, 8, 11, and 12) to supplement the sampling, wherever these species (known to be present along the entire river) were not captured with the Nordic multi-mesh gillnets.
All fishes collected were identified in the field to the lowest taxonomic level possible (Table S3 and S4 in SM).
Sampling for stable isotope analysesFlank muscle samples were collected from N = 5 individuals (or all individuals if less than 5) per species per site, aiming to cover a wide range of body sizes (Table S3 in SM). After processing (Appendix S1 in SM), samples were sent to the Center for Stable Isotopes, University of New Mexico for stable isotopes analysis. The results of stable isotopes ratios were expressed as ‰ (parts per thousand) and were calculated using the standard formula:
where δX represents δ15N or δ13C, R sample is the ratio of heavy to light isotopes of element X and R standard is that isotopic ratio in a standard. The C:N ratio was verified with laboratory results, and if greater than 3.5, the lipid isotopic signal was arithmetically corrected using the equations suggested for aquatic animals by Post et al. (2007).Taxonomic richness and β-diversity
The number of species captured at each sampling site (α diversity) was used to describe longitudinal patterns. Based on the presence-absence matrix of species per sampling site (Table S4 in SM), we calculated beta (β) diversity and its components (turnover and nestedness) for both the entire system (i.e., multiple beta diversity) and between particular pairs of sites (i.e., pairwise beta diversity), using the Sørensen dissimilarity index (Baselga and Orme, 2012; Appendix S1, SM). The pairwise beta diversity analysis results in three matrices: the Sørensen dissimilarity index matrix (βsor) that represents the total compositional variation (between 0 and 1); the Simpson dissimilarity index matrix (βsim) that indicates changes of species due to species turnover, and the nestedness matrix (βnes) resulting from βsor – βsim. From these matrices, we analyzed pairwise beta diversity at two levels: (1) across the entire longitudinal gradient, comparing pairs of sites with reference to site 1 at the headwaters (hereafter referred as “pairwise beta diversity”); and (2) step-wise beta diversity, comparing pairs of neighboring sites (e.g., site 1 vs. 2; site 2 vs. 3, and so on along the entire longitudinal gradient).
Trophic web metrics, trophic and ecological niche diversity analysesBased on the information from the stomach content analysis conducted by López-Rodríguez et al. (2019), the relative abundance of each food item consumed was calculated for each species at each sampling site. This information was used to calculate the trophic position of each fish species/site, following the modified equations of Winemiller (1990) (Appendix S1 in SM). The trophic positions of the consumed items were estimated according to the literature. Food webs were reconstructed and the number of nodes in the food web, number of trophic links, and linkage density (number of links/species) were calculated (Appendix S1 in SM). Due to the high correlation between these three metrics (Fig. S1 in SM), we chose to work with trophic links, since this is the trophic diversity metric most widely used in the literature (e.g., Pease et al., 2012) and hereafter refer to it as trophic diversity.
The isotopic niche breadth calculation was performed within a Bayesian model framework (Jackson et al., 2011; Appendix S1 in SM)). Since a large isotopic niche area implies a wide diversity in the use of the environment by the consumers, it is considered more accurate to use the standard ellipse area corrected for sample size (SEAc) as an indicator of ecological niche diversity (Newsome et al., 2007). We used isotopic signatures from consumers (fish) as input for the models.
The combination of diet analysis and SIA provides different temporal information, from the last few hours (diet analysis; Muñoz et al., 2009) to the past 15–60 days (SIA in muscle; Buchheister and Latour, 2010).
Statistical analysesWe adjusted linear regressions between captured species richness with the positions of each site along the longitudinal gradient of the river. To assess changes in species richness between sites, we calculated the percentage change (gain or loss) between a given site and the site immediately upstream. As a complementary approach, we fitted linear regression models between beta diversity and its components (turnover and nestedness) with the position in the longitudinal river gradient, both for values obtained from pairwise comparisons between each site and the reference site (site 1), as well as between neighbouring sites. Prior to the analyses, data in the dissimilarity matrix were standardized.
For trophic diversity (number of trophic links) we also fitted linear models.
For the ecological niche analyses, we pairwise tested the probabilities of SEAc being higher in one site than in another site of interest (e.g., pre vs. post dam) (Jackson et al., 2011).
All the statistical analyses were done using the open-source Statistical Software Package R (R Development Core Team).
Results92 fish species were collected in total from all sampled sites, accounting for 1364 samples for stable isotopes and 2309 for dietary analysis (Table S3 in SM).
In general, fish species richness (alfa diversity) increased along the longitudinal gradient (R2 = 0.49; p = 0.01) but showed sharp declines in the sites located downstream of the dams. The greatest loss of species occurred downstream of the dam between sites 2 and 3, with a loss of 44% of the species, and downstream of the Salto Grande Dam, between sites 8 and 9, with a loss of 43% of the species (Table 1; Fig. 2a). The migratory species Megaleporinus obtusidens and Prochilodus lineatus occurred from site 5 and downstream, while Salminus brasiliensis was found at site 7 and distributed downstream along the rest of the longitudinal gradient (Table S3 in SM).
; and c. Mean standard ellipse area (SEAc- refering to the isotopic niche breadth), at each sampling sites. Boxes indicate the SEAc with Bayesian models and 50, 75, and 95% credibility intervals. Dashed lines indicate the location of dams. The parameters of the Bayesian model were: 95% confidence intervals, number of chains = 2; iterations = 200000; burning = 10000, and thins = 10, and the ellipse built considered 40% of data points, as implied by SEAc.")
Changes in fish ecological diversity at community level along the longitudinal gradient of Uruguay River: a. Species richness; b. Trophic diversity (number of trophic links); and c. Mean standard ellipse area (SEAc- refering to the isotopic niche breadth), at each sampling sites. Boxes indicate the SEAc with Bayesian models and 50, 75, and 95% credibility intervals. Dashed lines indicate the location of dams.
The parameters of the Bayesian model were: 95% confidence intervals, number of chains = 2; iterations = 200000; burning = 10000, and thins = 10, and the ellipse built considered 40% of data points, as implied by SEAc.
Remarkably, despite the sampling effort being greater in the upper section (by performing three different methods), we found lower species richness there than in the middle and lower sections. Also, despite the relatively low number of sampling points in space and time, the patterns found were strong and aligned with expectations.
Of the three different beta-diversity estimation, two of them, multiple beta-diversity and turnover, provided support to the hypothesis that longitudinal trends in diversity existed and were interrupted by dams. Multiple beta-diversity (βSOR, estimated as the multiple comparison of all possible pairs of sites) was high (βSOR = 0.82), with turnover being the component with the highest contribution (βSIM = 0.72), while nestedness had a low contribution to the difference in species composition between local communities along the gradient (βNES = 0.10). In the analysis comparing each site with the reference site (i.e., site 1), pairwise beta diversity also increased along the longitudinal gradient, showing a marginally significant relationship with the distance to the headwaters (R2 = 0.259; p = 0.06). Turnover also significantly increased along the longitudinal gradient (R2 = 0.305; p = 0.04), but nestedness did not show a clear pattern (R2 = 0.110; p > 0.05) (Fig. 3a; Table S5 in SM). The highest pairwise beta diversity (i.e., the highest differences between communities) and species turnover were found between sites 1 and 9 (downstream of Salto Grande Dam). In contrast, beta diversity and species turnover from the step-wise comparison between consecutive sites decreased along the longitudinal gradient, with a significant relationship with the distance to the headwaters (R2 = 0.864; p < 0.001 and R2 = 0.571; p < 0.004, for total beta diversity and species turnover, respectively), while nestedness again did not show a significant pattern with the distance to the headwaters (R2 = 0.044; p > 0.05) (Fig. 3b; Table S5, SM). In this case, the highest beta-diversity and turnover were observed between sites 2 and 3 (i.e., the sites separated by two dams), whereas the lowest beta diversity was observed in the stretch between sites 6 and 8.
 along the longitudinal gradient of the Uruguay River: a. Pairwise comparison between each site and the first site (site 1) at the headwaters; b. Step-wise: pairwise comparison between each site and the neighbor site, located downstream. Dashed lines indicate the presence of dams between those sites.")
Changes in pairwise beta-diversity and its components (turnover and nestedness) along the longitudinal gradient of the Uruguay River: a. Pairwise comparison between each site and the first site (site 1) at the headwaters; b. Step-wise: pairwise comparison between each site and the neighbor site, located downstream. Dashed lines indicate the presence of dams between those sites.
Trophic diversity (expressed as the number of trophic links) followed a similar pattern to taxonomic richness, i.e., a general trend of increase along the longitudinal gradient showing interruptions in the areas with dams. The number of trophic links recorded in the network ranged from 31 to 289, with the minimum reported at sites 2 and 3 and the maximum at site 12, showing an increase along the longitudinal gradient (R2 = 0.55, p = 0.006), and decreased after the dams (i.e., from 36 to 31 between site 1 and 2, with the strongest decline observed after the Salto Grande dam, from 238 to 105 trophic links) (Fig. 2b).
In the case of isotopic niche area, SEAc presented a strong decrease in the upper reaches coinciding with the presence of the dam cascade (99% probability of having a higher SEAc in site 2 than in site 3, site located downstream the dam cascade), followed downstream by increases and a more even distribution of the isotopic niche in the middle and lower stretches of the river (Table 1; Fig. 2c). Similarly to species richness and trophic diversity, the SEAc showed a reduction after Salto Grande, with a 96% probability of SEAc being higher in the pre-Salto Grande site than in the post-Salto Grande location.
DiscussionThe general longitudinal patterns found (i.e., increased species richness, beta-diversity and turnover of species, trophic diversity, and ecological niche diversity) support the general framework proposed by the River Continuum Concept (Vannote et al., 1980). However, we also found clear evidence of the negative impacts of dams on fish diversity as predicted by the SDC (Ward and Stanford, 1983; 1995), shown by the sharp declines in species richness, trophic diversity, and ecological niche diversity in the sections immediately downstream of the dams, as well as the changes in turnover in paired sites around dams.
Similar evidence partially supporting the RCC was found in the Tennessee River (USA) and major tributaries (23 reservoirs), where fish species richness and the number of functional attributes increased longitudinally (ca. 1500 km) despite being highly dammed (Besson et al., 2023). However, fish species richness and abundance often decrease at sites located further downstream of a cascade of dams, as found in three Brazilian basins (Iguaçu, Paranapanema, and São Francisco River basins) (Ganassin et al., 2021). The decrease in species richness after the dams may be a consequence of the changes in environmental conditions (Pelicice et al., 2018). In the dam cascades located in the upper Uruguay River, we observed an abrupt reduction in species richness from site 2 to site 3, with the latter having the lowest species richness of the entire river. This likely reflects the limitation of fish migration upstream of the dams, as suggested elsewhere (e.g., de Bem et al., 2021; Ribolli et al., 2021). In this sense, we observed the presence of migratory species in the middle reach of the Uruguay River, from site 5 to the mouth, which are sites located downstream of the dam cascades. This had been observed in previous studies where richness of migratory species increased towards downstream reaches of dammed rivers (Pelicice et al., 2018).
The negative impacts on fish ecological diversity indicators, along with their recovery as the distance to the dams increased, align with the predictions of the Serial Discontinuity Concept (SDC) and its modifications (Ward and Stanford, 1983; 1995), thus supporting our hypothesis.
Furthermore, the predominant influence of species turnover on beta diversity among all sites support the notion that dams act as environmental filters, promoting species sorting (López-Delgado et al., 2020) and the introduction of new ones. The step-wise beta-diversity decreasing along the longitudinal gradient suggests that the variation in species composition among neighboring sites decreased as the river potentially receives new species from tributaries in the longitudinal gradient. However, we observed that the highest beta-diversity and turnover occurred downstream of the dam cascade in the upper part of the river. There, we observed the effects of dams preventing the accumulation of species, altering the downstream composition as found in other dammed rivers (Agostinho et al., 2008).
These findings align with our findings at the species richness level, underscoring the impact of dam-induced habitat fragmentation on beta diversity (Edge et al., 2017). Similar patterns have been observed in studies on fish (e.g., Lansac-Tôha et al., 2019; Ganassin et al., 2021) and macroinvertebrates (Wang et al., 2021a).
Empirical evidence shows that taxonomic diversity is usually high in sites located in a highly connected longitudinal gradient (i.e., more central locations), but beta diversity is often low as species compositions are similar due to the absence of dispersal restrictions (Gianluca et al., 2017; Henriques-Silva et al., 2019). These central communities seemed to be present in our study system in the dam-free areas, primarily between sites 6 and 8, where we found high alpha diversity and low differences in community composition. These stretches may also act as species hubs that facilitate biodiversity recovery (Pachla et al., 2022).
The longitudinal patterns in the isotopic niche area were less clear than those observed with alpha and beta-diversity. Several not mutually exclusive factors might be operating on the variability of the isotopic signal. A series of both biotic and abiotic factors directly or indirectly promoted by dams (not analyzed in this work), can promote either high or low isotopic diversity (Box 1). The main abiotic factors potentially affecting ecological diversity include spatial and temporal environmental heterogeneity (Layman et al., 2007b; Turner et al., 2015) and hydrological heterogeneity determined by variability in water flows (Trudeau and Rasmussen, 2003). Biotic factors mainly include a high diversity of basal resources, a local increase in species richness, and the use of a wide diversity of environments and food sources (Delong et al., 2011). Also, the arrival of individuals that move long distances allows for the incorporation of isotopic signals from diverse environments, increasing the isotopic niche area in a given location (Rasmussen et al., 2009; Wang et al., 2021b). This phenomenon could well explain the higher isotopic niche area found for the fish community at the areas near the river mouth and at site 5, where fish could freely move and assimilate resources with potentially contrasting isotopic values along a stretch of 1000 km. Some of these factors could have operated in the long unregulated and thus highly variable stretch in the middle section of the Uruguay River.
Synthesis of factors that may operate promoting changes in isotopic signal and ratios, either due to local characteristics without changes in fish diet (i.e., processes that may be considered artifacts in SIA), or by processes leading to true changes in diet and energy acquisition and flow within communities. Several of these factors can respond to direct or indirect environmental changes promoted by dams.
| Type of variability | Factors leading to higher isotopic diversity of consumers | Mechanisms | Literature example | Potentially operating in this study |
|---|---|---|---|---|
| Biotic factors | High taxonomic and functional diversity of basal resources. | A greater variety of resources may be consumed by individuals | Layman et al., 2007a | yes |
| Different origins of similar basal resources (e.g., detritus). | Resources of different origins (e.g., C3 vs. C4 dominant terrestrial vegetation producing detritus) are consumed by individuals within a species and/or individuals from different species at the community level. | Fry, 2006 | ||
| Higher fish taxonomic richness | Often correlates with high functional richness, and/or differential use of space. E.g., more specialist species can use more resources. | Layman et al., 2007b | yes | |
| Long movement of fish | Implies the integration during weeks of different and distant resources with potentially different isotopic ratios. | Rasmussen et al., 2009; Wang et al., 2021b | yes (mainly in the uninterrupted stretch and near the river mouth) | |
| Abiotic factors | High environmental heterogeneity at different spatial scales | Greater variety of resources offered by different habitats at one time (e.g., riffles and pools, floodplain lakes connected to the river) | Silva-Azevedo et al., 2021 | yes (mainly in the middle and lower sections) |
| High environmental heterogeneity in time | Greater temporal variability of isotopic ratios of benthic algae due to changing flow, either naturally or by dam operation | Trudeau and Rasmussen, 2003; Wang et al., 2021b | yes | |
| Type of variability | Lower isotopic diversity of consumers | Mechanisms | Literature | Potential |
| Abiotic factors | Low environmental heterogeneity (including hydrological homogenization) | Dams may promote homogenization of limnological conditions in the transition zone and reservoir homogenizing isotopic values of resources. | Turner et al., 2015 | yes |
| Pollution | Loss of sensitive taxa and homogenization of basal resources | Wang et al., 2021b |
The dimensions of our river (ca. 1800 km long, with an average discharge above 4000 m3/s) and the scale of our study allowed us to detect the recovery of the system after the negative impacts of dams.
Our results suggest that the dam-free stretches of the Uruguay River play a crucial role in maintaining the river's ecological diversity, as suggested by the recovery of ecological niche areas, mainly in the middle section. Fish passage constructions often fail as upstream movements are allowed but the return of adults and their offspring is not (Agostinho et al., 2007). Therefore, the maintenance of long dam-free reaches and undammed tributaries in the watershed is key to maintaining fish diversity in impacted rivers (López-Delgado et al., 2020). Tributaries can provide food resources and serve as a refuge and feeding areas (Santos et al., 2020; Pachla et al., 2022) and can be used as spawning areas for migratory fish (Reynalte-Tataje et al., 2012) and nursery (Corrêa et al., 2011).
ConclusionsOur results contribute to enriching theoretical frameworks such as RCC and SDC by evidencing a general pattern of longitudinal increases in fish species richness, beta diversity and ecological functions, but also clear negative effects of dams, mainly of the cascade of dams in the upper section of the river. Our findings highlight the need to consider diverse dimensions of diversity (e.g., species richness, beta-diversity, trophic diversity, ecological niche), as dams’ effects go beyond the loss of species. The size and flow of this river, as well as the focus on the entire longitudinal gradient, enabled us to detect ecosystem recoveries within the dam-free section. In the Neotropics, numerous large dams are projected in the coming decades (Winemiller et al., 2016; Pelicice and Castello, 2021). Notably, in the Uruguay River, two additional consecutive hydroelectric dams, Garabí (planned operational power: 2700 MW/h) and Panambí (1800 MW/h), are scheduled in the middle section (1000 km stretch where the river currently flows freely), coinciding with the highest ecological diversity of fish. This calls for attention from the relevant authorities in the different countries involved. The Uruguay River is situated at a triple multinational border, which also implies that environmental monitoring data may be collected at different times and at a specific number of sites and may imply differences in fishing techniques and effort. Through this work, we identified the need to establish and sustain standardized transnational monitoring programs to generate scientific knowledge that properly informs policy and management.
Author contributionsConceptualization: AL-R, MM, IG-B; Methodology: AL-R, IG-B; Investigation: AL-R, AD, SdAS, JP, FTM, DR-T, EZ-F, IG-B; Resources: DR-T, EZ-F, IG-B; Data curation: AL-R, SdAS, IS, JP, IG-B; Formal analysis: AL-R; Writing-original draft: AL-R, MM, IG-B; Writing review & editing: all; Visualization: ALR; Supervision: MM, IG-B; Project administration & Funding acquisition: DR-T, EZ-F, IG-B.
FundingThis research project was partly funded by the Scientific Research Sectorial Commission (Uruguay) (Project CSIC I+D_2016_577-348) and the National Agency for Innovation and Research (ANII) (Project ANII-FCE_2_2016_1_126780).
Conflict of interestsThe authors declare that they have no known competing financial interests or personal relationships that could have appeared to influence the work reported in this paper.
We thank the artisanal fisherman Elbio Russo for his support and collaboration with sampling and fisheries data. We deeply thank the very constructive comments from reviewers and editor. AL-R, MM, IGB, AD, FTM are supported by ANII and PEDECIBA. AL-R received support from CAP-UDELAR. AL-R, MM, IGB also acknowledge the funding from CSIC Groups-2022 #882442 and #883452. MM also acknowledges the support by the Leibniz Institute of Freshwater Ecology and Inland Fisheries, Berlin, Germany, during a stay as senior researcher. EZF thanks CNPq, grant 302860/2014–2, and Engie (Tractebel Energia), Consórcio Itá, and Consórcio Machadinho for financial support.
Fish sampling and handling procedures were approved by the Honorary Commission of Animal Experimentation, Uruguay (CHEA, Permit-ID 309) and the ethics committee of the Federal University of Fronteira Sul, Brazil (permit-ID 23.205.004977/2015-90).
The following is Supplementary data to this article:

