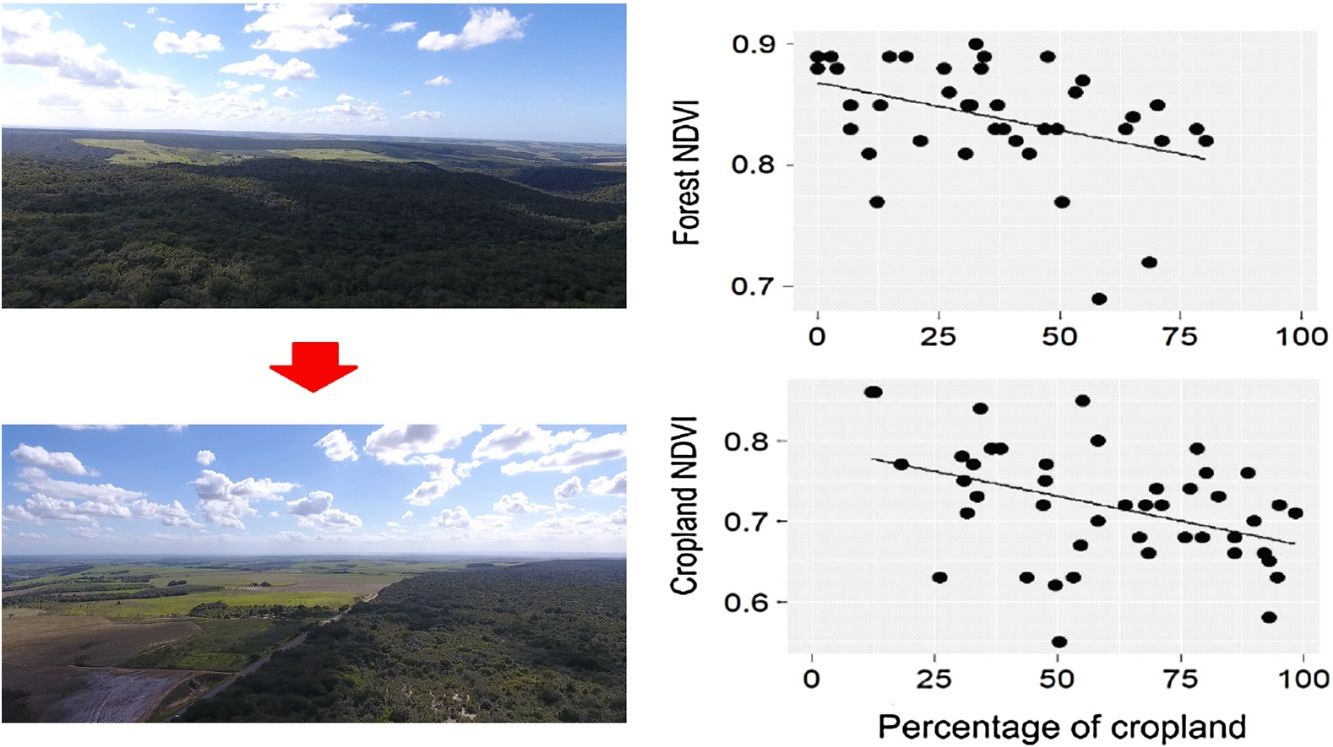
Primary production (PP) is a fundamental ecosystem function that influences several ecosystem services. However, little is known about how changes in landscape structure resulting from agricultural expansion affects forest and cropland production. We investigated the effect of landscape composition and configuration on the PP of forests and sugarcane crops in an old agricultural frontier of the Brazilian Atlantic forest. Using satellite images and a comprehensive dataset of vegetation indices that are proxies of PP (NDVI and EVI), we sampled 1201-km2 landscapes during the rainy and dry seasons of 2011–2016. In each landscape we quantified the indices, the percentage of sugarcane crops, the density of forest edges, and the number of forest patches. The NDVI and EVI of the entire landscape were negatively influenced by the percentage of croplands in both seasons and weakly affected by edge density and number of forest patches. When analyzing the NDVI of forests and croplands separately, both were negatively affected by the percentage of croplands. This indicates that forests and croplands are less productive in more deforested landscapes. The spatial variability of NDVI and EVI within the landscapes, estimated with coefficients of variation, was not affected by landscape attributes. Our findings indicate that landscape composition (i.e. forest cover) is more important than spatial configuration in determining the PP of forest and sugarcane crops, reinforcing the need to conserve forests in agricultural landscapes. We recommend reducing deforestation, restoring abandoned fields, protecting forest remnants and avoiding forest fragmentation to sustain more productive environmental-friendly agricultural landscapes.
Tropical forests have been widely converted into agricultural fields, causing habitat loss and fragmentation and reducing the provision of ecosystems services such as climate regulation, carbon storage and pollination (Laurance et al., 2014; McArt et al., 2017; Birkhofer et al., 2018; Fearnside, 2018). This global phenomenon modifies landscape structure and affects the remaining ecosystem at all levels of biological organization, including the ecosystem functions that directly or indirectly satisfy human needs (Fahrig et al., 2011; Tscharntke et al., 2012). Primary production (PP), an intermediary ecosystem service responsible for the provision of final services (i.e. food, fiber, biofuel), is critical for agricultural activities (Costanza et al., 2007). Although the crop itself contributes to the PP of the agricultural landscape during its growth and development, harvesting cycles periodically eliminate the carbon stored in the croplands. In addition, the establishment of croplands often involve deforestation, reducing the contribution of the remaining forest to landscape PP. While landscape composition refers to the percentage of area covered by different land uses (e.g. percentage of croplands), landscape configuration reflects the spatial arrangement of land covers (e.g. number of forest patches and density of forest edges within the landscape) (Fahrig et al., 2011). Some ecosystem services respond more strongly to landscape composition (Carrara et al., 2015; Arroyo-Rodríguez et al., 2016; Alvarado et al., 2018), others are more susceptible to changes in landscape configuration or respond to both (Lamy et al., 2016). Understanding how the PP of forests and croplands responds to changes in landscape structure may help to identify synergies and trade-offs between food production and nature conservation (Power, 2010).
When a forested landscape is partially converted to large-scale agriculture, the remaining forest is split into patches, forest edges are created elsewhere in the landscape and croplands become inhospitable to many forest-dependent organisms. These structural changes may increase precipitation in the landscape at the expense of forest moisture (Avissar and Liu, 1996; Baidya Roy and Avissar, 2000). In a process known as vegetation breeze, the moist air is pulled away from forests into adjoining croplands and condenses into rain-producing clouds, then is recycled as dry air back over the forest (Avissar and Liu, 1996; Cochrane and Laurance, 2008). The shallow convective clouds have a horizontal spatial scale on the order of 2km, but vertical forces may generate a turbulence mixing that operate at this and other spatial scales (Avissar and Liu, 1996). Although exposed to similar solar radiations, the contrasting vegetation coverings of a landscape warm up the air differently and contribute distinctly to changes in thermic heterogeneity (Avissar and Chen, 1993; Avissar and Liu, 1996). This is particularly the case of tropical rainforests immersed in agricultural fields, where the forest moisture is recycled by dry air from adjacent agricultural areas (Cochrane and Laurance, 2008).
Over time, forest tends to become increasingly dried out with effects that are enhanced by the replacement of native flora by plant groups of reduced leaf area and low evapotranspiration rates (Jipp et al., 1998; Cochrane and Laurance, 2008). Species loss, floristic drift and subtle biomass collapse are among the most relevant biological impacts of forest desiccation, especially along forest edges (Harper et al., 2005; Laurance et al., 2018). Changes in the thermal gradients caused by modifications in temperature may also induce negative effects on the hydrological cycle and climate patterns (Pielke et al., 1998). These biotic and abiotic changes are likely to reduce the PP of agricultural landscapes with low forest cover, high edge density and elevated number of small (<10ha), edge-dominated forest patches. The reduction should be stronger during the dry season due to low water availability for photosynthesis and vegetation breeze. Also, landscape should become more homogenous spatially owing to the cultivation of a few crop varieties and the proliferation of a small number of native plants in the remaining forest patches.
The Brazilian Atlantic Forest is one of the most threatened global biodiversity hotspots (Myers et al., 2000). More than 80% of its original cover have been occupied by cities, cut by roads, fragmented into almost 250,000 forest patches, and replaced by agricultural fields (Ribeiro et al., 2009). Forest conversion to agriculture started in the 16th century following Portuguese colonization and intensified in the last decades of the 20th century (Colonelli, 2009). As in many tropical regions, small-scale agriculture in the Atlantic Forest has been replaced by large-scale monocultures to address industrial requirements, ignoring the depletion of ecosystem services (Foley, 2005; Ferreira et al., 2015; Fearnside, 2018). Although agricultural intensification offers food and energy security, its dependence on the remaining forest remains poorly investigated in the region.
This knowledge gap may be filled up by employing remote sensing techniques. Vegetation indices derived from remote sensors such as the enhanced vegetation index (EVI) and the normalized difference vegetation index (NDVI) have been widely used to study carbon uptake patterns and greenness among vegetation types (Paruelo et al., 2001; Guerschman et al., 2003; Aragón and Oesterheld, 2008; Huete et al., 2008; Shi et al., 2017). They are relatively low-cost and may be applied for a wide range of temporal and spatial scales (Pettorelli et al., 2005). Nonetheless, their use in studies searching for synergies and trade-offs between agriculture and conservation has been very limited. By describing how these vegetation indices vary across space and time in landscapes with different composition and configuration, we may uncover possible agricultural benefits from forest conservation.
In this study we described landscape patterns of PP in a 5000-km2 region of the Atlantic Forest of Northeast Brazil. This region is among the oldest frontiers of sugarcane plantation in the country (Ranta et al., 1998; Ribeiro et al., 2009). Using satellite images and a large, reliable dataset of vegetation indices (NDVI and EVI from 2011 to 2016), we sampled 120 landscapes of 1km2 within the region and tested for the effect of the percentage of croplands, density of forest edges and number of forest patches on the PP of forests, croplands and the entire landscape. Because precipitation may mediate the impact of landscape attributes on PP (Del Grosso et al., 2008), we considered the PP of rainy and dry seasons. We also examined how the landscape metrics affected the spatial variability in PP among croplands and among forest. We expected that the PP of forests, croplands and the entire landscapes decreases as the percentage of sugarcane crops, the density of forest edges and the number of forest patches in the landscapes increases. We also expected smaller spatial variation in PP (i.e. small coefficient of variation in PP) in landscapes dominated by croplands, forest edges, and highly fragmented.
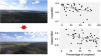
MethodsStudy regionLocated in the Paraiba coast of Northeast Brazil, the study region covers 525,556ha of the Pernambuco Endemism Center of the Brazilian Atlantic Forest (Fig. 1). The region is covered by a mosaic of different vegetation types, including tropical rainforests, less humid forests and cerrado-like vegetation, locally called ‘mata de tabuleiro’ (Silva-Junior et al., 2018). The vegetation types grow on two predominant soil classes: latosols and argillosols, and in smaller proportions on neosols and spodosols (IBGE, 2008). Climate is warm and humid tropical (Koppen, 1936), with annual precipitation of 1800mm approximately. Rainy season usually spans from March to August and dry season from September to February. The thermal amplitude is low, with maximum average temperature reaching 27.5°C among the months of January and March and minimum average temperature of 24°C in the months of June and July (Pereira et al., 2012).
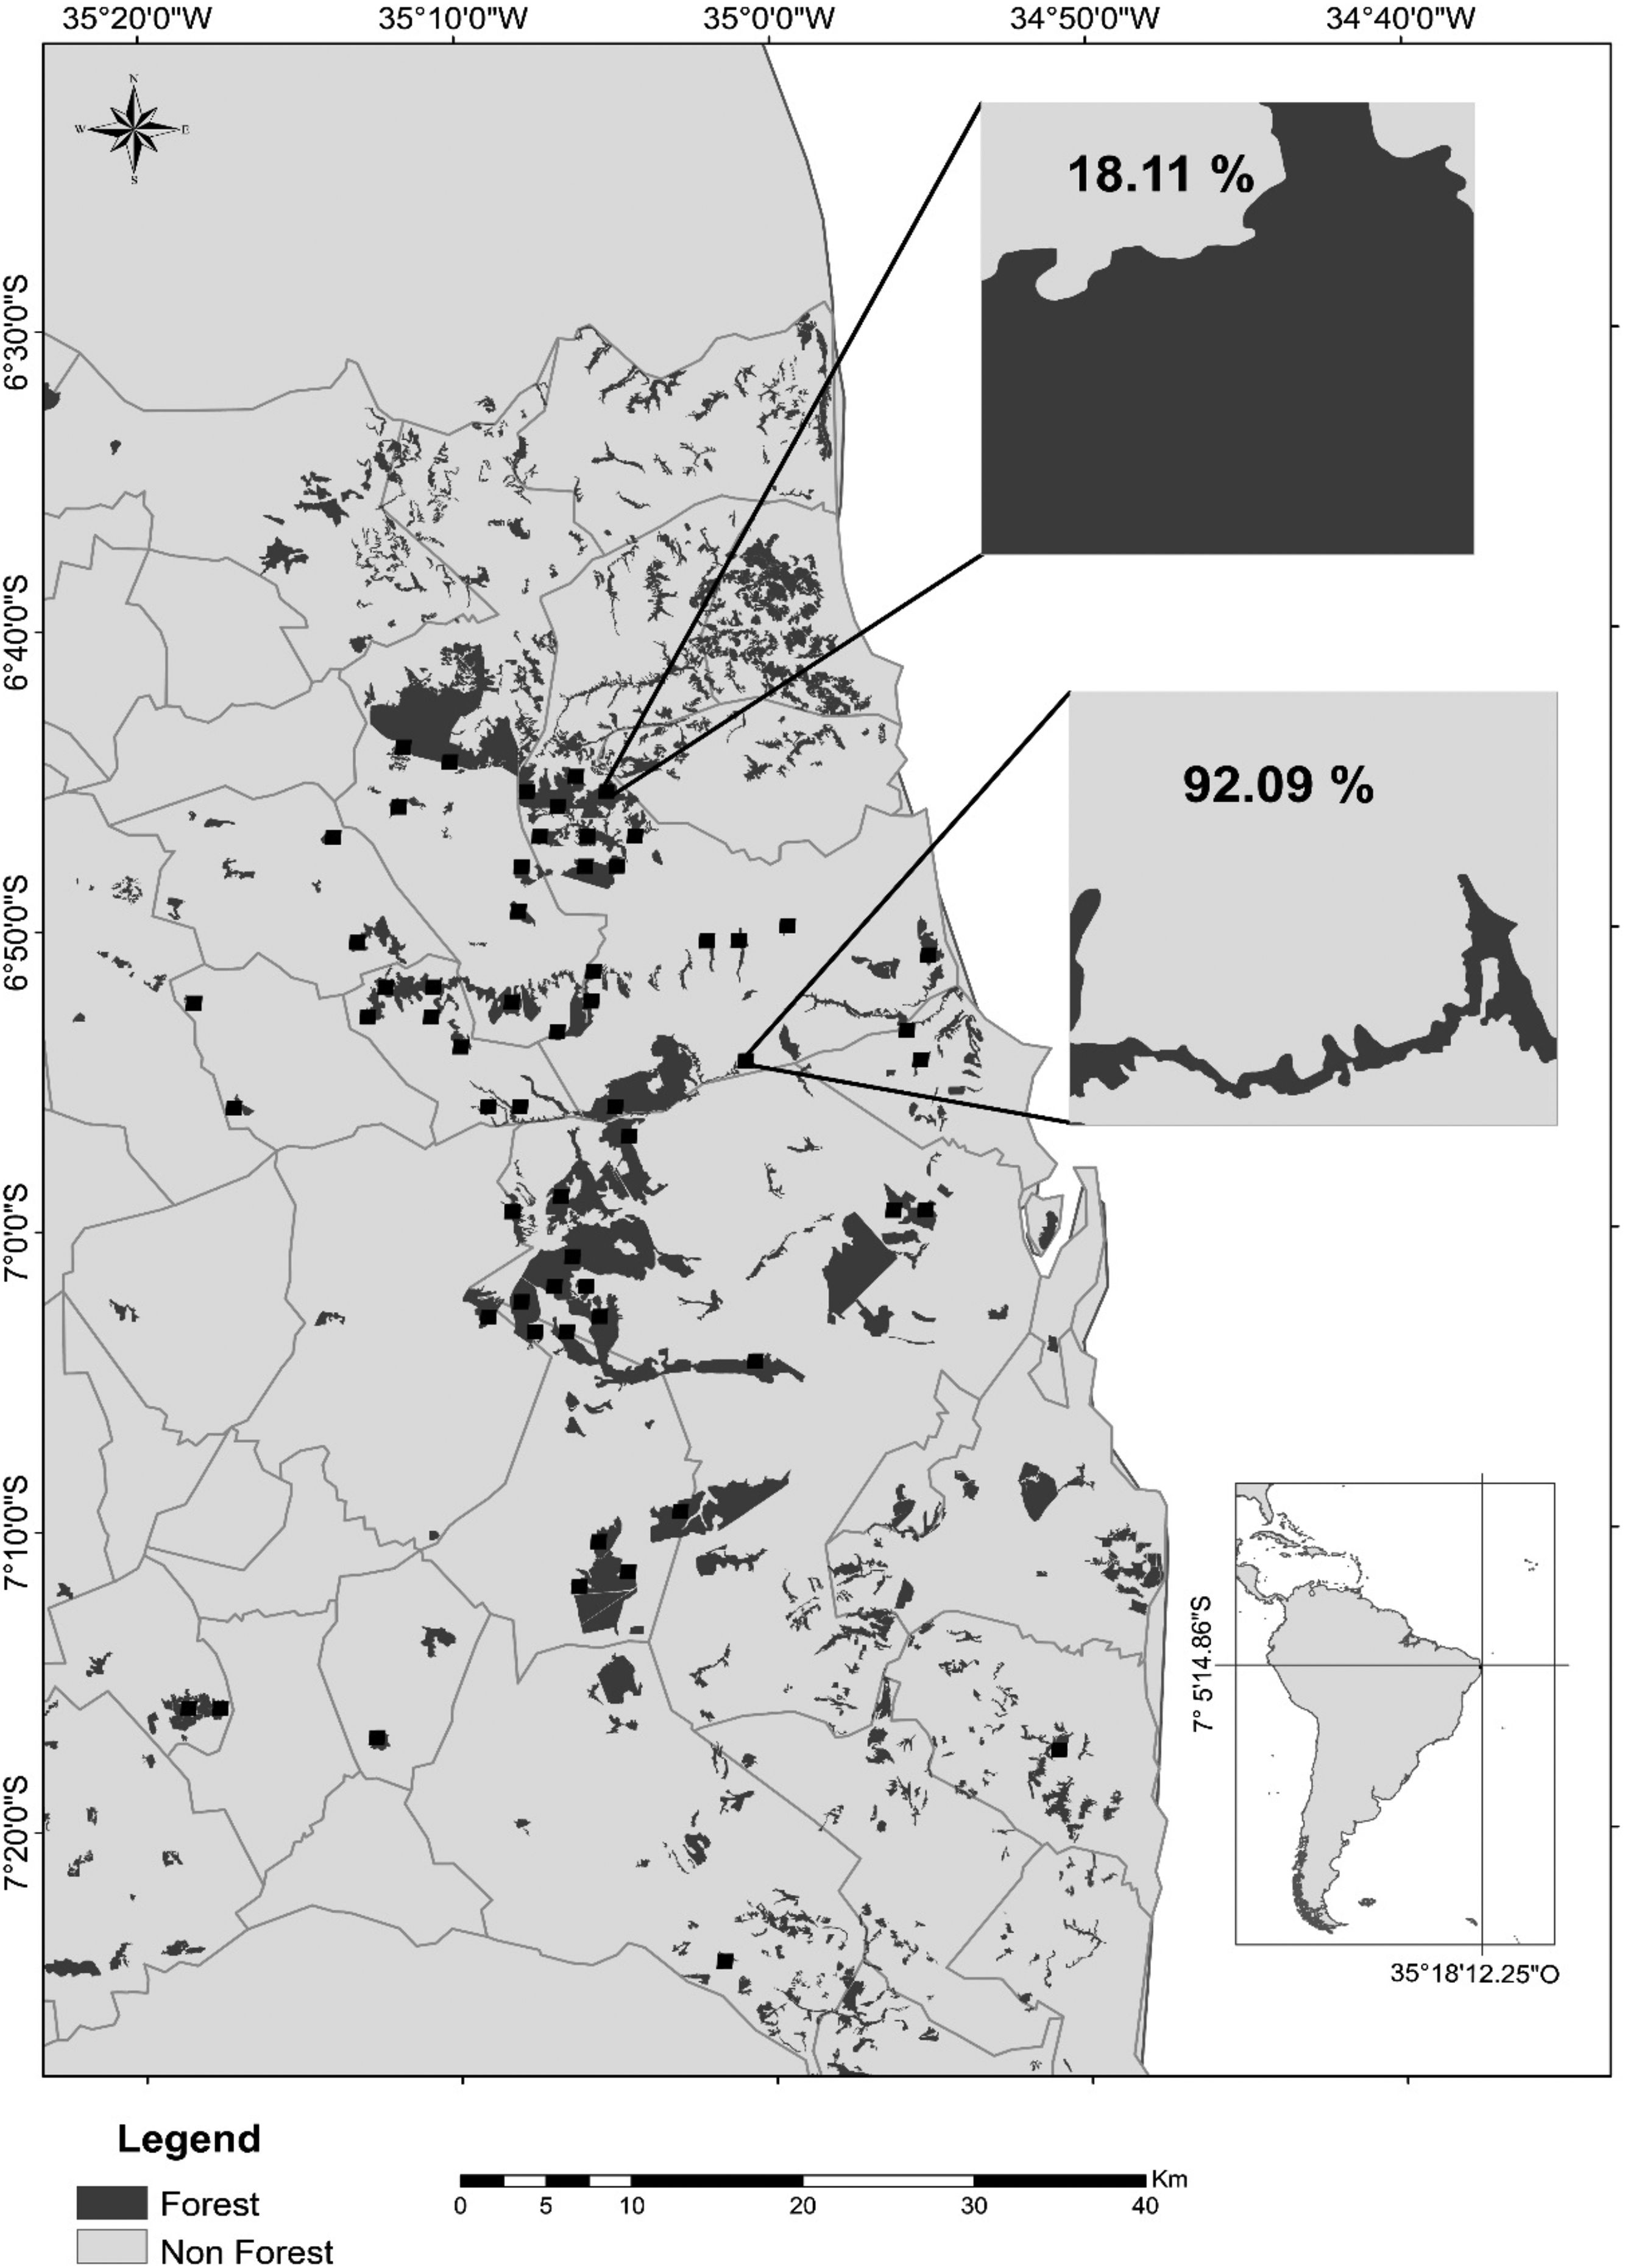
Map of the study region in the state of Paraíba, Northeast Brazil, showing the remaining Atlantic forest patches (dark gray), the agricultural crops (light gray; mostly sugarcane), and the 60 landscapes of 1km2 (black squares) sampled during the rainy seasons of 2011–2016. In detail, a forest-dominated landscape with only 18.11% of its area covered by sugarcane plantations and a cropland-dominated landscape with 92.09% of sugarcane cover. Gray lines represent municipality limits. Other 60 landscapes (not shown) were sampled during the dry seasons of the same period.
The sugarcane monocultures were established in Paraiba a couple of centuries ago (Moreira and Targino, 1997), but intensified in the 1970s owing to the National Alcohol Program (Pro-Álcool), whose main goal was to produce sugarcane at large scale to support the replacement of gasoline and other petroleum-based fuels by sugarcane-derived ethanol (Cortez, 2016). The program accelerated deforestation and forest fragmentation at alarming rates and homogenized the agricultural landscapes with vast sugarcane crops. Currently, forest patches of up to 4366ha remains, but more than 95% are less than 45ha (Stevens, 2014). This environmental liability has been underappreciated with the excuse that ethanol is a biofuel produced with environmental-friendly techniques (Cortez, 2016). However, the use of fire is still allowed in sugarcane harvest, negatively affecting the soil and native species that eventually supplement their habitat in adjoining croplands. In our study region, harvest usually begins in September and coincides with the dry season, while sugarcane growth usually takes place in the rainy season, if irrigation is not implemented.
Vegetation indicesWe used NDVI and EVI as proxies of PP. These indices are strongly correlated with various plant properties, including (1) amount of photosynthetic active radiation, (2) chlorophyll content, (3) leaf area, (4) amount of green biomass and (5) canopy structure (Huete, 2011). Together, these properties provide an important measure of the photosynthesis capacity and PP (Huete et al., 2002; Pettorelli et al., 2005). While the NDVI is related to chlorophyll content, EVI is sensitive to variation in canopy structure, which includes leaf area index, plant physiognomy and canopy architecture (Gao et al., 2000). Both indices vary from −1 to +1; values close to +1 are typical of environments with high dense vegetation, elevated photosynthetic capacity and high PP, while values close to zero indicate low vegetation cover, naked soil and small PP (Pettorelli et al., 2005). Negative values usually indicate waterbodies.
We obtained the vegetation indices from MODIS sensor (Moderate Resolution Imaging Spectroradiometer), product MOD13Q1. This product provides a fine temporal resolution through the observation of the entire Earth's surface every 1 or 2 days and vegetation indices at 16-day intervals with a spatial resolution of ∼6.25ha. The 16-day composite data minimizes the influence of atmospheric and bidirectional reflectance distribution function (Huete et al., 2002).
Tropical regions are affected by cloudy condition all year long. To account for this issue between 2000 and 2016, we first filtered residual cloud and aerosol contamination based on the quality assurance flags and the mixed cloud, possible shadow and aerosol quality flag provided by the MOD13Q1 product. Then we selected those months that had better quality data and were representative of vegetation seasonality, which were June- July for the rainy season and November-December for the dry season. In spite of using gap-filling data methods to cope with missing data, we preferred to maximize good quality data by pooling 6 years of vegetation indices (2011–2016) and averaging them for rainy-dry comparisons.
Landscape samplingTo select the landscapes and estimate their metrics of composition and configuration, we used the Atlantic Forest mapping carried out by SOS Mata Atlântica/INPE in 2014 (www.sosma.org.br and www.inpe.br). Some inaccuracies of the mapping regarding our study region were corrected through the visual interpretation of Google Earth images from 2013 and 2015 and the Vector Editing tool of Qgis software 2.14.11. We mapped forest patches greater than 6.25ha because that was the spatial resolution of the MODIS sensor (pixels were about 250m×250m, 6.25ha).
Once mapping was done, we subdivided the study region into squares (i.e. landscapes) of 16 MODIS pixels (∼1km2; 100ha), resulting in a grid of hundreds of possible landscapes to be surveyed. We selected landscapes with this area of coverage because they should be more appropriate to detect effects of vegetation breezes, but also showed results from the same analyses using 64 MODIS pixels (∼4km2; 400ha; see below). Considering that the effects of vegetation breezes are observed with better accuracy at smaller spatial scales (e.g. 2km), more extended landscapes (e.g. 10km2) could add some mesoscale processes such as vertical fluxes and confound the vegetation breeze phenomenon effects (see Avissar and Liu, 1996 for more details).
To filter out those landscapes with unconfident data, we used the following criteria: (1) at least 80% of the 16 pixels should present reliable data of vegetation index within the studied period; (2) remaining forest should be surrounded by sugarcane crops; (3) landscape should be rural, with no dense settlements or cities; and (4) landscape must be at least 1km apart from the nearest landscape to minimize spatial autocorrelation. After eliminating the landscapes that did not meet these criteria, we performed a stratified random sampling and selected 12 landscapes for each of five categories of agricultural use: 0–20%, 20–40%, 40–60%, 60–80% and 80–100% of area covered by sugarcane. This procedure ensured that the gradient of landscape composition varied from totally forested to totally cultivated landscapes, resulting in 60 independent landscapes. Because of atmospheric conditions (criterion 1 described above), it was not possible to sample the same landscapes in dry and rainy seasons. Therefore, we repeated the procedure in each season. We visited landscapes with access available to validate the information indicated by satellite images.
In each landscape, we measured the percentage of croplands – our metric of landscape composition – and two metrics of landscape configuration: density of forest edges and number of forest patches (see also Carrara et al., 2015). To estimate the density of forest edge, we corrected eventual spatial errors in our mapping and converted the file to raster format with a 5-m pixel resolution. This pixel size was chosen because it is the most suitable size to conserve the level of details of landscape and spatial resolution (Hengl, 2006). We performed the calculation of edge density with QGIS and FRAGSTATS v4 and visually counted the number of forest patches in each landscape to quantify the level of landscape fragmentation.
We repeated the same sampling procedure with landscapes of 64 pixels (∼4km2, 400ha) to ensure that the landscape size we selected was generalizable to broader spatial scales. Given that forest patches are too small in our region (see Study region above), totally forested landscapes were absent at this broader spatial scale and the gradient of cropland cover shortened a bit to 21–97%. In addition, atmospheric conditions between 2011 and 2016 forced us to work with at least 50% (not 80%) of the 64 pixels with reliable data of the vegetation indices. The number of independent landscapes to be analyzed dropped from 60 to 25. Despite this difference in sample size and data quality, the pattern observed at 400ha (Appendix S1) was very similar to that observed at 100ha (see Results below). Unfortunately, our dataset did not allow for landscape sampling at broader scales (e.g. 256 pixels).
Estimations of primary productionTo estimate the PP of the entire landscape we averaged the values of the 16 pixels that composed the landscapes. To estimate the PP of croplands and forests within each landscape, we were very conservative and selected only those pixels completely covered by the respective land use. This criterion avoided that a pixel dominated by sugarcane but with a small fraction of forest had its PP overestimated, as forests are presumed to be more productive than sugarcane crops. Similarly, it also avoided that a forest-dominated pixel with pieces of sugarcane crops had its indices underestimated. This procedure reduced the number pixels and landscapes from which the mean values of forest and cropland PP and their respective coefficient of variation (spatial CV) were calculated, but ensured confident comparisons across the gradient of landscape composition and configuration.
To assess the spatial variability in PP among croplands and among forests, we used the coefficient of variation (CV) in PP. The greater the CV, the greater the spatial variability. Landscapes with only one or no pixel of a given land use were not considered in the analysis because mean and CV require at least two pixels to be calculated. The CV of forest and croplands were calculated from 22 and 27 landscapes during the rainy season and 25 and 29 landscapes during the dry season, respectively.
Data analysesWe performed generalized linear models to test for the effect of landscape metrics on the PP of forests, croplands and the entire landscape (Crawley, 2007). All models had the percentage of croplands, density of forest edges and number of forest patches as explanatory variables. The mean value of the vegetation indices and their coefficient of variation were set as response variables. We fitted the models with Gaussian distribution after verifying that the residuals of the response variables had normal distribution, visualized through the graphic analysis of the ‘qqnorm’ and ‘qqline’ functions of R software. We generate the value of pseudo R2of models through the ‘rsq’ package of R. Using the car package of R version 3.0.1, we calculated the variance inflation factor (VIF) to estimate the multicollinearity among the predictors. VIF>4 indicates possible collinearity, whereas VIF>10 indicates high collinearity (Kutner, 2004). All VIF values were lower than 2 (ranging from 1.00 to 1.90 in rainy season and from 1.00 to 1.45 in dry season), indicating independence among the explanatory variables. In previous data exploration, we verified that soil type had no effect on PP and therefore did not include it as a covariable in the models (see Table S1 for more details). All analyzes were performed in R and JMP 8.0.
ResultsDuring the rainy season, the increase in the percentage of croplands negatively affected the mean NDVI and EVI of the entire landscape, as well as NDVI of croplands and forests (Table 1, Fig. 2). Density of forest edges and number of forest patches had no significant effect on any vegetation indices, except for the NDVI of the forest, which decreased in more fragmented landscapes (Table 1, Fig. 2).
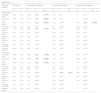
Results of generalized linear models examining the effect of the percentage of croplands, density of forest edges and number of forest patches on the mean value of the vegetation indices NDVI and EVI and their coefficient of variation during the rainy and dry seasons of 2011–2016. The estimate of model terms is shown in bold for significant relationships only (see also Figs. 2 and 3). Chi-squared and R2 values are reported. Models were based on 60 landscapes of 100ha.
| Model factors | |||||||||||
|---|---|---|---|---|---|---|---|---|---|---|---|
| Response variable | Full model | Percentage of croplands | Density of forest edges | Number of forest patches | |||||||
| χ2 | R2 | χ2 | P | est | χ2 | P | est | χ2 | P | est | |
| Rainy season | |||||||||||
| Landscape NDVI | 54.43 | 0.59 | 50.25 | <0.05 | (−0.001) | 0.05 | 0.81 | 0 | 0.9n.s. | ||
| Landscape EVI | 33.01 | 0.43 | 31.79 | <0.05 | (−0.001) | 0.42 | 0.51 | 0 | 0.97n.s. | ||
| Forest NDVI | 12.02 | 0.25 | 7.4 | <0.05 | (−0.001) | 0.02 | 0.88n.s. | 4.93 | <0.05 | (-0.243) | |
| Forest EVI | 1.62 | 0.03 | 1.58 | 0.2n.s. | 0.3 | 0.58n.s. | 0.09 | 0.76n.s. | |||
| Cropland NDVI | 11.73 | 0.22 | 8.88 | <0.05 | (−0.001) | 0.42 | 0.51n.s. | 2.36 | 0.12n.s. | ||
| Cropland EVI | 1.51 | 0.03 | 1.09 | 0.29n.s. | 0.06 | 0.79n.s | 0.26 | 0.6n.s. | |||
| Forest CV NDVI | 2.81 | 0.12 | 2.66 | 0.10n.s | 0.81 | 0.36n.s. | 0.43 | 0.51n.s. | |||
| Forest CV EVI | 2.46 | 0.10 | 1.76 | 0.18n.s. | 0.19 | 0.65n.s. | 0.57 | 0.44n.s | |||
| Cropland CV NDVI | 0.51 | 0.01 | 0.09 | 0.75n.s. | 0.01 | 0.89n.s | 0.41 | 0.52n.s. | |||
| Cropland CV EVI | 0.38 | 0.01 | 0.09 | 0.75n.s. | 0.16 | 0.68n.s. | 0.13 | 0.71n.s. | |||
| Dry season | |||||||||||
| Landscape NDVI | 80.65 | 0.73 | 79.55 | <0.05 | (−0.003) | 0.25 | 0.61n.s. | 1.93 | 0.16n.s. | ||
| Landscape EVI | 54.77 | 0.59 | 52.95 | <0.05 | (−0.002) | 0.12 | 0.72n.s | 2.64 | 0.1n.s. | ||
| Forest NDVI | 16.63 | 0.36 | 11.74 | <0.05 | (−0.001) | 2.2 | 0.13n.s. | 0.47 | 0.48n.s. | ||
| Forest EVI | 7.15 | 0.17 | 2.61 | 0.10n.s. | 3.07 | 0.07n.s. | 0 | 0.02n.s. | |||
| Cropland NDVI | 8.59 | 0.18 | 4.28 | 3.5n.s. | 3.5 | 0.06n.s. | 0.78 | 0.37n.s. | |||
| Cropland EVI | 5.75 | 0.12 | 0.06 | 0.88n.s. | 5.37 | <0.05 | (0.001) | 0.02 | 0.87n.s. | ||
| Forest CV NDVI | 5.99 | 0.21 | 1.66 | 0.19n.s. | 3.2 | 0.07n.s. | 0.01 | 0.95n.s. | |||
| Forest CV EVI | 5.26 | 0.18 | 1.15 | 0.28n.s. | 2.95 | 0.08n.s. | 0.16 | 0.68n.s. | |||
| Cropland CV NDVI | 1.37 | 0.04 | 1.31 | 0.25n.s. | 0.16 | 0.68n.s. | 0 | 0.97n.s. | |||
| Cropland CV EVI | 0.75 | 0.02 | 0.47 | 0.49n.s. | 0.57 | 0.44n.s. | 0.1 | 0.74n.s. | |||
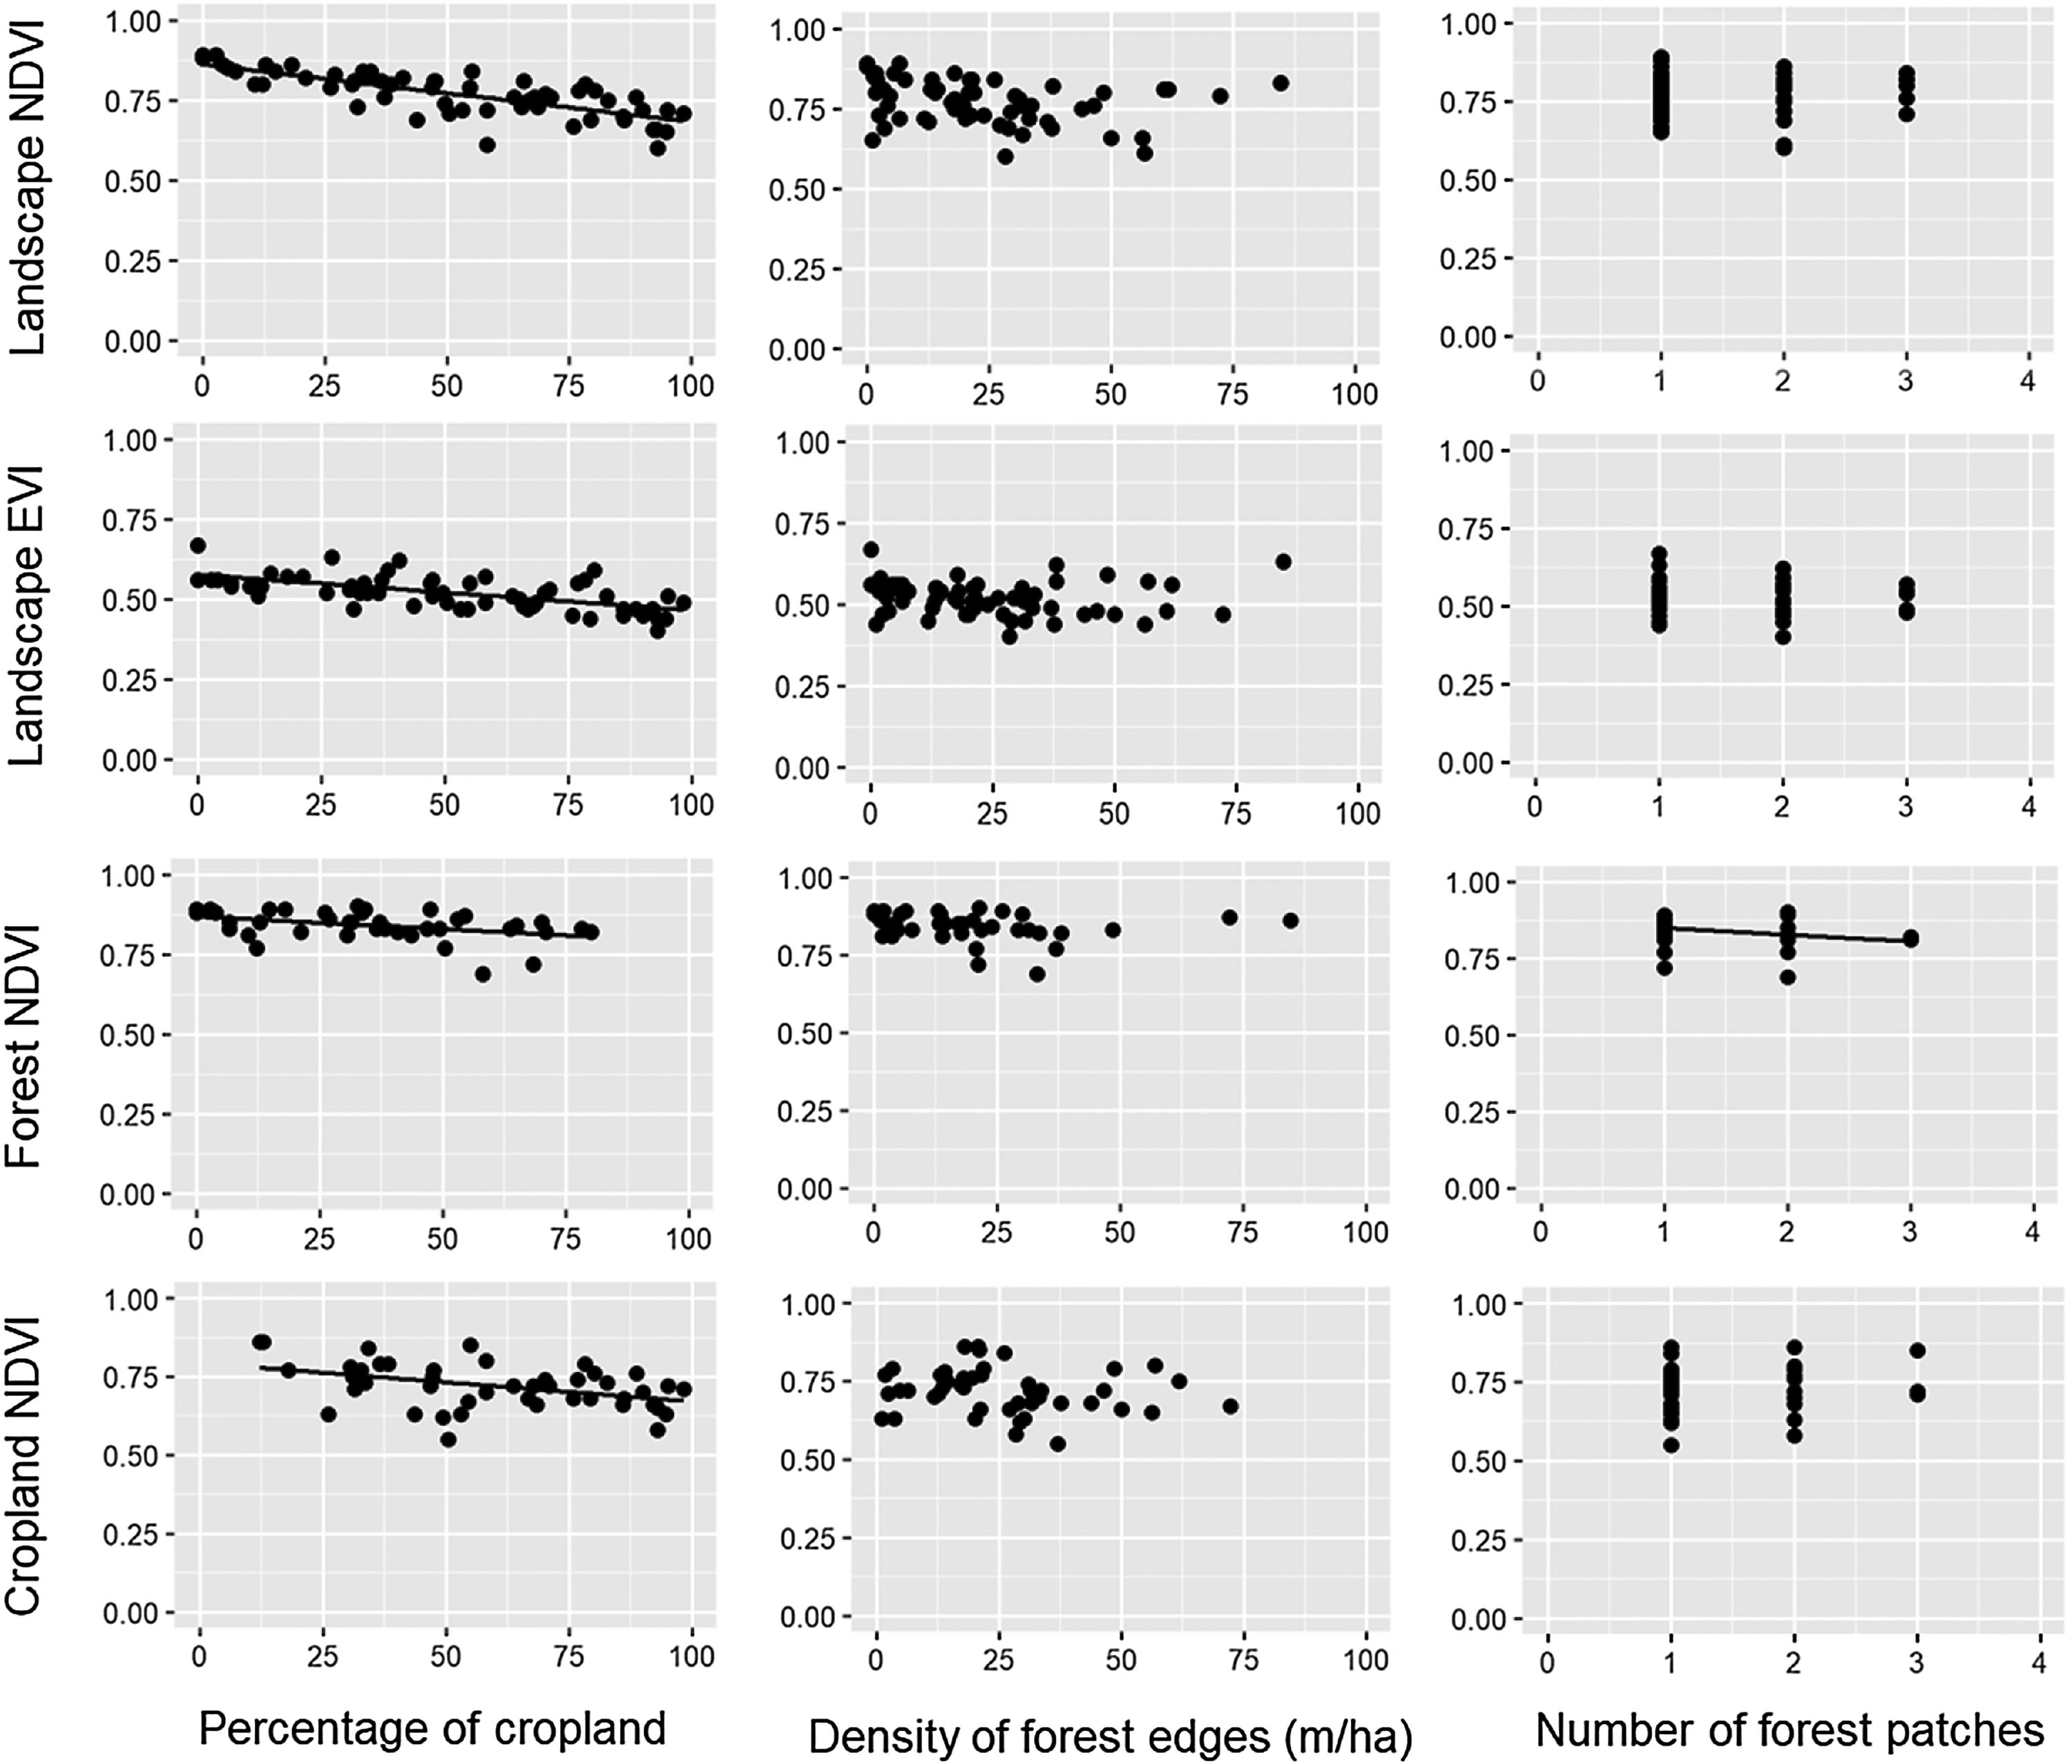
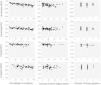
Relationships between the percentage of croplands, density of forest edges, number of forest patches and the mean value of the vegetation indices (NDVI and EVI) of croplands, forests and the entire landscape during the rainy seasons of 2011–2016. Statistical significance of the relationships is shown in Table 1. The significant relationships are represented by a fitted line in the plots.
During the dry season, the pattern remained quite similar, i.e. the increase in the percentage of croplands negatively affected the mean NDVI and EVI of the entire landscape and the mean NDVI of the forest (Table 1, Fig. 3). However, the percentage of croplands did not affect the NDVI and EVI of croplands. In addition, during this season we also observed that the mean EVI of croplands increased with the increase in forest edge density, suggesting that landscapes with more forest edges favor sugarcane production.
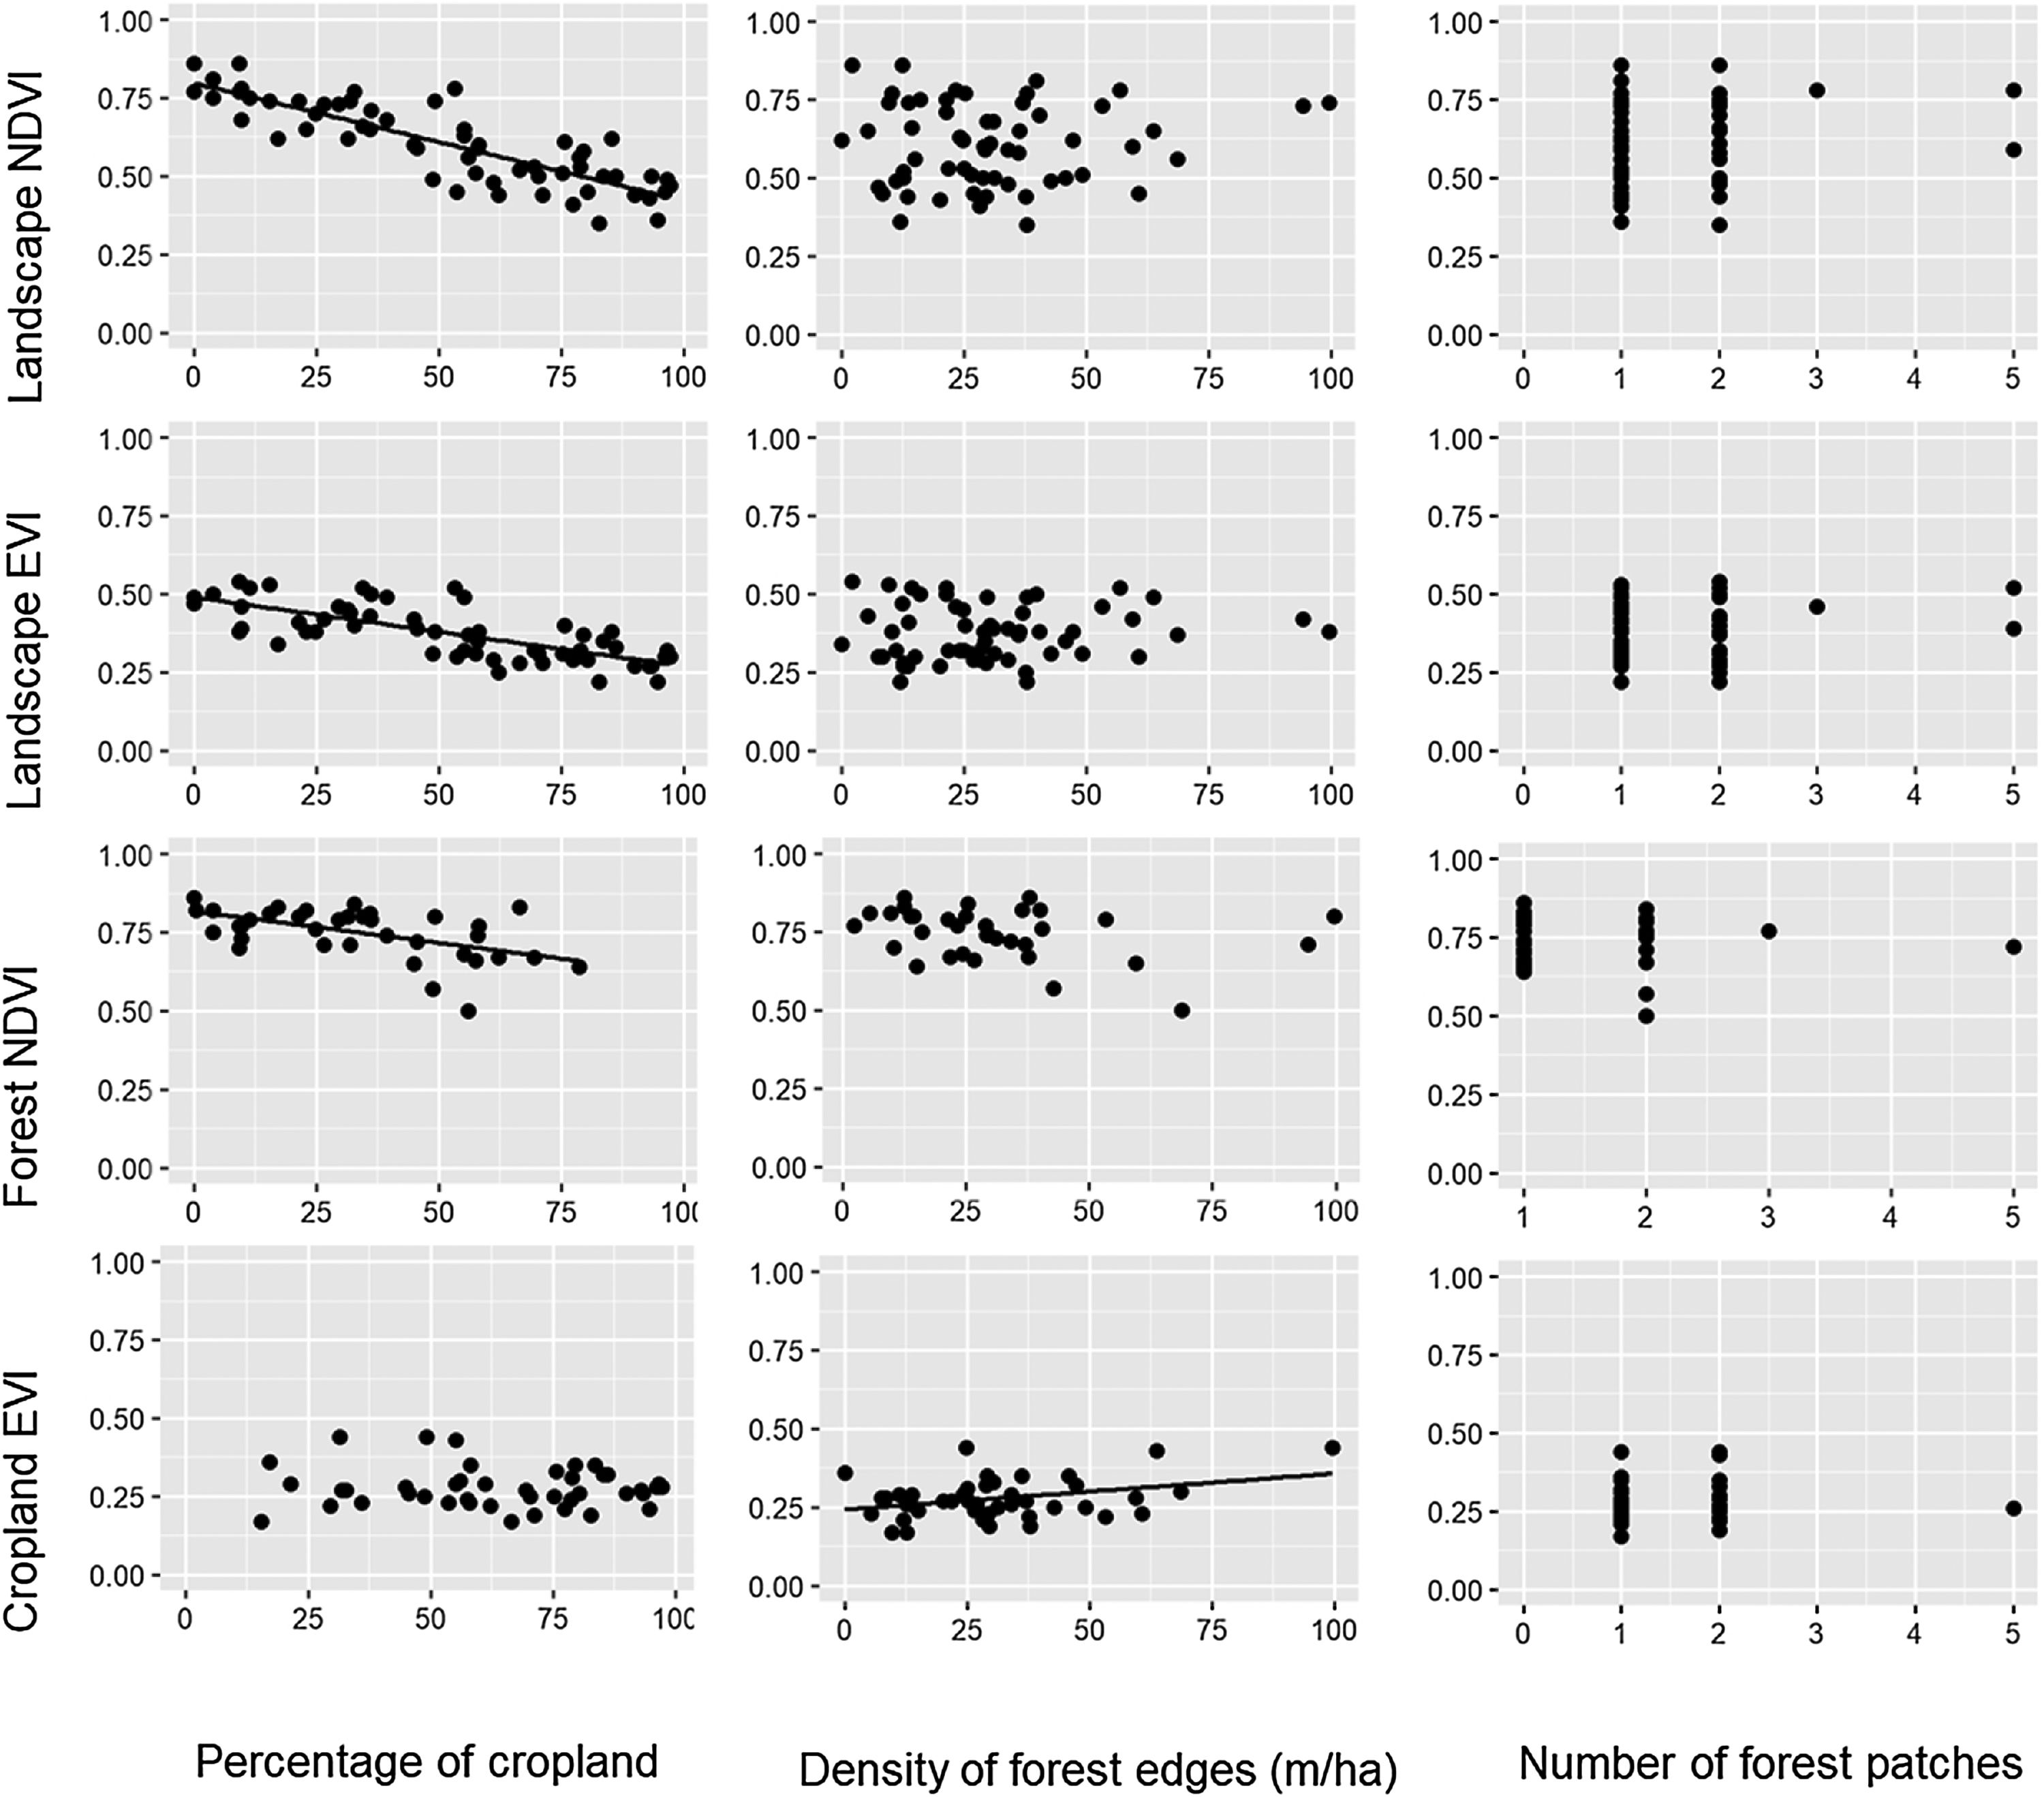
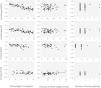
Relationships between the percentage of croplands, density of forest edges, number of forest patches and the mean value of the vegetation indices (NDVI and EVI) of croplands, forests and the entire landscape during the dry seasons of 2011–2016. Statistical significance of the relationships is shown in Table 1. The significant relationships are represented by a fitted line in the plots.
Landscape metrics did not significantly affect the spatial variability in PP of croplands and forest at any season (Table 1). During the rainy season, the coefficient of variation (CV) varied from 0.5 to 19.1% for forest NDVI, 1.6–23.0% for forest EVI, 1.7 to 30.1% for cropland NDVI, and 2.4 to 39.1% for cropland EVI. During the dry season, a similar range of CV values was observed for the four indices: 0.9–32.5%, 1.9–28.3%, 9.1–49.3%, and 5.7–36.7%, respectively. However, none varied significantly with the percentage of croplands, density of forest edges and number of forest patches in the landscape (Table 1).
DiscussionOur results suggest that landscape composition is more important than spatial configuration in determining the PP of agricultural landscapes embedded in an old frontier of sugarcane plantation. As expected, NDVI and EVI of the entire landscape were negatively influenced by the percentage of croplands in both seasons. Furthermore, the increase in landscape fragmentation negatively affected forest NDVI, indicating that splitting the forest into many remnants is not beneficial to forest PP. When we analyzed the NDVI of croplands and forest separately, we also observed that both land uses responded more to landscape composition, even though the EVI of croplands had a positive relationship with density of forest edges during the dry season. Surprisingly, neither landscape composition nor configuration affected the spatial variability of cropland and forest PP. These findings not only support the notion that landscape attributes mediate ecosystem functions and services (Nascimento and Laurance, 2004; Magnago et al., 2017; Melito et al., 2017), but also point out that we should conserve the most forest area that we can in agricultural landscapes because croplands and forests themselves benefit from this environmental-friendly scenario.
Despite the scarcity of landscape-level studies in the Brazilian Atlantic Forest (Matos et al., 2017; Melito et al., 2017; Santo-Silva et al., 2018), there is plenty of evidence demonstrating that agricultural expansion has led to large-scale floristic simplification and biotic homogenization (Lôbo et al., 2011; Tabarelli et al., 2012). This is possibly a consequence of the re-arrangement of tree communities following biomass collapse and other edge-related changes (Tabarelli et al., 2008), in which pioneer, softwood trees dominate the landscapes at the expense of the hardwood, old-growth flora (Oliveira et al., 2008; Tabarelli et al., 2010). In Northeast Brazil, disturbance-adapted tree species represent more than 80% of the floristic composition (Tabarelli et al., 2010). The spread of these trees is paralleled by a persistent impoverishment of the large-tree stand, including the structural collapse of forest emergent layer (Oliveira et al., 2008). The growth rate of fast-growing pioneer trees is greater than late-successional shade-tolerant trees, but their shorter life cycle largely limits long-lasting biomass accumulation (Santos et al., 2012; Brienen et al., 2015). Altogether, the floristic and structural shifts in forest structure may explain why forest PP is smaller in cropland-dominated than forest-dominated landscapes.
The reduction in forest PP during the rainy season also took place in face of increased landscape fragmentation. Previous researches demonstrate that landscapes with a long history of disturbance exhibit disruptions in key ecological interactions such as pollination and seed dispersal (Lopes et al., 2009; Peres et al., 2016). Most late-successional tropical trees are highly dependent on large vertebrates or specialized insects for seed dispersal and pollination, which in turn influence their demography, define their rates of reproduction and immigration, and ultimately their contribution to forest biomass and PP (Lopes et al., 2009; Peres et al., 2016). In this regard, the increase in forest fragmentation may have reduced seed output due to pollination failure and prevented the seeds to arrive at safe sites and establish as new trees (Costa et al., 2012).
It has been observed that low diversity in tropical forests reduces carbon storage (Poorter et al., 2015). In our study region, most forest patches are smaller than 45ha and are kilometers apart from each other, exacerbating dispersal failures of late-successional species typical of more productive forests. During the dry season, these species reduce their chlorophyll content and photosynthetic activity due to water shortage (Malhi et al., 1998; Phillips et al., 2009), reducing the PP anywhere in the region and hindering the effect of landscape fragmentation on forest PP in this season.
A promising result from our analyses was the increased cropland PP in forest-dominated landscapes, demonstrating a potential synergy between sugarcane production and forest conservation. Although not novel in the literature (Garibaldi et al., 2013; Kennedy et al., 2013; Zhang et al., 2007), this synergy had not been yet described for large-scale sugarcane plantations in the Brazilian Atlantic Forest. The main evidence arose from the cropland NDVI during the rainy season, which increased in more forested landscapes. The mechanism underlying this potential synergy is the vegetation breeze (Cochrane and Laurance, 2008; Pinto et al., 2010), as the more forest in the landscape, the greater the capacity of storing water from the rainfall and ameliorating atmospheric conditions in adjoining croplands. However, during the dry season, rainfall diminishes and sugarcane fields need to be irrigated to maintain high sucrose yields (Inman-Bamber and Smith, 2005; Carr and Knox, 2011; Abreu et al., 2013). This artificial supply of water into the system possibly replaces the vegetation-breeze service and maintains sugarcane production during this season (Silva et al., 2007).
However, some croplands keep being positively affected by the forest during the dry season, but uniquely in landscapes with greater forest edge density. This metric of landscape configuration does not vary linearly with the amount of forest in the landscape, reaching its maximum in landscapes with intermediate amount of habitat and minimum at 0% or 100% of forest cover (Fahrig, 2003). In landscapes with intermediate forest cover, more irregular forest patches also contribute to increment the density of forest edges. This is the case of most of the forest patches in our region (Ranta et al., 1998), which are very irregular in shape and somehow may supplement the benefits provided by the irrigation during the dry season (Laurance et al., 2007; Cochrane and Laurance, 2008); this could possibly explain the positive relationship between cropland EVI and density of forest edges. The mechanism behind this supplementation is uncertain yet, given that the vegetation breeze is unlikely to take place in the dry season, thus further studies are needed to elucidate this phenomenon. Importantly, our finding does not imply that creating forest edges will increase cropland PP, because under field conditions there is no way to create forest edges without losing forest cover and changing landscape composition (Fahrig, 2003).
Finally, we expected that the spatial variability of NDVI and EVI would decrease in landscapes with greater proportion of croplands, since forest loss leads to floristic homogenization (Lôbo et al., 2011) and production of sugarcane production is leveled at the top anywhere in the region (Vieira et al., 2012). However, the coefficient of variation in NDVI and EVI of croplands and forest did not vary with any metric of landscape composition and configuration in both seasons. This suggests that the photosynthetic activity of forests is as spatially variable in cropland-dominated landscapes as it is in more forested landscapes. The same rationale seems to apply to sugarcane crops, resulting in high spatial variability of PP regardless landscape modification.
Caveats on interpretation and future researchContrasting patterns have been observed on tropical forest greenness using remote spectral information (Huete et al., 2006; Morton et al., 2014). Although this technology still needs to go through evaluation and refinement (Dong et al., 2017) it is a readily confident tool to have a first insight on ecosystem functioning, especially in the Atlantic Forest of Northeast Brazil where no pattern of PP has been described at the landscape or regional levels. While future research should seek to adjust PP estimations at these spatial scales, our results helps to delineate a possible path that is logistically possible and could reduce uncertainties on remote sensing application for PP estimations. Sugarcane PP using biomass harvest methods are possible to carry out and should consider the spatial distribution of forest patches in order to evaluate the patterns observed in this work and, at the same time, contribute to adjust PP modeling derived from vegetation indices.
Consistent with other studies on landscape structure (Carrara et al., 2015; Arroyo-Rodríguez et al., 2016; Alvarado et al., 2018), our findings indicate that landscape composition is more important than landscape configuration in shaping the PP. In practical terms, we should conserve large portions of forest in agricultural landscapes to have positive effects on cropland production. Unfortunately, we were unable to measure crop yield in situ to estimate how much forest is needed to achieve maximum yield at the 1-km2 scale. Moreover, other factors such as irrigation, crop-tree competition, agricultural techniques and forest uses may affect the PP at the forest-cropland frontier. Trees at the forest edge may shadow the abutting cropland, reducing sugarcane photosynthetic activity in forest-dominated landscapes. Irrigation during the dry months may increase the sugarcane productivity in highly deforested landscapes, as own our data suggest. Soil fertilization, planting, and harvesting techniques may also affect positively or negatively cropland PP, while previous selective logging and current firewood extraction may reduce forest PP. Despite these potential confounding factors, we have enough information to recommend that sugarcane production in the region should (1) avoid deforestation, (2) restore forests in cropland-dominated landscapes to increase forest cover, (3) protect the remaining forest from fire during sugarcane harvesting, and (4) avoid fragmentation of the remaining forest.
Finally, our results also suggest that landscape-level analyses are needed to accurately assess the impact of agricultural expansion on ecosystem functions and services (Carrara et al., 2015; Cong et al., 2016). Further studies should go deeper and better explore the synergy between sugarcane production and forest conservation, involving scientists, decision-makers and practitioners. Landowners should also be part of such initiatives and share data on crop yields. Other commodities, such as oil palm and soy, have increasingly replaced large areas of tropical forests worldwide, with little concern with biodiversity loss and ecosystem degradation (Johnson et al., 2014; Laurance et al., 2014; Haddad et al., 2015). Whether these new agricultural frontiers will impair similar shifts in natural ecosystems remain to be known. We encourage the replication of our study in other agricultural frontiers to assess the generality of the landscape patterns described here.
This work was supported by the Coordenação de Aperfeiçoamento Pessoal de Nível Superior (Capes) (grant number 88881.067975/2014-01 to MGL) and the Conselho Nacional de Desenvolvimento Tecnológico (CNPq) (grant number 310340/2016-0 to BAS and 132065/2016-9 to JSBS). We are grateful to Kyle Roberto, José Alencar, Erik Melo and Juan Piñeiro for essential assistance in data management. Marcelo Tabarelli, Fredy Alvarado and two anonymous reviewers provided helpful comments on previous versions of the manuscript.
The following are the supplementary data to this article: