


Environmental DNA (eDNA) metabarcoding is a relatively new technology allowing effective non-invasive analyses and monitoring of biodiversity patterns. Studies on eDNA metabarcoding focus on using sequence data to delimit basic units (i.e., such as Molecular Operational Taxonomic Units – MOTUS – or Amplicon Sequence Variation – ASVs), and after this definition standard analytical approaches from community ecology are applied. However, there is more information inherent to eDNA data and it is now straightforward to use more general approaches in which analyses are based directly on phylogenies or genetic distances between MOTUs or ASVs, rather than in discrete units without any accounting for hierarchical structure, providing a more continuum understanding of biodiversity patterns. Here we briefly review the concepts and methods to incorporate phylogenetic patterns into eDNA metabarcoding analyses, illustrating some of the main issues with eukaryote diversity data along the Araguaia River Basin. Hopefully this perspective stimulates researchers obtaining eDNA metabarcoding data to perform their data under the community phylogenetics framework instead of (or in addition to) the more standard community ecology approach.
The increasing threats to different components of biodiversity require the continuous development of new techniques and approaches to readily monitor changes in population, community, and ecosystem properties, exerting minimum impact on these systems. One of these new non-invasive possibilities is to extract and analyse DNA molecules directly from the environment, including water, soil, and air (Bohmann et al., 2014; Bálint et al., 2018; Deiner et al., 2021; Beng and Corlett, 2020; Yang et al., 2021). The development of eDNA (environmental DNA) technology was a consequence of the cost-effective possibilities to extract, amplify, and process molecules directly from the environment. After that, multiple sequencing and bioinformatic methods can be used to extract relevant biological information from these data, including developing species-specific markers for monitoring populations and species (single species identification by barcoding), overall analyses of the diversity patterns focusing on assemblages (i.e., metabarcoding) or targeting particular functional aspects of genomes (metagenomics, using shotgun methodologies) (see Taberlet et al., 2012, 2018; Pawlowski et al., 2020; Stephan et al., 2022). These approaches are now applied worldwide in biodiversity analyses at distinct hierarchical levels and provide consistent and robust results when compared to traditional methods to obtain data directly from organisms, allowing non-invasive sampling and the ability to detect species and estimate genetic parameters where direct collections of organisms are impractical or inviable (Barnes and Turner, 2016; Keck et al., 2022; Hartig et al., 2024). However, it is important to be able to process the DNA sequences and use more integrative approaches to make better use of the data.
Most of the theoretical ideas in population and community ecology are based on the temporal and spatial variation of discrete units at distinct hierarchical levels, such as species (Taberlet et al., 2018). Thus, since the early studies using eDNA metabarcoding to characterize biodiversity patterns, there has been a trend towards using genetic similarity to delimit units (i.e., species), involving much debate about concepts and methods (Callahan et al., 2017; Glassman and Martiny, 2018; see Box 1). The common approach is to extract DNA from the environment and compare sequences obtained from the amplification of a pair of universal primers, establishing a level of similarity up to which sequences are considered to belong to the same Molecular Operational Taxonomic Units (MOTUs). More sophisticated new approaches to define biologically-sounding units are based on Amplicon Sequence Variants (ASVs). MOTUs or ASVs can be loosely associated with “species” (the “de novo” strategy) or comparing the sequences with databanks to provide the taxonomic classification (the “closed-reference” methods; see Macher et al., 2017; Callahan et al., 2017; Chiarello et al., 2022) (Box 1).
Of course, if DNA is extracted from an individual organism (i.e., genomic DNA, following the terminology of Pawlowski et al., 2020), then species identification is straightforward and the idea would be to develop specific barcoding for further monitoring, for instance, an invasive or endangered species using eDNA (e.g., Schenk et al., 2019; Lavrinienko et al., 2021). When using eDNA metabarcoding, on the other hand, the idea is to get DNA from the environment to evaluate general biodiversity patterns, for instance comparing different regions along environmental gradients (natural or human-induced). With a few recent exceptions (e.g., Rozanski et al., 2022; Fernández et al., 2021; Naro-Maciel et al., 2022; Reid et al., 2022; see also Hartig et al., 2024), such studies use the sequence data to delimit basic units as ASVs and MOTUs, so eDNA metabarcoding can be viewed, in principle, mainly as a more sophisticated and non-invasive tool to obtain data and test predictions derived from theories and models using well-known methods from community ecology, including multiple methods to account for abundance data when estimating richness (i.e., rarefaction), as well as clustering, ordination and spatial analyses (e.g., Li et al., 2018; Sales et al., 2021; Sildever et al., 2021; West et al., 2021; Rozanski et al., 2022).
However, since early 2000s (i.e., Webb et al., 2002; see Tucker et al., 2017 and Davies, 2021 for reviews) researchers have developed alternative statistical methods to incorporate historical patterns and phylogenies to better understand community patterns and assembling processes. Nevertheless, applying these methods required coupling community ecology data on richness and abundance with data coming from distinct research fields, such as molecular genetics and systematics. Thus, despite most studies in eDNA metarcoding are still focused on classical community ecology data analyses, it is currently straightforward to use sequence data not only to establish a criterion to delineate species or roughly analogous discrete biological units, but also to provide a more continuum understanding of biodiversity patterns, which also allows establishing more comprehensive conservation strategies (e.g., Diniz-Filho et al., 2013; Tucker et al., 2019; Box 1, Fig. 1). Data inherent to eDNA metabarcoding allow the use of more informative approaches in which all analyses are based directly on phylogenies or genetic distances, without the limitation of using only the taxonomically classified ASVs or MOTUs. Thus, our goal here is to discuss more general approaches to deal with eDNA data for the analyses and monitoring of broad-scale biodiversity measures, briefly reviewing the concepts and methods to incorporate phylogenetic and functional information into analyses. We illustrate some of these issues using microeukaryotes eDNA from across the Araguaia River basin (see Machado et al., 2019).
, in which individuals as tips of a phylogeny are related at different hierarchical levels, from individual and kin relationships (individual variation) up to broad-scale lineage divergence in deep time. For instance, species with distinct times from their most recent common ancestor (filled black circles) and lower-level population genetic structure within some of them (filled grey circles) are shown. In practice, using molecular data, such as eDNA metabarcoding approach, requires filtering and denoising using several strategies to avoid sequencing errors, which are assumed to affect more consistently the evaluation of divergence at lower level hierarchical levels, such as individuals or local populations, and definition of basic units that are used as the tips of the phylogenies (such as Molecular Operational Taxonomic Units – MOTUs – at a given critical level of genetic similarity represented by the vertical dashed line, and averaging distance for species delimitation. Amplicon Sequence Variants (ASVs) tend to better delimit different species and populations at multiple levels closer to the biologically meaningful units in each lineage by minimizing sequencing errors at lower hierarchical levels. In practive, ASVs would appear as a “oscillatory” line crossing the phylogeny within the grey region, better tracking species and populations depending on the resolution of sequence data used.")
A conceptual view of the continuity of life framework (see Box 1), in which individuals as tips of a phylogeny are related at different hierarchical levels, from individual and kin relationships (individual variation) up to broad-scale lineage divergence in deep time. For instance, species with distinct times from their most recent common ancestor (filled black circles) and lower-level population genetic structure within some of them (filled grey circles) are shown. In practice, using molecular data, such as eDNA metabarcoding approach, requires filtering and denoising using several strategies to avoid sequencing errors, which are assumed to affect more consistently the evaluation of divergence at lower level hierarchical levels, such as individuals or local populations, and definition of basic units that are used as the tips of the phylogenies (such as Molecular Operational Taxonomic Units – MOTUs – at a given critical level of genetic similarity represented by the vertical dashed line, and averaging distance for species delimitation. Amplicon Sequence Variants (ASVs) tend to better delimit different species and populations at multiple levels closer to the biologically meaningful units in each lineage by minimizing sequencing errors at lower hierarchical levels. In practive, ASVs would appear as a “oscillatory” line crossing the phylogeny within the grey region, better tracking species and populations depending on the resolution of sequence data used.
Calculating distances or similarities among ASVs or MOTUs is now straightforward, and there are many methods and analytical pipelines to do this in eDNA metabarcoding (e.g., Macé et al., 2022). Here we focus on how to analyse genetic similarity in a more continuous way, aiming to provide a general discussion on how diversity can be estimated using the entire information in data and what are the biological advantages of using this approach (e.g., Cavender-Bares et al., 2009; Cadotte et al., 2010; Pavoine and Ricotta, 2014; Davies, 2021). In theory, the methods briefly discussed below could be based directly on comparing single DNA sequences. However, due to the huge number of individual sequences generated in a survey, in practice, these MOTUs and ASVs are necessary to filter the raw data and are commonly used as the tips of a phylogeny (even though these tips may represent distinct levels of the biological hierarchy depending on the sequences used; Fig. 1).
Different technologies can be used to sequence the DNA extracted from environmental samples. Sequencing errors might happen in all those sequencing platforms, which could lead to a bias on the identification of MOTUs or ASVs and mainly the definition of lower hierarchical levels (i.e., individuals and populations), even though nowadays the most recent sequencing technologies are increasing their power to eliminate such errors. The success of sequencing and the quality of reads of NSG may also be affected by several other factors related to the complex interactions between extraorganismal genetic material and its environment (Barnes and Turner, 2016; Yang et al., 2021). Thus, while analysing the data generated, one should always be aware of these problems and follow a pipeline that can eliminate or minimize such sequencing errors by filtering low-quality bases and low-quality reads, keeping only those with higher quality. Another important step in bioinformatic pipelines is cluster-only reads that have sequencing depth greater than 10x, which will give a better reliability of the data generated.
Considering the continuity of life (Box 1), there are clear advantages in using phylogenetic metrics and “de novo” approaches to analyse eDNA metabarcoding data, rather than focusing on counting MOTUs or ASVs only. These assignments may be a problem for megadiverse and poorly known regions where the development of specific barcoding data is still incipient and plagued by more general taxonomic issues with many undescribed or unrecognized species (on the other hand, in this case, eDNA provides an important tool to mitigate the Linnean shortfall; see Hortal et al., 2015; Freeman and Pennell, 2021). Moreover, several studies have used intraspecific polymorphisms based on metabarcoding approaches to access, for instance, populational-level variation and even abundance patterns (Parsons et al., 2018; Adams et al., 2019; Sigsgaard et al., 2020; Andres et al., 2023). Andres et al. (2023) pointed out the importance of distinguishing sequencing errors from haplotypes or alleles of a species, and as these errors can arise from different steps throughout the metabarcoding protocols, it is necessary to have accurate methods starting from extracting DNA to bioinformatics analyses to minimize the erroneous sequences. At the same time, distinguishing errors in the sequencing process and individual or population-level variation may be even more difficult considering the lack of more comprehensive data on intraspecific genetic variation (e.g., Čandek and Kuntner, 2015; Phillips et al., 2022). These are some of the challenges for the use eDNA metabarcoding, and they all may lead to inflated counting of ASVs or MOTUS. However, as these effects generate variation at low taxonomic scales, metrics based on pairwise distances or phylogenies obtained from the eDNA will be much more robust, as shown below.
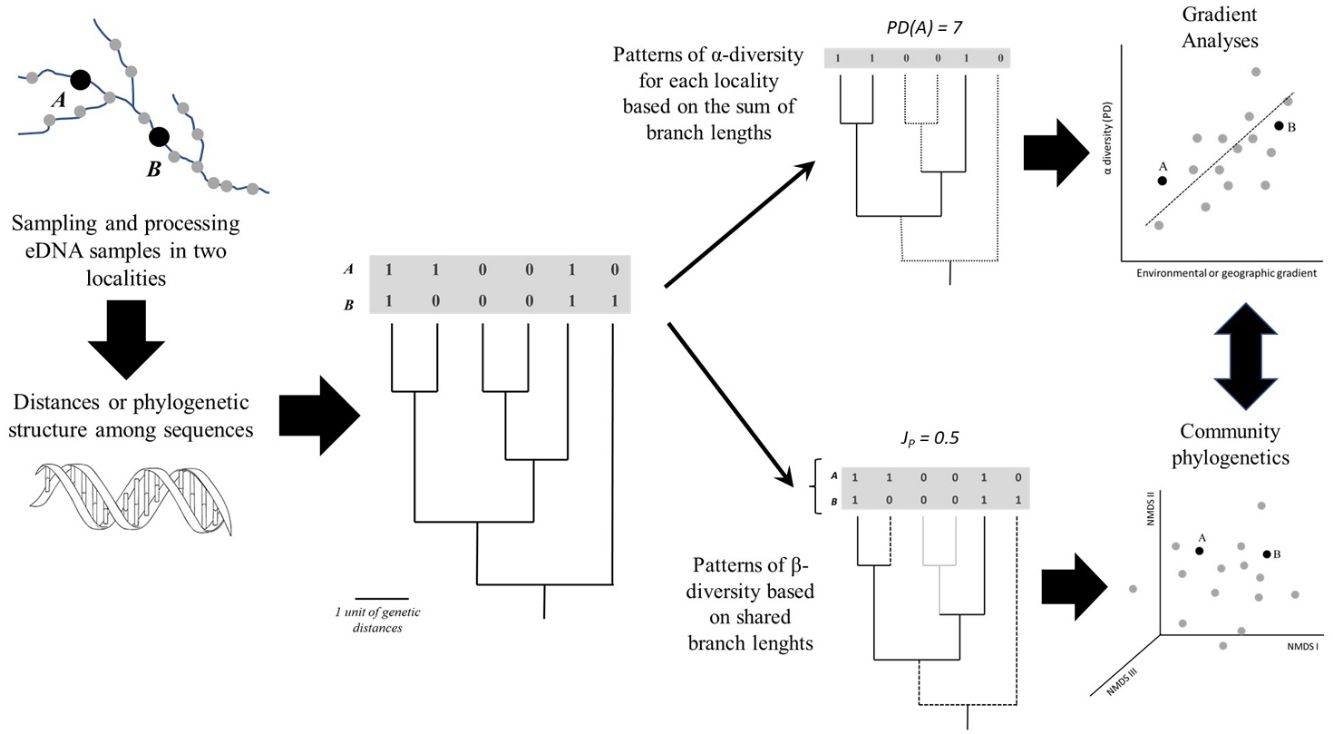
The straightforward approach to obtain more continuous diversity measures is to calculate distances or similarities among eDNA sequences. These distances are the basis for a cut-off of 3% that can be used to “a posteriori” define MOTUs, for instance. However, it is also straightforward to use the sequences directly to build a phylogeny using maximum likelihood or Bayesian methods (Nei and Kulmar, 2000; Felsenstein, 2003) with these same data. To understand how the methodological approaches based on phylogenies or genetic distance matrices can be applied it is helpful to consider samples taken from different localities along an environmental gradient (Fig. 2), evaluating the diversity in each sample (α-diversity) and the differences between samples (β-diversity).
 can be analysed based on eDNA after defining a phylogeny based on Molecular Operational Taxonomic Units (MOTUs) or Amplicon Sequence Variants (ASVs), including gradient and multivariate (ordination) analyses. A and B represent sampling sites; PD and JP stand for Phylogenetic Diversity and Jaccard similarity between localities, respectively.")
General scheme showing how α- and β-diversity patterns along geographic space (a river basin, for instance) can be analysed based on eDNA after defining a phylogeny based on Molecular Operational Taxonomic Units (MOTUs) or Amplicon Sequence Variants (ASVs), including gradient and multivariate (ordination) analyses. A and B represent sampling sites; PD and JP stand for Phylogenetic Diversity and Jaccard similarity between localities, respectively.
A simple approach to calculate diversity in a given locality (α-diversity) is to sum the branch lengths of the phylogeny, a metric called Phylogenetic Diversity (PD). Higher PD values indicate concentration of deep lineages and long branches, revealing the amount of accumulated evolutionary history in the locality. It is also possible to use the phylogeny to calculate the phylogenetic β-diversity (i.e., phylobeta diversity) by summing the shared branch lengths among assemblages (e.g., Graham and Fine, 2008). Compared to standard approaches based on species, the phylogenetic β-diversity will be lower than β-diversity if the species shared between the two localities are closely related in the phylogeny.
These estimates of α- and β-diversity are dependent on the number of MOTUs or ASVs, as PD is calculated by the sum of branch lengths (so the higher the number of MOTUs or ASVs, the faster PD accumulates). It is then common to use metrics based on mean distances among the sequences that are independent of richness, such as the Mean Pairwise Distance (MPD). MPD can be derived from the phylogenies using patristic distances connecting the sequences or obtained directly from the distances among them (i.e., without building a phylogeny in advance). Moreover, MPD values are frequently compared with a null model in which assemblage composition is generated by randomly sampling from the entire species pool (Webb et al., 2002; Swenson et al., 2006). In this case, the Net Relatedness Index (NRI) is given by the difference between the observed MPD and the mean random MPD, divided by the standard deviation of the random values. It can be used to indicate, for instance, whether the sequences in a given locality are more related to each other than expected by chance (and the same approach can be applied to PD).
Once PD values for distinct localities or pairwise phylobeta diversity matrices are obtained, it is possible to apply the same methods commonly used in community ecology to evaluate patterns and disentangle the ecological and evolutionary processes underlying these patterns (Fig. 2). For instance, gradient analysis and autocorrelation techniques can be used to evaluate spatial patterns and test relationships between PD and environmental factors. For phylobeta diversity, it is common, for instance, to use ordination methods (Principal Coordinate Analysis (PcoA) or Non-Metric Multidimensional Scaling (NMDS) to compare localities and Mantel tests or Procrustes analyses to model the distance-decay of community similarity or to evaluate the association between ordination scores generated by eDNA and environmental data (e.g., Magurran and McGill, 2011; Legendre and Legendre, 2013). More specific approaches for phylogenetic ordination analysis were recently developed, including the Principal Coordinates of Phylogenetic Structure (PCPS), in which eigenanalysis is performed on a standardized community patterns (abundances or presence-absences) weighted by phylogenetic similarity (e.g., Duarte et al., 2016).
Richness, phylogenetic and functional diversityCombining the different approaches to estimate diversity based on similarity patterns among MOTUs or ASVs may help to understand processes underlying patterns. Here we briefly discuss two possibilities to deal with these approaches (Fig. 3). First, consider the relationship between richness (obtained by counting MOTUs or ASVs) and PD for different localities. Even though PD and richness are intrinsically correlated, deviations from this expectation can suggest a structured diversification process along gradients (Safi et al., 2011). For instance, if PD is lower than expected by the richness in a given locality, it can suggest a recent acceleration of diversification rates due to fast speciation events (Fig. 3A).
 against richness (A) and of Functional Diversity against PD (B). For eDNA metabarcoding, richness is usually estimated by counting basic units such as Molecular Operational Taxonomic Units (MOTUs) or Amplicon Sequence Variants (ASVs), and functional diversity would be obtained by sequencing functional genes involved in adaptive metabolic or developmental pathways that could be directly driven by environmental variation.")
Theoretical interpretations of the deviations of Phylogenetic Diversity (PD) against richness (A) and of Functional Diversity against PD (B). For eDNA metabarcoding, richness is usually estimated by counting basic units such as Molecular Operational Taxonomic Units (MOTUs) or Amplicon Sequence Variants (ASVs), and functional diversity would be obtained by sequencing functional genes involved in adaptive metabolic or developmental pathways that could be directly driven by environmental variation.
A second important issue is related to the relationship between phylogenetic and functional diversity. Following Swenson (2019), we can evaluate the relationship between phylogenetic (PD) and functional diversity (FD) under two distinct, even though not mutually exclusive, reasonings. First, phylogenies can be used as a backbone for understanding patterns of functional diversity and variation in the assemblages. This reasoning is similar to the one previously discussed for the relationship between richness and PD, even though it is important to emphasize that the relationship is mediated by the evolutionary dynamics underlying functional characteristics (Mazel et al., 2018). The second reasoning assumes that PD can be used as a surrogate for FD, when functional data are unavailable (e.g., Cadotte et al., 2011).
In the context of eDNA metagenomics, patterns in functional diversity would be obtained if, rather than analysing general neutral regions to estimate genetic divergence, one focus on particular regions of the genome known to have functional importance and that are involved in relevant metabolic routes (Yates et al., 2021; Condachou et al., 2023). Thus, for eDNA the idea of PD as a surrogate for FD may not be justified because usually there is a clear and more direct way to evaluate the functional genes involved in adaptive metabolic or developmental pathways that could be directly driven by environmental variation.
Patterns of eDNA metabarcoding diversity in Araguaia RiverData and diversity estimatesWe illustrate some of the patterns discussed above using eDNA data from sampling sites along the Araguaia River, based on 18S rDNA gene sequences (see Machado et al., 2019, for details). Water samples filtered through a cellulose filter were used for DNA extraction. We amplified the V4 region from the 18S rDNA with TAReukFWD1 and TAReukREV3 universal primers (Stoeck et al., 2010). The primers were first designed to reach eukaryotic communities in marine water and detected mainly dinoflagellates and close relatives (Stoeck et al., 2010). However, this pair of primers has a wide use for eukaryote detection, even in freshwater metabarcoding studies (Leduc et al., 2019; Fermani et al., 2021; Duarte et al., 2023; Song and Liang, 2023). Herein, the primers were modified including Illumina adapter sequences to build amplicon-based Illumina libraries to sequence in Miseq platform (Illumina). We used 15 out of the original 29 localities from Machado et al. (2019), selecting only those with more than 5000 reads per sample. We evaluated the sequencing base-calling quality using FastQC and removed low-quality bases and contaminant sequences using Trimmomatic (Bolger et al., 2014).
Molecular Operational taxonomic units (MOTUs) were identified using Uparse pipeline with striped primers, pair merging, filter and chimeric sequences exclusion steps (Edgar, 2013), in a “de novo” approach. Zero-radius OTUs (ZOTUs) were also defined, but provided very similar results to the more standard MOTUs (results not shown to conserve space). To test the effect of percentage identity on the process of clustering and identifying MOTUs on phylogenetic diversity, we performed independent MOTU identifications ranging from 95.0% to 99.0% identity, increasing every 0.5%. For Amplicon Sequence Variants (ASVs) identification we used the dada2 R package (Callahan et al., 2016), filtering and trimming (parameters: maxN = 0, maxEE = c(2,2), truncQ = 2, rm.phix = TRUE, compress = TRUE, multithread = TRUE), error learning model, pair merging and chimeric sequences exclusion. After defining these basic units, we used Mafft (Katoh et al., 2009) for align the sequences of MOTUs and ASVs, and estimate a phylogenetic tree with a maximum likelihood approach using IQTree software (Nguyen et al., 2015). Iqtree was configurated to estimate the best fit nucleotide substitution model for each dataset.
For each dataset we calculated richness (i.e., counting MOTUs or ASVs) and different metrics for phylogenetic diversity and divergence, including PD, MPD and NRI for each locality. We evaluated patterns of β diversity using a standard Principal Coordinate Analysis of the presence-absence matrices based on MOTUs (truncating at the standard 97% level) and ASVs, comparing these results with those based on the Duarte’s et al. (2016) Principal Coordinates of Phylogenetic Structure (PCPS) that takes into account the phylogenetic structure while calculating the pairwise distances between localities. We also used multiple regression and Procrustes analysis to correlate patterns in α and β diversity (including or not the phylogenetic structure) with patterns of variation in climate, land use, and physicochemical water parameters (see Machado et al., 2015, 2016), as well as with geographical coordinates (mainly latitude). These patterns were defined as the first principal coordinates of a distance matrix between localities based on 22 environmental variables evaluating Multivariate analyses were performed using vegan package, and α and β phylogenetic diversity using several functions of the picante R package (Kembel et al., 2010).
Patterns in α and β diversityWe found a total of 321, 345, 371, 395, 423, 461, 516, 567 and 653 MOTUS with increased levels of clustering (from 95% to 99%, with steps of 0.5%), and a total of 428 ASVs. The geographic patterns of these variables are very similar because of the intrinsic correlation between richness and PD (r > 0.98). However, evaluating patterns in MOTUs identified at different levels of clustering clearly show the robustness of PD estimates, compared to richness (Fig. 4A). As expected, mean local richness increases with increased clustering levels because minor differences in sequences translate into different MOTUs, but PD tends to be stable regardless of the clustering level. Patterns in MPD are also similar, although slightly less consistent than PD.
 for the Araguaia Basin, revealing (A) a stability of phylogenetic estimates (phylogenetic diversity, PD, open circles; Mean Pairwise Distances, MPD, triangles), compared with richness obtained by counting MOTUs (closed circles). These metrics are mean estimates for 15 localities (sites) and are standardized by the maximum values to allow direct comparison of patterns. In (B), patterns in Nearest Relatedness Index (NRI) across clustering levels used to define MOTUs reveal that, above 97% clustering level, a pattern of phylogenetic clustering emerges (see text for detail and interpretation). The dashed horizontal line shows the critical 95% level of NRI to infer phylogenetic clustering, equal to 1.96.")
Patterns of α diversity obtained by varying the clustering level for defining Molecular Operational Taxonomic Units (MOTUs) for the Araguaia Basin, revealing (A) a stability of phylogenetic estimates (phylogenetic diversity, PD, open circles; Mean Pairwise Distances, MPD, triangles), compared with richness obtained by counting MOTUs (closed circles). These metrics are mean estimates for 15 localities (sites) and are standardized by the maximum values to allow direct comparison of patterns. In (B), patterns in Nearest Relatedness Index (NRI) across clustering levels used to define MOTUs reveal that, above 97% clustering level, a pattern of phylogenetic clustering emerges (see text for detail and interpretation). The dashed horizontal line shows the critical 95% level of NRI to infer phylogenetic clustering, equal to 1.96.
It is interesting to highlight that phylogenetic clustering, as indicated by NRI, increased with higher threshold levels used to define MOTUs (Fig. 4B). Based on the overall comparison between ASVs and MOTUs, these results most likely reveal very similar sequences within species or populations, and in some sense validates the more standard use of the 97% clustering level for defining MOTUs (e.g., Glassman and Martiny, 2018). In our empirical example the NRI below 97% clustering level reveal random phylogenetic structure, as expected for these organisms at relatively small (regional) geographical scales.
The correlation between ASV and MOTUs (at the standard 97% clustering level) based on richness was lower (r = 0.77) than the one based on PD (r = 0.87), showing again more congruence between patterns when phylogenetic structure is incorporated into diversity estimates. A much clearer pattern emerges when ordination analyses are used to evaluate beta diversity patterns. Specifically, the correlation between the first PcoA axis obtained with ASVs and the first PcoA axis obtained with MOTUs was weak (r = 0.06), whereas a much higher correlation (r = 0.68) was observed when the first PCPS axes, which incorporate the phylogenetic structure, were used.
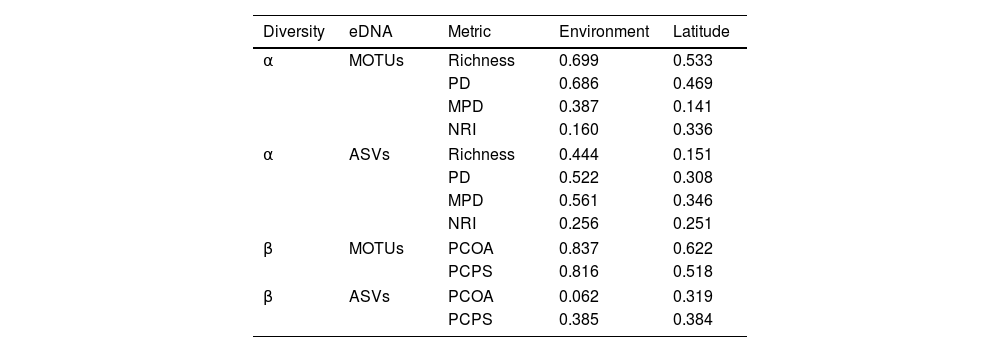
There is a latitudinal gradient in environmental variation (r = 0.698 between latitude and the first principal coordinate of environmental distances). But, even so, correlating α- and β-diversity patterns reveal differences between ASV and MOTUs and, moreover, between richness and phylogenetic diversity estimates (Table 1). For α-diversity estimates, richness and PD based on MOTUs are similarly correlated with the first principal coordinate of environmental variation (r = 0.69 and r = 0.68) and with latitude (r = 0.51 and r = 0.47). For ASVs, these same correlations are in general lower, but we observed a change in the relative magnitude of the correlation between richness and PD with environment (r = 0.52 and r = 0.44), with PD giving higher correlation. Moreover, results for latitude are different for ASVs, with a much lower correlation for richness (r = 0.15) than for PD (r = 0.30). MPD are more correlated with environment and latitude when based on ASVs than when based on MOTUs. NRI has a lower correlation with environment and latitude, even though stronger phylogenetic clustering was observed for ASV (Table S1 in the supplementary material), high more clustered localities found in the southern regions of the basin.
Correlations between α-diversity and β-diversity estimates based on MOTUs and ASVs and environmental variation (first principal coordinate of 22 environmental variables) and latitude of 15 samples along Araguaia River Basin, for eukaryote eDNA. For α-diversity, correlations were estimated with MOTUs and ASVs (richness), phylogenetic diversity (PD) and mean pairwise phylogenetic distances (MPD). For β-diversity, correlations were calculated between the first principal coordinates of pairwise distances counting MOTUs and ASVs (PCOA) and for the first PCPS incorporating phylogenetic structure.
| Diversity | eDNA | Metric | Environment | Latitude |
|---|---|---|---|---|
| α | MOTUs | Richness | 0.699 | 0.533 |
| PD | 0.686 | 0.469 | ||
| MPD | 0.387 | 0.141 | ||
| NRI | 0.160 | 0.336 | ||
| α | ASVs | Richness | 0.444 | 0.151 |
| PD | 0.522 | 0.308 | ||
| MPD | 0.561 | 0.346 | ||
| NRI | 0.256 | 0.251 | ||
| β | MOTUs | PCOA | 0.837 | 0.622 |
| PCPS | 0.816 | 0.518 | ||
| β | ASVs | PCOA | 0.062 | 0.319 |
| PCPS | 0.385 | 0.384 | ||
Similar results were obtained for β-diversity, with the marked difference between PCOA based on counting ASVs, which shows absence of environmental patterns (r = 0.06) and the respective PCPS that shows a higher correlation with environmental variation (r = 0.386). The patterns revealed by PCPS based on ASV are less correlated with environment than those based on MOTUs. Procrustes analyses based on the first two principal coordinates of each dataset reveal the same correlation patterns observed for bivariate analyses based on the first principal coordinates. For the MOTUs, Procrustes r is higher than 0.8 for both PCOA based on counting MOTUs and for the PCPS, but for ASVs the correlation appears when using the PCPS only (r = 0.472; P < 0.01). Even though both results based on MOTUs are more correlated with environment than ASVs, a higher convergence of patterns is found between MOTUs and ASVs when incorporating phylogenetic structure with the PCPS. The latitudinal patterns in β-diversity based on ASVs and MOTUs show a similar pattern, though slightly weaker, than those observed for environment.
Finally, it is important to notice that, considering the methodological and theoretical goals of this study, we did not attempt to assign MOTUs or ASVs and used total eukayote 18S sequences from eDNA for our analyses, favouring a “de novo” approach. However, even without supporting any form of closed-reference approaches for analyzing total diversity based on eDNA, it may be interesting, in some situations, to try some assignments to better establish a phylogenetic scale or to define more inclusive clades when using universal primers, especially to evaluate more mechanistic environmental or ecological explanations underlying empirical diversity patterns.
Concluding remarksWe discuss here how eDNA metabarcoding data can be better explored by explicitly incorporating phylogenetic diversity estimates, which are intrinsic to this kind of data, as the standard procedures used to define MOTUs and ASVs start from the similarity among sequences can also be used, in addition, to build phylogenies. Hopefully this perspective stimulates researchers obtaining eDNA metabarcoding data to perform their data under the community phylogenetics framework instead of (or in addition to) the more standard community ecology approach. As demonstrated by our empirical example, the phylogenetic diversity estimates are more robust than those based on counting units, which is strongly dependent on the clustering level in the case of MOTUs. The robustness of diversity estimates in the Araguaia River, when incorporating phylogenetic structure, emerges especially when evaluating environmental and geographic components of β-diversity. This is likely because of the more conservative criterion used for defining ASVs, which reduces local sample sizes and introduces additional statistical errors in the estimates based on counting units.
Nevertheless, our empirical analyses reveal that ASVs and MOTUs provide similar results, and it is interesting to note that evaluating phylogenetic structures using NRI validates the standard criteria for defining MOTUs at 97% similarity between sequences. It is also important to highlight that both α- and β-diversity estimates from eDNA in the Araguaia River reveal environmental and geographical correlations that were not identified in previous analyses (i.e., Machado et al., 2019; even though we used a more conservative filter for data quality and a broader taxonomic scale, based on general eukaryote rather than in unicellular, microeukaryotes).
Thus, there are many advantages of incorporating phylogenetic structure when dealing with eDNA metabarcoding both to describe patterns and to try to identify more complex processes related to ecological and evolutionary mechanisms underlying such patterns. As these techniques provide more consistent and informative diversity estimates, showing more clearly correlation patterns with environmental variation, they are likely more effective in biodiversity monitoring programs and in evaluating responses to human-driven disturbances and threats.
Authors’ contributionsJAFD-F, TNS, MPCT and JCN designed the research. Original data on eDNA was compiled and organized by CPT, LCGV, KBM, LJC and JCN. RN and CPT reprocessed eDNA data. MPCT and TNS provided necessary funding for field and supervisioned laboratory work. JAFD-F, TNS and LMB wrote a first draft of the manuscript, and all authors contributed to the final submitted version.
FundingThis work is a contribution of the National Institute of Science and Technology (INCT) in Ecology, Evolution, and Biodiversity Conservation funded by CNPq (grant 465610/2014-5) and FAPEG (grant 201810267000023). J.A.F.D.-F, L.M.B., M.P.C.T., T.N.S., L.C.G.V. and J.C.N. has been continuously supported by CNPq productivity grants, and work by K.B.M was supported by a CAPES/PROEX doctoral fellowship, and by FAPEG ProDoctoral Fellowships to K.B.M. and R.N. The eDNA analyses for Araguaia River biodiversity are developed in the context of agreement between the Tropical Alliance Water Research (TWRA) and FAPEG (proc. 202210267000536), with grants to M.P.C.T., L.C.G.V., J.A.F.D.-F, J.C.N., R.N., C.P.T., and L.J., and the PPBio Araguaia project supported by CNPq (proc. 441114/2023-7).
Data availabilityData will be available from authors upon request up to acceptance.
Conflict of interestThe authors report no declarations of interest.
Box 1. Biodiversity and the Continuity of Life
A conceptual starting point to show the importance of using phylogenetic diversity metrics is to consider the “continuity of life”. In short, biological diversity should be viewed as a continuum, and not only estimated by counting discrete units at a given hierarchical level, such as species (e.g., Mace et al., 2003; Gaggiotti et al., 2018) (Fig. 1). In the context of eDNA metabarcoding, small genetic distances among sequences can simply reflect sequencing errors, but increasing these distances may reflect variation within social groups, kin structure, and local populations. If sequences are obtained from different localities, then different analyses can be done at different spatial scales. Increasing geographically structured divergence leads to evolutionary-independent lineages, which we usually call species (Diniz-Filho and Bini, 2011). However, the analyses of eDNA data are usually based on discrete units at low hierarchical levels only, ignoring the biodiversity continuum.
A straightforward approach based on eDNA is to define Molecular Operational Taxonomic Units (MOTUs), based on different ways to define a fixed critical level of similarity among sequences (i.e., say, 3%) above which these sequences are considered distinct units for operational purposes, roughly representing species. The main problem is that there is no particular reason why individuals from different species (assuming a realist biological species concept, for instance) have the same mean level of similarity, or that this level is 3%. A more recent idea is to use model-based approaches that allow inferring biologically meaningful sequences in the sample prior to amplification, dealing with sequencing errors and defining ASVs (e.g., Callahan et al., 2017; De Santiago et al., 2022). ASVs were initially used as a method to ‘denoise’ data prior to defining MOTUs, but new ASV methods have been proposed as an alternative way to define units for further analyses. However, using ASV does not solve the issue of the continuity of life, and indeed many other methods to deal with a more continuous variation are available since the early 2000s (e.g., Tucker et al., 2017).
We thank two anonymous reviewers for useful suggestions and criticisms that improved previous versions of this manuscript.
The following is Supplementary data to this article:

