


Climate and land-use change, raise significant threats to biodiversity, affecting species ranges worldwide. Both factors operate on different scales, so including spatial traits that allow them to be appropriately evaluated is relevant to the early identification of extinction risks. We aimed to evaluate the potential effects of climate and land-use change on the extent of suitable habitat of a set of species of Andean anurans; to assess the loss of the area of occupancy (AOO); and to estimate the risk of extinction according to the percentages of loss of the extent of suitable habitat and AOO. We modeled the current and future potential distributions of 30 endemic anurans from the Colombian Andes. We calculated the change in current potential distributional ranges and in the extent of suitable habitat under two climatic regimes and land-use scenarios. We quantified the AOO using the 2×2km grid method and assessed its loss based on habitat availability in the combined scenarios. We used the percentage losses of the extent of suitable habitat and AOO to estimate and compare the extinction risks according to IUCN criteria. We found that climate and land-use change will cause a relative loss of 63.4 % to 79.4 % of the current extent of suitable habitat and 49.6 % to 72.6 % of AOO of the Andean anurans by the year 2050. The loss of AOO made it possible to detect twice as many species at high risk of extinction than the loss of the extent of suitable habitat. The effects of climate change and habitat loss could lead to potential extinction events in Andean frogs. Extent of suitable habitat, and especially the area of occupancy are appropriate spatial traits that could be used to assess extinction risks in species sensitive to local habitat modification by climate change and land-use change.
Climate and land-use change, affect aspects such as abundance, phenology, and geographic distributional ranges of species, leading to significant alterations in global biodiversity (Newbold, 2018; Pereira et al., 2010; Sala et al., 2000). These factors of environmental change deteriorate ecosystems, produce population losses, and increase the extinction rates of species, putting at risk the environmental services that biodiversity offers to human well-being (Díaz et al., 2005). Climate is considered one of the most important factors shaping current patterns of biodiversity on the planet (Currie et al., 2004; Hawkins et al., 2003). However, on a regional scale, the availability of suitable habitat in the landscape is one of the most important variables in species composition and richness (Fahrig, 2003; Hanski, 2011).
The conversion of large natural areas to land for crops, pasture and urban infrastructure is considered one of the most important factors in the transformation of terrestrial ecosystems in modern times, generating loss and habitat fragmentation for species (Armenteras et al., 2003; Newbold et al., 2015). Globally 70% of amphibian species are considered threatened by landscape transformation (IUCN, 2019). On the other hand, the climate has played a major role in the processes of extinction and speciation (Hutter et al., 2017) However, the increase in greenhouse gas emissions has caused anthropogenic climate change that is accelerating extinction events (Barnosky et al., 2011; Diffenbaugh & Field, 2013; Urban, 2015). Climate change and land-use change challenge biodiversity conservation actions, and understanding of the future effects of these change is urgent for alerting decision-makers and implementing early conservation measures (Peterson et al., 2003; Visconti et al., 2016).
Climate modeling has made significant progress in improving climate change scenarios, allowing a better understanding of their effects on biodiversity and ecosystems(Harris et al., 2014). Despite progress in modeling land-use change, most assessments have neglected its impacts on species (Sirami et al., 2017; Titeux et al., 2017). Land-use change scenarios show that natural habitats will continue to be degraded or destroyed by crops and infrastructure with negative impacts on local and global biodiversity (Chaudhary and Mooers, 2018; Newbold et al., 2015), especially on amphibians and reptiles (Böhm et al., 2013; Catenazzi, 2015). Therefore, including both factors in the assessment of the future of biodiversity is important, because the combined effect of climate change and land-use change considerably jeopardize the survival of species (Diffenbaugh & Field, 2013; Oliver & Morecroft, 2014).
One of the most commonly used approaches for assessing the effects of climate change on the geographic ranges of species are species distributional models (SDM) (Elith et al., 2010). The SDM allows the exploration of appropriate environmental conditions, estimating current potential distributions and projecting them into future environmental conditions using a broad array of statistical learning methods associating georeferenced observations of a biotic response (abundance, presence) variable with a set of explanatory variables of biological relevance for the species (Elith & Leathwick, 2009, Franklin, 2013). Current and future distributional models combined with information regarding current and projected remaining land cover due to land-use change have the advantage of spatially locating both factors and estimating potential change in suitable extent of habitat for the species of interest (Fouquet et al., 2010; Oliver & Morecroft, 2014). For many species, the combination of these two factors is important for their survival. Evaluating the combined effect of the forecasts of both models allows us to discard areas without adequate habitat conditions, i.e., regions that may maintain stable climatic or habitat conditions, but where the natural cover or climate has a high probability of suffering negative changes; however, it is necessary to use adequate metrics that allow us to link the spatial changes of both factors with the risk of extinction..
The area of occupancy (AOO), and extent of suitable habitat are spatial traits used in the IUCN Red List Assessment to estimate extinction risk, based on changes in geographic ranges (criteria B) or as an indirect measure of population size decline (criteria A) (IUCN Standards and Petitions Subcommittee, 2017). The AOO is a spatial trait specific to each species that tends to be better correlated with population size, and it provides an accurate estimate of extinction risk (Breiner et al., 2017; Gaston & Fuller, 2009; Keith et al., 2018; Murray et al., 2017). The AOO has proven useful for capturing changes in species ranges in climate change risk assessments (Breiner et al., 2017; Di Marco et al., 2015,; Pearson et al., 2014). In spatially explicit scenarios, the AOO has great potential for capturing the local habitat modifications due to the combined effects of climate change and especially land-use change (Gaston & Fuller, 2009). It is a factor that operates at the landscape scale, affecting the habitat and the area of occupancy of species (Grant et al., 2016; Keith et al., 2018).
For Andean amphibians, climate is a key adaptative factor that acts as a barrier that limits dispersion and favors speciation, producing a high turnover of species in the different altitudinal bands (Bernal & Lynch, 2013; Navas, 2006). Neotropical amphibians are considered the most sensitive to climate change of any group of vertebrates (Foden et al., 2013; Lawler et al., 2009; Raxworthy et al., 2008) and one of the groups most threatened by habitat loss, with a high percentage of species at risk of extinction (Catenazzi, 2015; Stuart et al., 2008). Habitat suitable availability is another key factor for the survival and amphibian conservation (Cushman, 2006). For instance, local habitat modification has been found to be an important extinction factor in species with narrow distribution ranges and directly developed larvae (Nowakowski et al., 2017). On the other hand, in amphibian species with aquatic larvae, habitat division affects the dispersion of juveniles towards growth and reproduction habitats, increasing the risk of extinction (Becker et al., 2007).
In the Andes region, few studies have evaluated the combined effects of climate and land-use change on amphibians (Báez et al., 2016). Land-use trends in the Colombian Andes indicate that paramos ecosystems, as well as Andean and sub-Andean forests, will continue to be transformed (Rodríguez Eraso et al., 2013). Climate change scenarios project that the average annual temperature will increase in the range of +0.77 to 0.88°C for the period 2011 - 2040, and between +1.42 to 1.66°C for the period 2041 – 2070 (IDEAM, 2015). In species with low dispersal capacities, such as amphibians, these factors of change can increase the risk of extinction (Cushman, 2006) Thus, our objectives are as follow: (a) to evaluate the potential effects of both climate and land-use on the extent of suitable habitat of a set of species of Andean anurans; (b) to assess the loss of area of occupancy (AOO) based on the availability of habitat suitable; and (c) to estimate the risk of extinction according to the percentages of loss of the extent of habitat loss and AOO, using a multi-stage analysis of climate and land-use change. The inclusion of a spatial trait related to population size might improve signal responses to the combined effects of climate and land use change in a region with high diversity, poor information about species population trends, and a high rate of transformation of their natural ecosystems (Hannah, 2012; Rodríguez Eraso et al., 2013). This information is key to understanding the perspective of extinction risk that is faced by the diversity of endemic anurans in the Andean region in different scenarios of environmental change.
Material and methodsStudy areaThe World Wildlife Fund (WWF 1997) ranks the northern Andes ecoregion among the 200 priority sites for the conservation of global biodiversity. At the South American level, the Andean region of Colombia is among the most critical conservation priorities, given the uniqueness of its biodiversity and the degree of threat it faces from its low representation in protected areas (Bax & Francesconi, 2019). The Colombian Andes covers an area of approximately 287,720km2 with three independent mountain ranges that diverge from the south to the north of the country: the Cordillera Occidental, the Cordillera Central and the Cordillera Oriental. These cordilleras (or mountain ranges) are separated by the valleys of the Magdalena and Cauca rivers. Each mountain range has its own climatic, geological and structural characteristics (Rodríguez Eraso et al., 2013)·. The Andes region has been proposed as a candidate for the category of "biodiversity hotspot" for conservation, considering its exceptional number of endemic species in both vertebrates and plants (Brooks et al., 2002; Myers et al., 2000).
In Colombia, Neotropical amphibians reach one of the highest diversities recorded for any group of vertebrates (Myers et al., 2000; Stuart et al., 2008, 2004). In the Andean region of Colombia, it is estimated that there are around 477 anuran species of which more than 60% are endemic (Armesto & Señaris, 2017; Bernal & Lynch, 2008). In the Andes, amphibian diversity finds its highest level in cloud forests and in intermediate elevations. The rain frogs of the genus Pristimantis and glass frogs (Centrolenidae) are the most representative groups of Andean anurans (Castroviejo-Fisher et al., 2014; Meza-Joya & Torres, 2016).
Species records and occurrence dataWe modeled the potential distribution for 30 species of anurans, grouped into 4 families: Bufonidae (4 sp.); Centrolenidae (2 sp.); Craugastoridae (22 sp.), and Hylidae (2 sp.); and 10 genera (Atelopus, Rhinella, Osornophryne, Centrolene, Nyphagus, Hypodactylus, Pristimantis, Tachiramantis, Dendropsophus and Colomascirtus). The number of species represents 6.7% of the anuran species richness (approximately 447 spp) reported for the Colombia Andes. A total of 37,600 records of occurrence were obtained for the Andean distribution of anuran species. The process for the selection of the species included the following criteria: 1) species endemic to Colombia; 2) altitudinal limit of distribution ≥1000m.a.s.l.(Acosta-Galvis, 2015; Bernal and Lynch, 2008) 3) species whose specific habitats are sub-Andean forests (1000-2000m.a.s.l), Andean forest (2000-3000m.a.s.l), and paramo ecosystem, (>3000m.a.s.l) (Rodríguez et al., 2006) (see Supporting Information Appendix S1 Pre-processing of presence data and Species List Table S1).
The occurrence data were obtained from four sources of information: a) records from amphibian collections: Instituto de Ciencias Naturales-Universidad Nacional de Colombia and MHUA-Museo de Herpetología de la Universidad de Antioquía; b) biological information records: GBIF (www.gbif.org) and iNat (www.inaturalist.org); c) unpublished records provided by the IAvH (Alexander von Humbolt Institute) of Colombia obtained during biodiversity studies for the delimitation of páramo ecosystems; and d) a review of the bibliography of taxonomy and ecological studies of anurans carried out in the study areas where frogs were collected or sighted (e.g., Issacs-Cubides & Urbina-Cardona, 2011)·
To avoid over-adjustment in species distribution models and spatial autocorrelation derived from field data collection techniques, a 4km spatial filter between occurrence points was performed (Boria et al., 2014; Kramer-schadt et al., 2013) using the spThin package v.0.1.0 (Aiello-Lammens et al., 2015) in R (Core team 2018). Finally, a database with 468 occurrence points was obtained. The number of occurrences ranged from 8-25 with an average of 14.6 localities per species.
Climate data and scenariosWe correlated a set of climate variables with occurrence data to explore new environmental areas, based on current and future climatic conditions. For current conditions, we obtained 19 bioclimatic variables from the WORLDCLIM database v.1.4 (www.worldclim.org) (Hijmans et al., 2005) at a resolution of 0.30-second arcs, equivalent to a pixel size of ∼1km2 near the equator. (see the complete list of variables in Supporting Information Table S2). These variables consisted of interpolated climatic layers, constructed from climatic data, collected from weather stations around the world between 1960-2000 (Hijmans et al., 2005).
To evaluate the effects of future climate change, we selected two climate change scenarios, denominated Representative Concentration Pathway (RCP) from the 5th assessment report of the Intergovernmental Panel on Climate Change (IPCC, 2013). This new family of scenarios projects an increase in radiative forcing levels, measured in W/m2, according to the different pathways of greenhouse gas emissions (Moss et al., 2010). We selected the scenario called “stabilization” or the RCP4.5 emissions scenario, where a moderate decrease in emissions is expected, given the implementation of green technologies and the expansion of forest areas (Thomson et al., 2011). And we selected the RCP8.5 called the “trend” scenario, which foresees a linear advance in the projections of population growth, a higher demand for energy resources, and an absence of global policies for climate change (Riahi et al., 2011), both scenarios extending to the year 2050 (the average for the period is 2041 to 2060).
As many Atmosphere-Ocean Global Circulation Models-AOGCMs are available for global climate, we objectively selected a small group of AOGCMs for future projections of species distributions, using the k-medium clustering approach, following an adaptation to the methodology proposed by Casajus et al. (2016). This approach maintains the central trend of the models, preserving the uncertainty of future climatic conditions. We analyzed 28 AOGCMs (14 AOGCMs x 2 RCP=28) selected as representative for the new generation of climate scenarios (Knutti et al., 2013). Thus, we obtained a subset of seven AOGCM: four for the RCP4.5 (CSIRO ACCESS1.0, GISS E2 R, ESM LR, GFDL CM3) summarizing 81% of the expected climatic variation in this scenario and three for the RCP8.5 (CSIRO ACCESS1.0, CNRM CM5, GFDL CM3) summarizing 79% of the variation (see Supporting Information Appendix S2, Table S3, S4 and Figure S1 for description and results about AOGCMs selection).
Species distribution modelsWe modeled the potential distribution of species using the Maxent algorithm (v. 3.3.3k) (Phillips et al., 2006). Maxent is an algorithm with high performance for modeling species distributions with only presence data and small samples (Hernandez et al., 2006; Pearson et al., 2007; Warren et al., 2014). However, Maxent's default configurations can produce over-adjusted models, leading to inadequate results (Radosavljevic & Anderson, 2014). To avoid over-adjusted models and to maximize the little information available, we selected the Maxent configuration that would produce the model with the optimum level of complexity for each species (Anderson & Gonzalez, 2011; Warren et al., 2014; Galante et al., 2018). An optimal level of complexity implies the appropriate parameterization of the algorithm based on the amount of presence data and environmental variables available in order to balance the goodness of fit of the model with the complexity of the parameters used. For this, we modified the values of two critical parameters in the Maxent configuration: feature class (FC) and regularization multiplier (β), creating 60 combinations for an equal number of models for each species (see Supporting Information Appendix S3, and Table S5 for description and results on calibration models). The Jackknife method (k-1) was used as a data partitioning method for the evaluation of the models, which consists of reserving one occurrence data for the assessment while running the same number of models with the remaining data (Pearson et al., 2007; Shcheglovitova & Anderson, 2013). The criteria for the selection-models were the lowest AICc values, the high AUCtest, and the low AUCdif values (Galante et al., 2018; Warren & Seifert, 2011).
The models were calibrated in accessible areas or areas of potential dispersion for each species (M within the BAM diagram) (Soberón et al., 2005; Barve et al., 2011; Soberón, 2010). For these, we developed a methodology to delimit the area M for each species (see Supporting Information Appendix S4 for methodology), an approach that has been shown to improve the effectiveness of species distribution models (Cooper & Soberón, 2018). This methodology was applied to each occurrence data set so as not to overestimate the potential distribution area
We projected each model to current and future climatic conditions using the seven AOGCM, and we used all occurrence localities for each species and 10,000 background points. We considered avoiding any extrapolation types and maintaining the response of the models within the present climatic conditions (Elith et al., 2011; Owens et al., 2013). In each case, we obtained a map of habitat suitability. We evaluated the performance of the Maxent model by calculating the commission and omission error values (Anderson et al., 2003) using partial ROC curves test (Peterson et al., 2008). We ran partial ROC curves specifying 1,000 repetitions for the resampling with replacement, and 50% of points in the bootstrap, and for each species we ran the partial curves using 1-omission threshold greater than 0.95 of the curve area for the evaluation in NicheToolBox (Osorio-Olvera et al., 2018).
We assembled the subgroups of habitat suitability maps obtained from the seven AOGCM, for each RCP, using the weighted average consensus method, using as a weighted value the number of AOGCMs grouping in each AOGCM selected according to the k-mean method in order to create a single habitat suitability map. We use maximization of the sum of sensitivity and specificity (maxSSS), one of the best methods of threshold selection for distribution models developed with presence-only data and when random points are used instead of actual absences(Liu et al., 2013, 2016) to transform habitat suitability maps of current conditions and climate projections into presence/absence binary maps.
Extent of suitable habitat, and land-use change scenariosWe used the species distribution model and a remotely sensed land cover/use map for the year 2005 (with a resolution of 90m) as baseline for assessing potential extent of suitable habitat of each anuran species. The land cover/use map was derived from 2004-2005 Landsat TM images by Rodríguez Eraso et al. (2013). We consulted the IUCN Red List (Janury 2018) for the habitat preferences used by each species analyzed, and we considered natural vegetation cover as potential habitat according to the type of habitat reported (see Supporting Information, Table S1). We considered the other transformed covers (crops and pastures) as non-habitat, assuming they have a negative impact on amphibian populations. To refine the potential habitat map for each species, we excluded areas that were outside the reported altitudinal ranges for each species (Acosta-Galvis, 2015; Bernal and Lynch, 2008), extending 100 meters to the lower and upper limit, due to the uncertainty of the true elevation range; a map of elevation at 90m resolution was used for this (Ficetola et al., 2015; Ocampo-Peñuela et al., 2016).
We took into account, two regional land-use change scenarios for the Colombian' Andes up to the year 2050, both developed by Rodríguez Eraso et al. (2013). The two scenarios were based on the IMAGE model (Integrated Model to Asses Global Environment) used to implement the IPCC-MESSRS scenarios (IMAGE 2001) under the assumption that market forces drive Latin America's demographic, economic, environmental and technological trends. The first scenario involved an increase in pasture cover (IPS), where there will be an increase in the number of cattle pastures. The second scenario pointed to a crop intensification scenario (CIS), where there would be an intensification of cropland. We used the baseline map and land-use change scenarios to filter the potential extent of suitable habitat in the current and future specie distribution models. In this way we obtained four combined maps of environmental change conditions for each species: RCP4.5+IPS, RCP4.5+CIS; RCP8.5+IPS and RCP8.5+CIS.
Area of occupancy (AOO)The loss of adequate environmental conditions due to climate and land-use change are considered stochastic disturbances that generate a negative rate of population growth, leading to the collapse or local extinction of the population (Murray et al., 2017). We used the AOO as a spatial feature or minimum unit to evaluate changes in environmental conditions. We considered two environmental change conditions for the availability of suitable habitats in the AOO: (i) under climate change only and (ii) under the combined factors (climate+land-use change). We assumed the environmental conditions and species occurrences as a proxy for the presence of a potential population. First, we calculated the AOO initially by drawing a grid with squares of 2kmx2km overlaying the occurrence data, and the area of the occupied squares was used as the total area (UICN, 2017). We drew a circular buffer area of 4km2 around the occurrence data to evaluate the extent of suitable habitat within and near each AOO (Breiner & Bergamini, 2018) to avoid the potential errors induced by the point of origin of the grid (Murray et al., 2017) (see Supporting Information Figure S2 for methodology).
Under climate change only, we considered the potentially occupied AOO if they matched the areas of presence on the binary map. If the AOO coincided with the boundary of the binary map, we considered them collapsed if the area of absence on the inside was greater than 50%. Under the combined conditions, we considered the above terms and the presence of land-covers reported as suitable habitat. We used the minimum habitat amount criterion of 80ha, proposed by Schneider-maunoury et al. (2016), based on the potential negative effects of the edge effect on the abundance of amphibian and reptile forest habitat specialists in patches of smaller area specifically in tropical forested areas. Thus, if inside the AOO an amount of coverage equal to or greater than 20% of the AOO area (80ha) remained, we considered it as occupied area. We assume that the AOO with a smaller amount of habitat as collapsed or unoccupied, even in the presence of optimal climatic conditions.
Data analysis and extinction riskData on the dispersal abilities of Andean anurans in the tropical region are scarce or non-existent. Due to narrow distributional ranges, high endemism, and habitat specificity, tropical amphibians were considered to have low mobility capacity (Cushman, 2006). In this sense, we evaluated the effect of climate change on the potential distribution of anurans, considering a scenario of non-dispersion and in this way future distributions comprised those areas that overlapped with current distributional areas.
We assessed the change in the areas of distribution in each climate change scenario only and the change of extent of suitable habitat and the AOO in the combined climate and land-use change scenarios. We used a two-factor ANOVA to assess the difference between climate change only and extent of suitable habitat in each combined scenario. Additionally, we used one-factor ANOVA to assess the difference the change of and AOO between RCP4.5 - RCP8.5+IPS; and RCP4.5 - RCP8.5+CIS.
We used the relative loss values of extent of suitable habitat and AOO to assess extinction risks according to Criterion A3(c) (UICN, 2017). Criterion A3 considers a "reduction in population size that is projected, inferred or suspected to be achieved in the future," and sub-criterion (c), "from a reduction in area of occupancy (AOO), extent of presence (EOO) and/or quality of habitat." Thus, we classify species with an 80% reduction in AOO as Critically Endangered, 50% as Endangered and 30% as Vulnerable.
ResultsWe obtained 30 models that predicted the potential geographic distribution of each species from climatic variables in the Andean region of Colombia. The criteria of models-selection showed high AUCtest values on average, ranging from 0.77 to 0.95 (mean±d.e.=0.891±0.046), while AUCdiffe values showed low values (mean±d.e.=0.045±0.023). The value and other evaluation metrics for the parameters obtained are presented in the supplementary material (See Table S5). All SDM created for the selected species showed high values for the partial ROC test (1.30 – 1.87; P < 0.05), with a mean omission rate of only 10 %, indicating that the models of potential distribution were satisfactory.
Our estimates of the current size of distribution areas show that 40 % (12 species) of the species had highly restricted distributional ranges (<5000 km2), 50 % (15 species) had distributional ranges between 5000-20000 km2; and 10 % (3 species) had ranges > 20000 km2 (Fig. 1). The extent of suitable habitat in 2005 with respect to potential area of distribution fluctuated from 20.2 % to 78.4 %, with an average of 42.1 %. (Fig. 2a and 3a).
. The blue parallel lines separate the species we consider highly restricted (<5000 km2), moderately restricted (5000-20000km2) and of low restriction (>20000 km2), compared to the size of the study area. The empty bars represent the calculated sizes of the current AOO in km2 for each of the species, calculated from the occurrence data available and with cells of 2×2km.")
Estimated size of the distribution ranges for current climatic conditions according to the distribution model elaborated for each species in km2 (grey bars). The blue parallel lines separate the species we consider highly restricted (<5000 km2), moderately restricted (5000-20000km2) and of low restriction (>20000 km2), compared to the size of the study area. The empty bars represent the calculated sizes of the current AOO in km2 for each of the species, calculated from the occurrence data available and with cells of 2×2km.
 climate stabilization scenario (b), and trend scenario (c), both scenarios to 2050.")
In the context of climate change only, our results indicated that all species assessed will lose a fraction (between 9 % - 100 %) of their area of distributions under both climate change scenarios by the year 2050. In the RCP4.5 scenario the projections show that species may lose on average 51.5±21.2 % of their area of distributions (Fig. 2b and 3b), for two species the loss would reach 92 % and 93 %: Pristismantis anolerix and Pristimantis elegans, respectively. In the RCP8.5 scenario the loss of the area of distribution tends to increase, we expected that on average the reduction would be 68.9±20.3 % (Fig. 2c and 3c). Two species would entirely lose their adequate habitat and become extinct: Pristimantis elegans and Pristimantis racemus. Another four species would reach losses above 90 %: Nyrphagus ignotus, Pristimantis anolirex, Pristimantis peraticus, and Hyloscirtus antioquia. Loss percentages were statistically different between scenarios (p=7.931e-05; F=16.74) indicating a different response of the species' distributional areas according to the climate change scenario.
 and unsuitable (red box) relative distributional areas under current climate and land use conditions for Andean frogs (a), relative loss of distribution area under future climate conditions only (blue box) and future climate+changes in land use (green box: crop intensification scenario; yellow box: increased pasture scenario) in the RCP4.5 stabilization scenario (b) and in the RCP8.5 trend scenario (c). Losses in climatic conditions were only calculated based on the size of the distributional area derived from the climate model, and the loss in the combined models was calculated with respect to the currently available climatic habitat and land use conditions.")
Boxplot with the proportion of suitable (violet box) and unsuitable (red box) relative distributional areas under current climate and land use conditions for Andean frogs (a), relative loss of distribution area under future climate conditions only (blue box) and future climate+changes in land use (green box: crop intensification scenario; yellow box: increased pasture scenario) in the RCP4.5 stabilization scenario (b) and in the RCP8.5 trend scenario (c). Losses in climatic conditions were only calculated based on the size of the distributional area derived from the climate model, and the loss in the combined models was calculated with respect to the currently available climatic habitat and land use conditions.
When we combined the effects of climate and land-use change, our results indicated that in the RCP4.5 scenario the average percentage of loss of suitable habitat could additionally increase by 11.9% in scenario IPS and 14.8% in scenario CIS (Fig. 3 b and 4b-d). There would be no total loss of suitable habitat for any of the species, but five species would have losses above 90% of their ranges: Pristimantis anolirex, Hyloscirtus antioquia, Atelopus marinkellei, Pristimastis elegans and Nymphargus ignotus. In RCP8.5 the increase would be 8.5% in the IPS scenario and 7.8% in the CIS scenario (Fig. 3c and 4c-e). Three species might become extinct: P. elegans, P. racemus and H. antioquia, and five species would lose more than 90% of their extent of suitable habitat: P. anolirex, N. ignotus, P. peraticus, Dendrosophus norandinus, and Atelopus marinkellei. Among the land use intensification scenarios (CIS vs. IPS) we found no significant differences in the percentages of the loss of extent of suitable habitat (p=0.3849 F=0.7606).
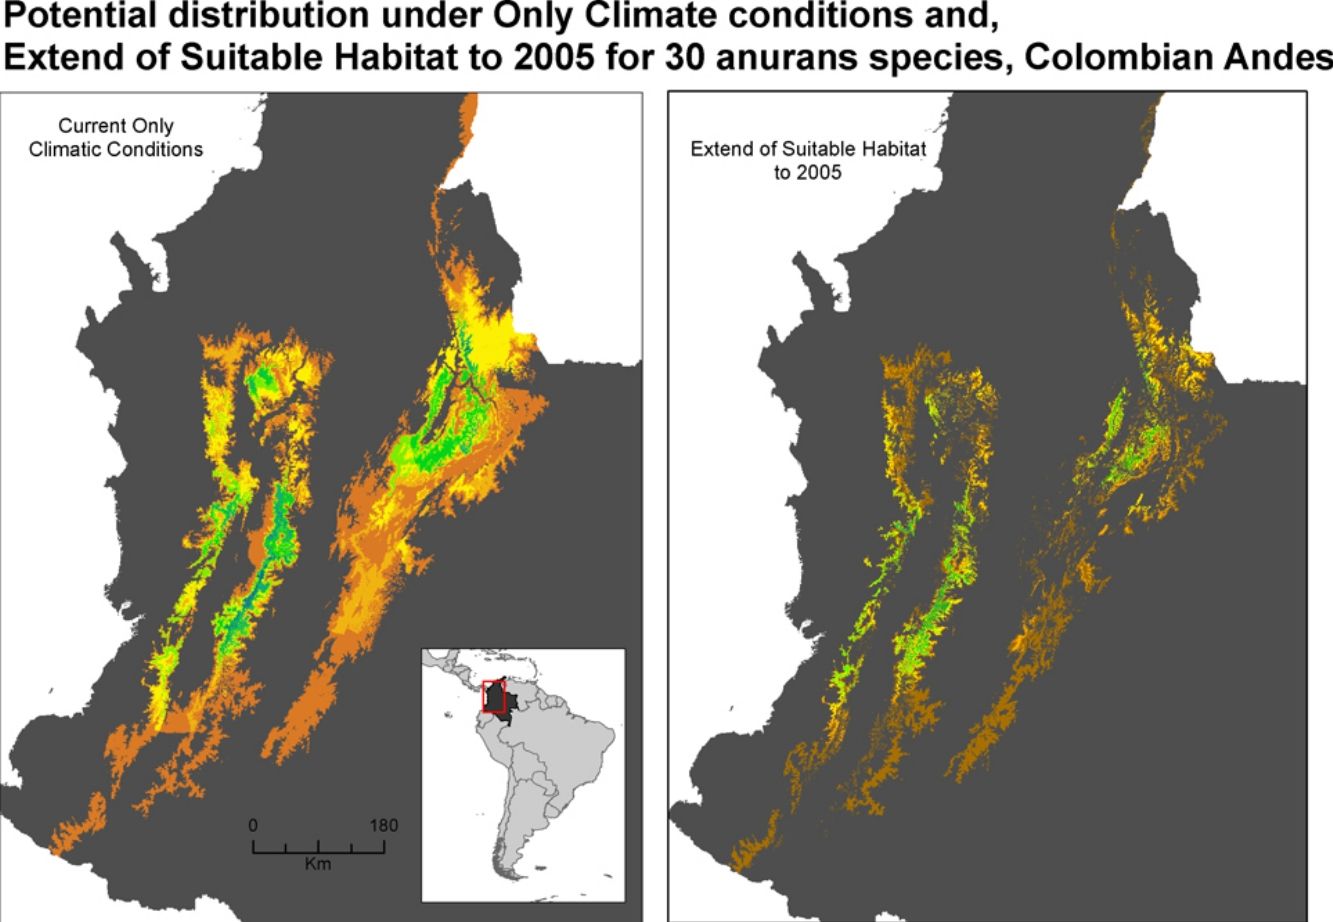
 climate stabilization scenario; (b) climate trend scenario; (c) plus cropland intensification scenario. (c). Climate stabilization scenario (d) and climate trend scenario (d) plus an increase in pastures scenario.")
Potential distribution maps overlaid for the 30 species of anurans assessed. Under current climatic conditions and land use cover maps to 2005 show (a) climate stabilization scenario; (b) climate trend scenario; (c) plus cropland intensification scenario. (c). Climate stabilization scenario (d) and climate trend scenario (d) plus an increase in pastures scenario.
We estimated the AOOs between 36km2 and 132km2 with an average of 71km2 per species (Fig. 1). When baseline of extent of suitable habitat were incorporated, AOOs were reduced by an average of 12% (Fig. 5a). The RCP4.5 predicted that species will lose an average of 38.4±23.3 % of AOO (Fig. 5b) and nine species could experience a loss ≤ 50 % of the current AOO. For the RCP8.5 the average loss increased considerably to 62.6±28.8 % (Fig. 5c) and probably in 20 species the loss of their AOO would be ≤ 50 %. In the combined models of climate change and land use under the RCP4.5+IPS and RCP4.5+CIS scenarios species would lose an average of 49.6% and 55.5% of the AOO (Fig. 5b) respectively, here more than half of the species would lose a fraction ≤ 50 % of their current AOO (17 species in IPS and 21 in CIS). The RCP8.5+IPS probably predicts the loss of 69.6 % of the AOO, and the RCP8.5+CIS loss would be on the order of 72,6 % (Fig. 5c). In this combined scenario 24 and 27 species in the IPS and CIS, would be expected to lose ≤ 50% of their current AOO (See Supporting Information Table S6). There was no direct relationship between the size of the area of distribution and the percentage of loss of the area of occupancy (Fig. 6). We found that there were no statistically significant differences in AOO loss percentages between the intensification scenarios (IPS vs. CIS) (p=0.3128 F=1.0369).
 (violet box) and loss (red box) under current climate and land use conditions for Andean frogs (a); relative loss of AOO under future climate conditions only (blue box) and future climate+changes in land use (green box: crop intensification scenario; yellow box: increased pasture scenario) in RCP4.5 stabilization scenario (b); and in the trend scenario CPR 8.5 (c). AOO losses under climatic conditions were only calculated with respect to the range size derived from the climate model and AOO loss in the combined models was calculated based on the currently available climatic habitat and land use conditions.")
Boxplot with the proportion of current area of occupancy (AOO) (violet box) and loss (red box) under current climate and land use conditions for Andean frogs (a); relative loss of AOO under future climate conditions only (blue box) and future climate+changes in land use (green box: crop intensification scenario; yellow box: increased pasture scenario) in RCP4.5 stabilization scenario (b); and in the trend scenario CPR 8.5 (c). AOO losses under climatic conditions were only calculated with respect to the range size derived from the climate model and AOO loss in the combined models was calculated based on the currently available climatic habitat and land use conditions.
, and RCP8.5 + Land Use Change (b); (IPS=Increased Pasture Scenario; CIS=Crops intensification Scenarios). The horizontal colored lines correspond to the AOO loss thresholds by assigning threat categories according to A3c criteria. The black vertical lines indicate the degree of restriction of the distribution according to Fig. 1.")
Relationship between the percentage of loss of area of occupancy and the size of the distribution area of the anurans assessed in the combined scenarios: RCP4.5 + Land Use Change (a), and RCP8.5 + Land Use Change (b); (IPS=Increased Pasture Scenario; CIS=Crops intensification Scenarios). The horizontal colored lines correspond to the AOO loss thresholds by assigning threat categories according to A3c criteria. The black vertical lines indicate the degree of restriction of the distribution according to Fig. 1.
Our estimates of extinction risk based on the percentages of loss of extent of suitable habitat and AOO showed differences in the assignment of threat categories that species would have in the different environmental change scenarios (Fig. 7). The AOO loss percentages identified the extinction of one species (EW) in the RCP4.5 in both land use scenarios, two Critically Endangered species (CR) and between 18 and 21 Endangered (EN) (Fig. 7a). In the same scenarios, the percentage of loss of extent of suitable habitat tended to place more than 50% of species in the EN categories (19 species) and 6-7 species in CR categories and did not estimate any extinction (Fig. 7b).
 and the percentage of loss of the extent of suitable habitat (b and d) to the year 2050. (IPS=Increased Pasture Scenario; CIS=Crops Intensification Scenarios). The estimates were made according to criterion A3c of the IUCN Red List of species.")
Estimation of extinction risk in Andean anurans evaluated in the different scenarios combined for environmental change to 2050, based on the percentages of loss of the area of occupancy (a and c) and the percentage of loss of the extent of suitable habitat (b and d) to the year 2050. (IPS=Increased Pasture Scenario; CIS=Crops Intensification Scenarios). The estimates were made according to criterion A3c of the IUCN Red List of species.
In RCP8.5, AOO loss estimates identified twice as many species in the Extinction category (6 species in EW) (Fig. 7c) with regard to the threat classification based on loss of extent of suitable habitat (3 species in EW were identified), both in the IPS scenario (Fig. 7d). In RCP8.5+CIS scenario, the AOO loss estimated the classification of five species in the potential EW category and 50 % of the species in the category EN. The evaluation for the loss of extent of suitable habitat (Fig. 4d) showed that the species might be mostly grouped into categories EN and CR.
A total of six species (20%) might become potentially extinct considering the loss of extent of suitable habitat in the AOO due to climate change and intensified land use under some of the environmental change scenarios projected for 2050. The species in the potential EW category were Atelopus marinkellei, Pristimantis dorsopictus, Pristimantis merostictus, Pristimantis miyatai, Pristimantis racemus, and Hyloscirtus antioquia (see Supporting Information Table S6).
DiscussionAccording to the distribution hypotheses developed and based on our projections, the results suggested that: 1) Andean anurans will be exposed to a continuous decline in their suitable habitat areas, increasing the risk of extinction in the different combinations of environmental change scenarios assessed; 2) even under the stabilization scenario (RCP4.5) projected changes in temperature and precipitation, as well as reduction of remaining suitable habitats, would lead to unfavorable environmental conditions for a high percentage of the assessed anurans; and 3) loss of AOOs projected greater extinctions than loss by extent of suitable habitat in the combined scenarios. Extent of suitable habitat and the AOO are spatial traits that had a high potential for capturing the mixed signals of climate change, especially the loss of habitat by land use changes.
Our results suggest that in the future the elevated richness of Andean anurans is at risk of losing a large percentage of its species if the trend scenario (RCP8.5) predominates as a pattern of global socioeconomic development and if at the local level the remaining habitats are not conserved by land use policies that regulate the expansion of crops and pastures for livestock. The loss of area of distribution was different in the two scenarios; it was less in RCP4.5. However, although the loss of range in the stabilization scenario was also high, opting for options for development that lead to this scenario is much more advisable to avoid a higher number of species extinctions.
Amphibian assessments in the tropical region of South America have shown that species in the northern Andean region are highly vulnerable to climate change (Foden et al., 2013), and a high loss of species is predictable in different global warming scenarios (Lawler et al., 2009). Our results confirmed these findings, and we further estimated that the effects combined with changes in land use could double the risk of extinction. Few studies have evaluated the combined effects of climate change and land use change on amphibians in the Andean region. We found only one reference in Ecuador (Barragán Altamirano, 2015), where an average loss of 37% of the distributional area is estimated in a group of Andean anurans without extinctions under a scenario of unlimited dispersal. Our results partially corresponded to what Barragán found, given that our projections for the loss of the distributional area reached an average of 51% in the stabilization scenario and a minimum of 20 % extinction for the anurans that we studied. Considering some of the scenarios of both factors in the Colombian Andes, the effects were apparently greater. To our knowledge, our report was the first assessment of extinction risk in Andean anurans for Colombia using global climate models and regional land use models to illustrate dynamic change.
A study of 46 species of anurans in the Sierra Nevada de Santa Marta, Colombia (Forero-Medina et al., 2011) found patterns similar to our results by the year 2100. This study predicted that at least seven species might lose more than 70% of their current range due to the absence of adequate climate and land use conditions at high altitudes that would challenge the movements of anurans at higher elevation. In a tropical mountainous region of Madagascar Raxworthy et al (2008) assessed the effects of climate change on 30 amphibian and reptile species over 20 years, and they projected total habitat loss for three of the species analyzed. In our research, calculating projections of distributional models and land use changes, we estimated extinction of the fauna of at least six species of anurans of which one, Atelopus marinkellei, has not been sighted since 2007, due to chytridiomycosis, produced by the fungus Batrachochytrium dendrobatidis (Ruiz & Rueda-Almonacid, 2008).
A decline of amphibian populations in the Andean region has been documented in Colombia, Peru, Ecuador, and Bolivia (Lips et al., 2005; May et al., 2008; Pounds et al., 2006). The synergistic effects of climate change, infectious diseases, and habitat loss are cited as the proximate causes of this reduction and extinction of tropical amphibians (Alroy, 2015; Becker & Zamudio, 2011; Blaustein et al., 2011; Jetz et al., 2011). Mechanisms relating to the evolutionary history of Andean amphibians and their rapid diversification in the face of orogenic factors and climate change in the Neotropics have also been proposed as important extinction factors (Greenberg et al., 2017). Species with small geographic ranges, restricted environmental niches, and specialized habitats, are traits relating to the group of species evaluated here. These are evolutionary aspects that have a high relation to the speciation/extinction processes. However, anthropogenic factors are accelerating the rates of environmental change, and they surpass responses for the adaptation of species when compared to changes that occurred throughout geological time that favored extinction events (Urban, 2015)
In species endemic to the Andean region other studies of the potential effects of climate change project a reduction in the size of distributional areas, for birds (Ramirez-Villegas et al., 2014; Velásquez-Tibatá et al., 2013), mammals (Ortega-Andrade et al., 2015), plants (Feeley & Silman, 2010; Garavito et al., 2015) and uphill changes in the ranges of amphibians due to deglaciation in Peru (Seimon et al., 2007). These effects generate significant changes in communities and possible extinctions due to total loss of suitable habitat. Globally, amphibians and reptiles respond more negatively to the combined effects of climate change and land use change compared to birds and mammals, so responses are expected to be disproportionately higher in this group of vertebrates (Newbold, 2018).
There were no significant differences in response to habitat loss between land-use intensification scenarios. This indicates that the two transformative trends in the Andean landscape equally impact the habitats currently occupied by these species. Replacement of forests and natural habitats by pastures and crops cause adverse effects on species and communities of anurans that are highly dependent on conserved natural habitats (Cole et al., 2014; Issacs-Cubides & Urbina-Cardona, 2011; Thompson et al., 2015). For instance, Pristimantis frogs (73 % of the species studied here) are highly vulnerable to the expansion of agricultural and grazing areas (Herrera-Montes et al., 2004). The increase in temperatures could modify soil moisture in the small fragments where they are found, negatively affecting the development of eggs deposited in litterfall. So, it is expected that the most significant number of extinctions will occur in this group (Cole et al., 2014) as the interaction between fragment area and land use has a strong effect on amphibian species density (Phillips et al., 2018). Habitat loss also causes changes in climatic conditions at the edges of fragments, making it difficult to establish frogs in habitats adjacent to cattle grazing areas (Cortés et al., 2008). This increases the distances between patches and reduces the successful dispersal of juveniles that are key to the persistence of amphibian populations (Vonesh & De la Cruz, 2002). On the other hand, species tolerant of landscape transformations (e.g., Pristimantis factiousus and Pristimantis lynchi) might be favored by changes in temperatures produced in habitats and climate change (Nowakowski et al., 2017).
Spatial traits, Climate change, land-use change and risk of extinctionOur results indicated that extent of suitable habitat and the AOO works as an alternative for assessing the local effects of habitat loss due to climate change and land use, obtaining assessments of the future extinction risk of Andean anurans. Our approach could be replicated in other geographical realms to assess the risk of extinction of other taxonomic groups. We used the appropriate IUCN recommended measurement scales for the AOO (IUCN, 2017), using combined high-resolution climate and land use information as a proxy for the permanence or collapse of local anuran populations within the AOO under different future climate and habitat conditions. We did not find a linear relationship between the loss of AOO and the size of the distributional areas [e.g., EOO]. This indicated that the size of the range and its projected changes was not necessarily a parameter associated with the local response to habitat modification (Nowakowski et al., 2017). Our findings suggested that the extent of suitable habitat and the AOO are measure of the geographic range and that these can be linked to local responses to habitat modification of species, both for climate and land-use change.
Our projections indicated that by including the AOO metric together with a minimum habitat amount parameter in the combined models, it was possible to capture the changed signals in land use that allow the collapsed AOO to be properly evaluated at a landscape scale. Incorporating land use change were necessary for assessing extinction risk in the selected group of anurans because we obtained different threat categories than those derived from assessments that only considered change in the extent of distributional areas due to climate change. The AOO as a measure of the range of distribution is a spatial trait unit that can be dispersed or grouped according to the type of species distribution; therefore, the positive or negative effect of a stochastic event will depend on the size of the AOO and the spatial distribution of local populations (Murray et al., 2017; Pearson et al., 2014). Our results showed that the average AOO for the species was small (71km2); therefore, loss of suitable habitat might have an adverse effect on the demography of widely distributed species (Breiner et al., 2017). Extreme climates and habitat loss tend to challenge the survival parameters of each species differently, and this could translate into negative population growth rates in the worst scenario. Low growth rates and high death rates can lead to local extinctions (Selwood et al., 2015).
Implication for conservationOur results are crucial for alerting decision-makers, as considering two of the main forces of landscape transformation (the expansion of crops and pastures) about the future of one of the most threatened groups of vertebrates in the Andean zone, makes it possible to argue in favor of early mitigation strategies that could change the direction in which biodiversity is being driven. Projections of the growing human population indicate an increased demand for food and energy resources, and these will increase conservation conflicts between crops and key biodiversity areas such as in the northern Andes of South American (Brooks et al., 2002; Hannah et al., 2013; Smith et al., 2010). For instance, promoting the restoration of land that has been abandoned by livestock to secondary forests, could be a mitigation scenario that has been shown to have high co-benefits for carbon sequestration and increased biodiversity of Andean anurans (Basham et al., 2016). This strategy would also increase the spatial heterogeneity of vegetation in productive areas that have demonstrated benefits for the diversity of frogs (Brüning et al., 2018), lessening the impact of the effects of land use change on the composition of ecological assemblages in Colombia (Echeverría-Londoño et al., 2016).
ConclusionEvidence from projections shows that the combined effect of climate and land-use change will considerably reduce the extent of suitable habitat for a high percentage of Andean frogs, even in the climate stabilization scenario. Incorporating the potential loss of suitable habitat into extinction risk assessments reduces the underestimation of extinction risk that occurs only through climate change assessment, particularly in habitat specialist species. Extent of suitable habitat and the AOO are suitable alternatives to capture alterations in distribution areas due to climate change and especially due to change in land-use due to the scale on which this factor operates and to obtain future estimates of extinction risk.
Conflict of Interest StatementNo conflicts declared.
Funding informationHigh-Level Human Capital Formation Funds for the Department of Atlántico, Colombia,
Author contributionsW.J.A.H and D.A.P. conceived the ideas; W.J.A.H collected and processed species occurrence and climate data, constructed species distribution models and conducted analyses. D.A.P provided the land use scenarios. N.U.C provided data of localities for some species. W.J.A.H. wrote the manuscript with contribution from N.U.C and D.A.P.
WJAH thanks the Government of the Department of Atlántico/Colombia for the scholarship to finance doctoral studies within the framework of the high-level Human Capital Formation project, scholarship no. 673 of 2014 awarded. To the Herpetology Group of the University of Antioquia for the contribution of presence data from its amphibian collection, to the Alexander von Humboldt Institute for the provision of anurans localities from the páramo delimitation project in Colombia.
The following is Supplementary data to this article:

