


Climate change is one of the key drivers of the dramatic erosion of global biodiversity. Poikilothermic organisms, such as amphibians, are particularly prone to alterations in temperature and precipitation and are therefore expected to be severely impacted by global climate change. We evaluated: i) the potential effects of climate change on taxonomic and functional richness of amphibians in the Atlantic Forest of Brazil, and ii) tested whether forest-dependent and open area species responded differently to climatic stressors. We applied an ensemble forecasting approach using point locality data to establish predictive maps of taxonomic and functional richness for different IPCC AR5 scenarios with two Representative Concentration Pathway trajectories (RCP 4.5 and RCP 8.5) at two temporal projections (2050 and 2070). A significant decline in both taxonomic and functional richness of Atlantic Forest amphibians is expected over the coming decades under the evaluated climate scenarios. The core areas projected to maintain significantly high anuran richness in both components were in coastal high-altitude localities. We found negative effects (losses) to be more pronounced for taxonomic richness. Model outcomes indicate significant losses in both forest and open area species. A few remaining high-altitude sites will then play an important role as potential climatic refuges to safeguard anuran diversity, requiring a dynamic landscape approach as conservation strategy.
We are facing one of the warmest periods on Earth. According to current projections, the global temperature is anticipated to increase between 1.5–5.7 °C in the next century (IPCC, 2021). If emissions remain high, this temperature increase could cross a critical threshold as early as 2030, leading to a series of substantial risks such as water and food scarcities, conflicts, and extreme weather conditions (IPCC, 2021). Because climatic conditions (especially temperature and precipitation) also affect the reproduction and survival, and therefore the spatial distribution of species, the ongoing anthropogenic climate change represents one of the major drivers of biodiversity loss (IPBES, 2019; Pecl et al., 2017). In addition, evidence for global shifts in the distribution of species caused by global climate change is accumulating (Chen et al., 2011; Parmesan, 2006). These shifts can be observed in all spatial and temporal dimensions (seasonal timing of activities like growth, migration, and reproduction) and are expected to be 2.5 times greater than previously thought (Arietta et al., 2020; Pecl et al., 2017). This biogeographic rearrangement will ultimately result in significant biodiversity pattern changes (Sillero, 2021; VanDerWal et al., 2013). To account for these altered patterns and effectively counteract potential declines or extinctions, future conservation strategies will have to be spatially dynamic rather than static. A dynamic approach that considers both spatial and temporal occurrence shifts would particularly be advantageous for taxa that highly depend on specific climatic conditions for reproduction, such as poikilothermic amphibians with complex, predominantly biphasic life cycles (Todd et al., 2011; Duan et al., 2016).
Amphibians represent an ideal organismic model to investigate the effects of anthropogenically driven climate change on biodiversity, since the majority of the species exhibit high levels of dependency on specific micro-climatic parameters and possess narrow ecological niches (Bonetti and Wiens, 2014; Blaustein and Kiesecker, 2002). They were previously shown to be particularly suitable for analyzing the impacts of environmental change on community structure, composition, and diversity at both taxonomic and functional levels (Hölting et al., 2016; Ernst et al., 2006). Moreover, they are a sensitive response group for detecting critical environmental thresholds (Anunciação et al., 2021). Brazil plays a prominent role in this context, as it hosts the greatest amphibian diversity in the world and is currently experiencing rapid and intense human-induced landscape changes (Segalla et al., 2021).
The Brazilian Atlantic Forest is under severe anthropogenic pressure that has led to an unequaled deforestation and degradation over the past decades, which makes it even more vulnerable to the effects of global climate change (Scarano and Ceotto, 2015). The Atlantic Forest originally covered an area of about 150 million hectares and extended from the south to the northeast of Brazil, as well found in Argentina and Paraguay (Ribeiro et al., 2009). This biome is a complex ecosystem composed of different habitats where dense forests predominate, but also open areas such as clearings, fields, swamps, and ponds (Haddad et al., 2013). Currently, only 12–16% of the original forests remain and they are highly fragmented (mean patch size < 50 ha - Ribeiro et al., 2009). Still, this biome is home to nearly 20% of all known South American amphibian species (Carnaval et al., 2009), and over 50% of the amphibian species found in Brazil (Rossa-Feres et al., 2017). Projections for this ecosystem indicate a temperature increase surpassing the global average, accompanied by higher levels of concentrated precipitation compared to the present conditions (IPCC, 2021). Those changes can affect the phenology of amphibians, including the timing of breeding, hatching, and metamorphosis (Ficetola and Maiorano, 2016). Disruptions in these critical life stages can have cascading effects on population dynamics and overall species survival.
While previous studies investigated the effects of land-use change on taxonomic and functional diversity of vertebrates in this biome, the effects of climate change are less well studied (Anunciação et al., 2021; Loyola et al., 2013; Lemes et al., 2013; Coster et al., 2015; Lourenço-de-Moraes et al., 2019). The complexity of evaluating and interpreting the impacts of climate change on populations may be due to the synergistic interactions with land-use impacts, which further complicate the interpretation (Hölting et al., 2016). One strategy to address the issue of complex interactions between drivers and to account for species-habitat interactions is to integrate ecological trait information into classical species distribution models (SDMs) analysis (Kearney and Porter, 2009). Integrated SDMs allow for a more comprehensive understanding of how species are impacted by environmental changes and how climate change contributes to the contraction of their distribution ranges, enabling comparisons of diversity variation across larger geographic regions and along environmental gradients (Ernst et al., 2012; Vilà-Cabrera et al., 2015). This approach is therefore superior to classical SDMs that rely solely on species occurrence data. This is because traits that reflect the physiological, morphological, and behavioral adaptations of species to their environment are better preserved over evolutionary time than distributional patterns (Wiens et al., 2010).
Although there are several studies that addressed the effects of human-induced changes on functional diversity, and despite the obvious value of understanding the spatial distribution of functional diversity at large scales, there are few studies that specifically address these large-scale patterns (Thuiller et al., 2006; Tsianou and Kallimanis, 2016). Trait-based measures can provide better predictions of disturbance impacts and ecosystem process due to the direct link between an organism's function and its ecological role within an ecosystem (Ernst et al., 2006; Naeem et al., 2012). Furthermore, these measures allow for detecting changes in biodiversity due to anthropogenic pressures before extinctions effectively occur (Mouillot et al., 2013). Trait plasticity under climate change scenarios has previously been addressed, however the spatial distribution of functional diversity has rarely been evaluated (Iverson et al., 2011; Lourenço-de-Moraes et al., 2019). Previous studies assessed the impact of climate change on tropical amphibians over large spatial scales, and in the few available studies for Atlantic Forest amphibians, the authors mainly focused on species richness patterns in the context of protected area efficiency (Loyola et al., 2013; Lemes et al., 2013; Vasconcelos et al., 2018).
In this study, our goal is to assess the potential effect of climate change on both taxonomic and functional richness of amphibian communities in the Brazilian Atlantic Forest using extended species distribution model approaches. We addressed three main questions: 1) Does climate change influence the spatial distribution of taxonomic and functional amphibian richness across our study biome? 2) Are predicted taxonomic and functional patterns identical across the different scenarios? 3) Do forest and open area species respond differently? We hypothesize that (1) Climate change will negatively influence both components of amphibian richness resulting in shrinking species’ ranges (Lourenço-de-Moraes et al., 2019). (2) Predicted distribution patterns will differ between different richness components and with respect to different change scenarios. We expect a more severe loss of functional trait richness in all climate scenarios, assuming that climate change driven losses are trait dependent (see Ernst et al., 2006; Naeem et al., 2012). (3) Forest-dwelling species will be more severely impacted because of their more complex habitat requirements and high sensitivity to habitat alteration (Storfer, 2018).
MethodsOccurrence data acquisitionTo obtain occurrence records (presence-only) for anuran species previously recorded within Atlantic Forest boundaries (Muylaert et al., 2018; Ribeiro et al., 2009), we performed a comprehensive database search (Table S1 - Supporting Information) including Web of Science, Scopus, Scielo and Google Scholar, using the following keywords and Boolean operator search criteria: “amphibian” AND “Atlantic Forest”, “anura” AND “Atlantic Forest”. We also searched for dissertations and theses in Google Scholar and libraries of several universities, as they represent a significant portion of Brazilian biodiversity inventories. We selected only papers that contained community data and excluded single species studies and natural history observations. We decided against using records from the global biodiversity information facility (GBIF) because these can introduce biases due to varying data quality and spatial coverage (Beck et al., 2014). Data errors and the lack of both harmonized data curation and comprehensive metadata pose additional challenges (Maldonado et al., 2015). In contrast, occurrence records from research papers undergo rigorous quality control and are collected with specific research objectives in mind. By combining data from various original sources, including papers, monographs, theses, and dissertations, we aimed at mitigating spatial biases, thereby achieving a more accurate understanding of species distributions. Our priority was to ensure accurate species identification rather than maximizing sample size.
The data covers a sampling period from 1940 to 2017. We assumed the correctness of species identification in the original source and proceeded to update the taxonomy based on Frost v. 6.0 (Frost, 2017), and Segalla et al. (2016). Any taxonomic uncertainties were excluded from the analysis, and synonymy problems were verified and standardized when possible. Amphibian taxonomy has undergone significant developments and revisions published during the sampling timeframe that are not considered here and may slightly affect the accuracy and precision of our species distribution models. We acknowledge that there is a possibility of misclassification or uncertainty in the taxonomic assignment of some occurrence records, particularly for species formerly considered to be widespread but now revealed to be cryptic complexes. This limitation introduces a level of uncertainty into our analyses, as it is not feasible to individually verify the taxonomic status of each record given the scale of our dataset. This can potentially result in underestimating actual impacts and will therefore have to be considered when interpreting recovered patterns and deriving conservation implications. The nomenclature of the updated list of valid species (Table S4) follows Frost v. 6.1 (Frost, 2023).
Out of 243 available studies that fulfilled the geographic boundary criterion, we extracted a total of 372 sample localities distributed across our focus area (Fig. 1). To ensure the accuracy of our models, we carefully reviewed the data obtained. To minimize potential coordinate errors, such as occurrences in municipality centroids or oceans, as well as to identify any obvious spatial errors, we cross-referenced the occurrence data using Google Earth. This allowed us to verify the accuracy of the geographic locations provided. Additionally, when necessary, we conducted field checks (ground truthing). To maintain consistency and avoid bias in our analysis, we used only one occurrence per species per pixel, with a resolution of 2.5 min. We also excluded repeated coordinates for each species. As the data represented a community of species, we filtered the occurrences for each individual species in all communities before creating separate species distribution models (SDMs). This resulted in an initial data set comprising 171 species and 6657 records. The number of single locality records for the species varied from 10 to 230 (average 39 records). We then matched species occurrences to available functional response trait data (for more details, see next section).
Functional response trait selection along the Brazilian Atlantic Forest (gray area).")
We used the established species occurrences to assign species-specific traits for subsequent functional analyses. We selected seven functional traits that are potentially affected by climate change to calculate functional trait richness (Henle et al., 2004; Table S2). All continuous traits (dimorphism, movement index, and mouth area; Table S3) are derived from independent measurements of male specimens/species (ranging from 6 to 20 individuals per species, totaling 129 species) from various locations within their respective distribution ranges in the study biome to account for variability. Vouchers used for morphometric data acquisition are deposited in the amphibian collection of the Universidade Estadual Paulista (UNESP), Rio Claro, SP. The remaining five categorical traits (activity, calling site, ecotype and reproduction habitat) were obtained from the literature (Haddad et al., 2013). SVLs (snout-vent length) of females, used to identify sexual size dimorphism, were also derived from the literature (Haddad et al., 2013). Because trait data was not equally available for all species, we restricted functional richness calculations to a subset of the samples, for which trait matrices were complete. The final dataset therefore included 109 species from 15 families, which represents 79% of the families of anurans found in the Atlantic Forest (Frost, 2023; Haddad et al., 2013; Table S4). Regarding the representativeness of species within each family, there was a wide variation. Some families, such as Aromobatidae and Ranidae, showed a high representativeness of 100%, while others, such as Hylodidae (6.5%) and Hemipractidae (7.1%), were poorly represented. The most abundant families in the Atlantic Forest, Hylidae and Leptodactylidae, were represented at 29.5% and 21.6%, respectively (Rossa-Feres et al., 2017).
Habitat preferences categorizationWe classified species into two broad categories of habitat preference based on published life history information and our own observations, according to the previously established classification scheme of Haddad et al. (2013). These categories were forest and open area species, as these broad habitat types represent the most contrasting habitat partitioning in our study area and the most obvious biotic response of the target taxa. Following Haddad et al. (2013), we consider open areas to be areas without trees. These can include both natural and man-made areas, such as forest clearings, natural or man-made grasslands, rocky fields, swamps, and ponds outside of forests. Thus, when we refer to open areas, they can be either natural or man-made, and species classified as open area species may have either evolved or occur in natural open habitats or have pre-adaptations that allow them to live in man-made open habitats (Lourenço-de-Moraes et al., 2020).
For model building, we assigned species known to occur in both open and closed forest habitats to both categories, resulting in redundant occurrences in both data sets. This approach better reflects the actual biological response plasticity of these species and thus the ecological characteristics of each anuran community. It is therefore less conservative than completely excluding these species from the datasets. In this way, we obtain a maximum ecological signal.
Climatic data acquisitionTo characterize climatic variability within the Atlantic Forest biome, we used 19 bioclimatic variables from the WorldClim database at a spatial resolution of 2.5 min (Hijmans et al., 2005). We employed a single projection for the present-day scenario, and four projections for the future, considering two temporal scenarios (2050 and 2070) and two warming climate scenarios, specifically Representative Concentration Pathway 4.5 (RCP 4.5: conservative-case scenario) and 8.5 (RCP 8.5: worst-case scenario). Consequently, we have a total of five scenarios, including one for the present-day and four for the future, for each component of diversity, which includes both taxonomic and functional richness (see sections 2.4 and 2.5 for further information). It's important to note that the present-day projections reflect the current climate conditions, while the future projections are based on the anticipated changes associated with the two warming climate scenarios. The RCP 4.5 scenario predicts a global temperature increase of 2.3 °C, while the RCP 8.5 scenario predicts a temperature increase of 4.8 °C. We used the General Circulation Models (GCMs) ACCESS1-0, developed as collaboration between CSIRO and BoM (Dix et al., 2013).
To avoid collinearity among the bioclimatic variables, we used a factorial analysis with varimax rotation to reduce dimensionality (“psych” package, R Development Core Team, 2014; Revelle, 2017). We then selected five non-correlated bioclimatic variables relevant to our organismic model group on grounds of its biology and ecophysiology (Wells, 2007): temperature seasonality (Bio4), mean temperature of the warmest quarter (Bio10), precipitation of wettest month (Bio13), precipitation seasonality (Bio15), and precipitation of driest quarter (Bio17).
Species distribution modelingTo predict the future distribution of taxonomic and functional anuran richness across the Atlantic Forest Biome with respect to the different climatic (RCP 4.5 and 8.5) and temporal (2050 and 2070) scenarios, we constructed species distribution models (SDMs) for each selected anuran species. In order to develop the SDMs, we used an ensemble forecast approach that combines different types of projections, constructed from various methods and conditions that yields more reliable predictions (Diniz-Filho et al., 2009). SDMs were constructed using four different algorithms. The first two algorithms employed presence-only methods: BIOCLIM, which is based on the envelope score method, and Domain, which utilizes the Gower distance method. The latter two algorithms utilized presence-background methods: MaxEnt, and Support Vector Machines (SVM), both of which are machine learning methods (Phillips and Dudík, 2008; Tax and Duin, 2004; Carpenter et al., 1993; Nix, 1986). The SDMs were modeled using “dismo” and “kernlab” R-packages (Hijmans et al., 2015; Karatzoglou et al., 2004).
We individually modeled each species using a two-fold partition approach, where 75% of the incidence data was used for training the models and 25% for testing. To evaluate the models, we used True Skill Statistics (TSS) (Allouche et al., 2006). Through bootstrap analysis, we randomized each procedure five times for each algorithm, resulting in 20 maps for each species (four algorithms multiplied by five times). We generated an ensemble by converting the 20 continuous maps into binary maps using the "maximum sensitivity and specificity" threshold recommended by Liu et al. (2016). To obtain the final species distribution maps, we overlapped the maps generated from the same algorithms as well as different algorithms. The final maps had cell values ranging from 0 to 20, representing the frequency at which each cell was predicted as suitable for each species by the model. This process was applied to model both the present-day and future spatial distribution (Fig. 2).
 and the generation of 20 maps per species through bootstrap analysis. Continuous maps were converted to binary maps using an ensemble approach. Final species distribution maps were obtained by overlapping maps from different algorithms. Displayed cell values represent suitability frequency. This workflow was applied to both present-day and future spatial distributions.")
Workflow of the main steps used for building present-day and future species distribution models for the Brazilian Atlantic Forest anurans. SDMs were built for each selected species using multiple algorithms. Evaluation of the models included True Skill Statistics (TSS) and the generation of 20 maps per species through bootstrap analysis. Continuous maps were converted to binary maps using an ensemble approach. Final species distribution maps were obtained by overlapping maps from different algorithms. Displayed cell values represent suitability frequency. This workflow was applied to both present-day and future spatial distributions.
To calculate taxonomic richness for each pixel of the Atlantic Forest biome, we again converted the ensembled or final maps into binary maps. This conversion was done using the Lowest Presence Threshold (LPT), which classifies each cell based on the lowest frequency at which the model predicted species occurrence (Pearson et al., 2007). We classified cells with values equal or higher than LPT as presence (value 1) and cells with lower values than LPT as absence (value 0). By summing these presence-absence maps of all species in a determined scenario, we generated the taxonomic richness map, in which the value of each cell represents its potential richness.
We then calculated the functional richness of each cell (pixel). To do that, we first converted the presence-absence maps into a matrix format. In this community matrix, each row represents a cell or pixel, and each column indicates the presence or absence of a specific species (0 or 1 values). Subsequently, we construct a dissimilarity matrix between species, whose values represent the dissimilarity between pairs of species based on functional traits. Since there were numerical and categorical traits, we used the Gower distance as the measure of dissimilarity, after transforming the categorical variables into fuzzy variables, as suggested by Pavoine et al. (2009), using the prep.fuzzy function from the ade4 package (Pavoine et al., 2009). Finally, we computed Functional Richness (FRic) using the FD package (Laliberté et al., 2014) by utilizing the community matrix and the dissimilarity matrix. FRic is a measure of functional diversity that quantifies the hypervolume in the multivariate trait space occupied by each community (Mouchet et al., 2010). To enable the comparison of FRic across scenarios, we adopted a simultaneous calculation approach. This involved aggregating the community matrices from each scenario into a single matrix. In this matrix, the columns represented the species, while the rows corresponded to the sum of cells from all five scenarios. By doing this, we were able to calculate FRic for all cells across scenarios collectively. To standardize FRic values, we utilized the concept of “global FRic.” This refers to a community that includes all species present in every scenario, and it is assigned a value of 1. By using this reference, we standardized the FRic values obtained from the different scenarios, allowing for meaningful comparisons between them. After calculating FRic, we separated the cells of each scenario and created a matrix of FRic for each scenario. These matrices were then used to construct maps of functional richness of each scenario, in which the value of each cell indicates the estimated functional richness (Fig. 2).
AnalysisTo assess for differences between the present-day distribution maps and the prediction maps of the four different scenarios of climate change, we used a Kruskal-Wallis test on two different temporal climatic scenarios (2050 and 2070) and two futures climatic warming scenarios (RCP 4.5 and RCP 8.5). The differences were assessed for each component of diversity (taxonomic and functional richness) and for the two amphibian functional groups (forest vs. open area species). Additionally, we compared the future prediction maps to the present-day distribution maps for each diversity component. We then performed a one-sample Wilcoxon Signed Rank test to determine if the difference between them is equal to zero. We performed all tests in the software R, version 3.0.1 (R Development Core Team, 2014). In the above analysis, we used each Atlantic Forest pixel.
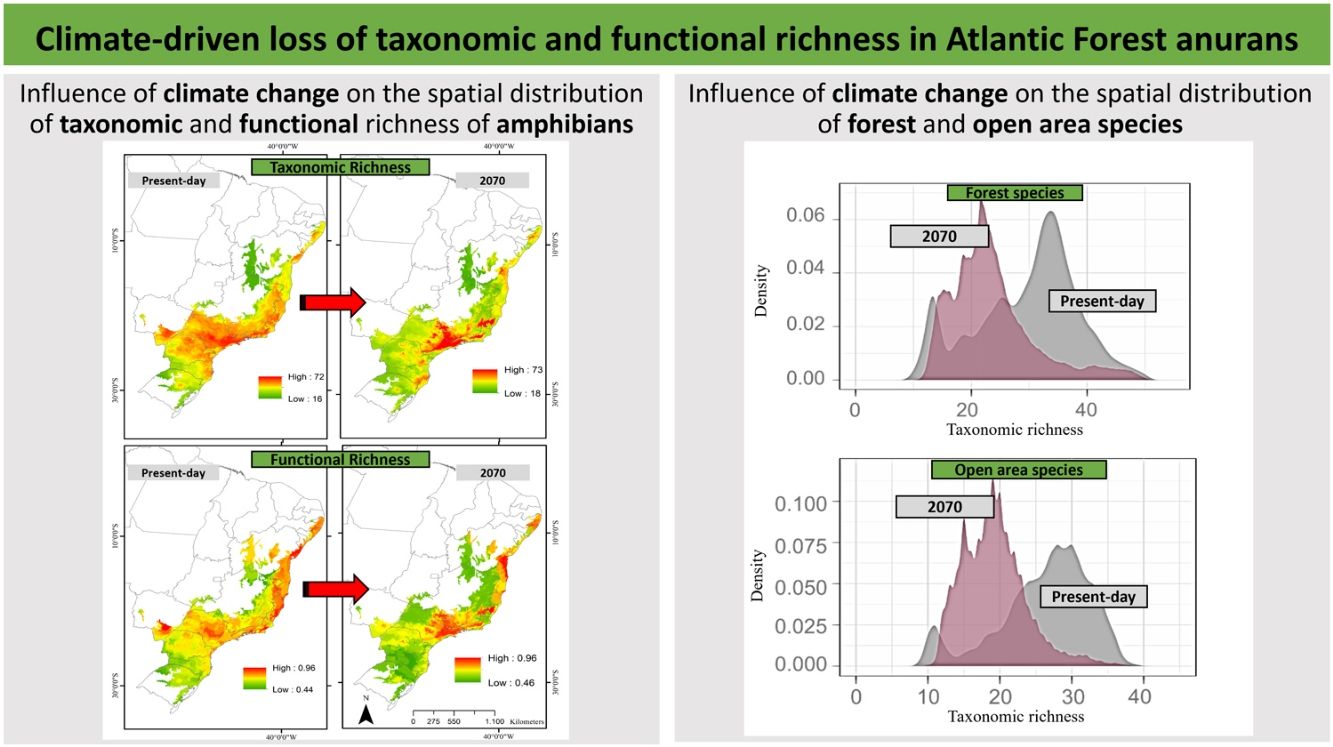
ResultsPredictive maps revealed a widespread multidimensional loss in the Brazilian Atlantic Forest in all evaluated scenarios. Status quo and most pessimistic scenarios for both richness components are given in Fig. 3. High functional and taxonomic richness can mainly be observed in the eastern parts of the Atlantic Forest (Fig. 3 A and C), with high-altitude regions being those areas in which highest species richness is to be expected in the future (Fig. 3B and 3D).
 and for the year 2070 (bottom panels) according to the most pessimistic scenarios of temperature increase (RCP 8.5). A. Present-day taxonomic richness. B. Taxonomic richness for 2070. C. Present-day Functional richness. D. Functional richness for 2070. The abbreviations on the map correspond to the states where the Atlantic Forest is distributed. AL: Alagoas, BA: Bahia, ES: Espírito Santo, GO: Goiás, MS: Mato Grosso do Sul, MG: Minas Gerais, PB: Paraíba, PR: Paraná, PE: Pernambuco, RJ: Rio de Janeiro, RN: Rio Grande do Norte, RS: Rio Grande do Sul, SC: Santa Catarina, SP: São Paulo, SE: Sergipe.")
Taxonomic and functional richness for Atlantic Forest amphibians for the present-day projection (upper panels) and for the year 2070 (bottom panels) according to the most pessimistic scenarios of temperature increase (RCP 8.5). A. Present-day taxonomic richness. B. Taxonomic richness for 2070. C. Present-day Functional richness. D. Functional richness for 2070. The abbreviations on the map correspond to the states where the Atlantic Forest is distributed. AL: Alagoas, BA: Bahia, ES: Espírito Santo, GO: Goiás, MS: Mato Grosso do Sul, MG: Minas Gerais, PB: Paraíba, PR: Paraná, PE: Pernambuco, RJ: Rio de Janeiro, RN: Rio Grande do Norte, RS: Rio Grande do Sul, SC: Santa Catarina, SP: São Paulo, SE: Sergipe.
Our findings suggest that all climate change scenarios likely result in significant losses in both taxonomic and functional richness, with taxonomic richness expected to decrease more severely than functional richness (Fig. 4 and 5). The most pessimistic scenario shows the most dramatic declines (Fig. 4). Although taxonomic and functional richness are positively correlated, they provide complementary information as they do not fully overlap (see Fig. S1).
 and prediction years (2050 and 2070). Gray panels = present-day estimates. Color panels = future predictions. Light color panels = non-overlapping values between present-day and future predictions. The x² value provides an indication of the magnitude of the observed differences, while the p-value assess the statistical significance of these observed differences.")
Taxonomic and functional richness frequency of Atlantic Forest amphibians according to scenarios of temperature increase (RCP 4.5: conservative-case scenario and RCP 8.5: worst-case scenario) and prediction years (2050 and 2070). Gray panels = present-day estimates. Color panels = future predictions. Light color panels = non-overlapping values between present-day and future predictions. The x² value provides an indication of the magnitude of the observed differences, while the p-value assess the statistical significance of these observed differences.
 and prediction years (2050 and 2070).")
In addition, taxonomic richness is predicted to decrease significantly for the two functional groups (forest and open area species) under all scenarios and with increasing temperature and variation of weather patterns. Contrary to expectations, there are no significant differences in the predicted losses between the functional groups (Fig. 6).
 and prediction years (2050 and 2070) for forest (upper panels) and open-area species (bottom panels). Gray panels = present-day estimates. Color panels = future predictions. Light color panels = non-overlapping values between present-day and future predictions. The x² value provides an indication of the magnitude of the observed differences, while the p-value assess the statistical significance of these observed differences.")
Taxonomic richness frequency of Atlantic Forest amphibians according to scenarios of temperature increase (RCP 4.5: conservative-case scenario and RCP 8.5: worst-case scenario) and prediction years (2050 and 2070) for forest (upper panels) and open-area species (bottom panels). Gray panels = present-day estimates. Color panels = future predictions. Light color panels = non-overlapping values between present-day and future predictions. The x² value provides an indication of the magnitude of the observed differences, while the p-value assess the statistical significance of these observed differences.
Global climate and land-use change are major drivers of worldwide biodiversity loss, and they significantly alter the spatial distribution of biodiversity across the globe (Sillero, 2021; VanDerWal et al., 2013). Climate change has been shown to affect different organisms or even distinct (functional) species groups within a given taxon differently (e.g., plants: Vogado et al., 2022; animals: Urban et al., 2013). Our findings indicate that climate change will have a dramatic negative effect on amphibian richness in the Atlantic Forest Biodiversity Hotspot of Brazil, regardless of the respective component or functional subgroups considered. The scenarios tested in this study indicate that there will even be significant losses of open area taxa, which are generally considered more resilient to severe climate change impacts, such as prolonged droughts or extreme temperatures, compared to closed forest taxa (Moss et al., 2021). This has tremendous effects on both taxonomic and functional richness and the spatial distribution of these biodiversity indicators across the large and heterogenous Atlantic Forest matrix (Campos et al., 2014).
Based on our projections, significant levels of taxonomic and functional richness will mainly be maintained in small habitat pockets located in the eastern coastal region and high-altitude habitats. Our findings pose a severe challenge for future biodiversity conservation planning. These are precisely the areas experiencing the highest interest in property speculation because of their close vicinity to the most developed urban and industrial centers in Brazil (Pinto and Hirota, 2022). The alarming rate at which potential biodiversity refugia (sensu Keppel et al., 2012) are being lost has raised concerns (Selwood and Zimmer, 2020). This is particularly worrisome considering the short latitudinal temperature gradient in tropical lowland regions, which allows for limited altitudinal range shifts (Colwell et al., 2008). Furthermore, the long-term survival of species may be jeopardized if they are unable to adapt or migrate to higher elevations (Forero-Medina et al., 2011). Elevation gradients of species richness are well-documented in various tropical regions, including southeastern Brazil (Sheldon et al., 2015; Lemes et al., 2013; Carnaval et al., 2009). However, climate change is expected to impose new boundaries for potential range shifts along the altitudinal gradient (Keppel et al., 2012).
The high-altitude region of the southeastern Atlantic Forest has previously been identified as potentially important refuge for species under climate change, including amphibians (Serra do Mar, the Central Corridor of the Atlantic Forest, and the high-altitude regions of Pernambuco state, Carnaval et al., 2009; Vasconcelos et al., 2018; Lourenço-de-Moraes et al., 2019). Apart from these commonly recognized sites, our models identify lesser-known climate refugia in the states of Espírito Santo and Minas Gerais, within the Serra da Mantiqueira and therefore support the findings of Lourenço-de-Moraes et al. (2019), although these authors considered different traits in their analyses (Tsianou and Kallimanis, 2016). In particular, our new findings identify biogeographic target sub-regions for priority conservation action that were previously recognized as centers of endemism for other taxonomic groups (birds, primates, and butterflies, Silva and Casteleti, 2005; harvestmen, DaSilva et al., 2017; snakes, Barbo et al., 2021), highlighting their importance for biodiversity conservation for a wide range of taxonomic groups.
While we found functional trait richness to be positively correlated with taxonomic richness, a common pattern in various taxa, taxonomic richness is projected to decline at a significantly faster rate than functional richness under climate change (Morelli et al., 2018; Gerisch et al., 2012). This pattern is particularly pronounced in the north-east of the Brazilian Atlantic Forest. A strong correlation between taxonomic and functional richness is considered as a sign of low functional redundancy (Guillemot et al., 2011), while high taxonomic richness at low functional richness levels is seen as an indication of high functional redundancy (Gerisch et al., 2012). Following this argumentation, the relationships and pattern changes observed in our study suggest an initial high level of functional redundancy. However, this redundancy decreases as a result of a strong climatic trait filter that selectively removes entire functional groups, rather than individual species (compare Ernst et al., 2012). Previously assumed insurance effects will therefore become ineffective (compare also Eklöf et al., 2012).
Whereas climate filters, such as prolonged droughts and higher temperatures, are thought to eliminate species with inadequate pre-adaptations to climate change, e.g. small-bodied anurans that are more susceptible to moisture loss and desiccation (Ashton, 2001), and allow for the establishment of better-adapted species, biodiversity losses may also follow trait-based extinctions not related to climate change adaptability or extinctions due to stochastic demographic events (Mouillot et al., 2013). Based on our analyses and results, it is not possible to distinguish the specific effects of climate change from other factors leading to biodiversity loss, such as land use changes and habitat destruction. This requires sophisticated analyses and models that account for complex interactions and potential synergies (see Hölting et al., 2016; Fox et al., 2014). In fact, the negative impacts of climate change on species diversity may be exacerbated by habitat loss and fragmentation caused by agricultural development, urbanization, and economic mobility (Newbold et al., 2014). Few studies have examined these synergies, but evidence suggests that severely fragmented landscapes can limit range expansion under climate change (Warren et al., 2001).
Climate change has previously been shown to favor habitat generalist species often those associated with open area habitats (Hirschfeld and Rödel, 2017). These species are usually widespread and tolerate an extensive range of extreme abiotic factors, with high adaptability and behavioral plasticity allowing them to efficiently explore even human-modified habitats (Hirschfeld and Rödel, 2017; Nowakowski et al., 2017). Although particular functional trait groups (e.g., small bodied, microendemic, and narrow elevational distribution species) are frequently more prone to climate change driven extinctions than others (Lourenço-de-Moraes et al., 2020; Hirschfeld and Rödel, 2017; Ashton, 2001), our observations show that the division does not follow these previously assumed differences in coarse habitat specialization (forest vs. open area species).
Clearly, the initial selection of functional traits strongly influences the respective model results (Tsianou and Kallimanis, 2016). For example, research on thermal tolerance has shown that even sympatric and closely related anuran species may have different local and regional distribution patterns due to their unique behavioral thermal tolerance, which is reflected in their small-scale habitat preferences (Díaz-Ricaurte et al., 2020). This highlights the need for excellent ecological and biological knowledge of the particular taxonomic groups under study, which should include natural history observations in the field. Unfortunately, macroecological modeling studies too often rely on data mining using prebuilt databases without adequately considering the biological validity of the data. Additionally, these databases often suffer from patchiness and numerous zero entries, which can be attributed to the nature of data collection methods, such as labor-intensive morphometric assessments or limited availability of specimens. Therefore, although we made an effort to select a diverse and relevant set of traits following selection criteria outlined by Keller et al. (2023) and ensured a thorough acquisition of available and verified occurrence data while aiming at maximizing amphibian family coverage, results should be interpreted with the necessary precaution. A bias can still be introduced through incomplete representation of functional traits that potentially respond to changes in weather patterns, as well as gaps in species occurrences in our dataset.
Even though closed forest specialists are assumed to have a higher climate-change driven extinction risk, we could not corroborate this pattern for Atlantic Forest amphibian communities (Trimble and Van Aarde, 2015). In our system, both open area and closed-forest species seem to be affected equally. Our findings thus highlight the need for a landscape approach to biodiversity conservation in heterogenous landscapes under climate change (Kleinschroth et al., 2016). This corroborates previous studies, which addressed land-use change effects on biodiversity, advocating the protection of pristine forest fragments and their surrounding disturbed open area matrix as interacting and interdependent units (Brüning et al., 2018).
ConclusionsWith both taxonomic and functional richness of Atlantic rainforest anurans expected to decline dramatically in the coming decades under current climate scenarios, effective conservation actions aimed at conserving diversity and halting this dramatic biodiversity loss require dynamic approaches rather than static “business as usual” strategies. For the Brazilian Atlantic Forest this means that conservation priority should not only be given to already existing and previously identified local diversity hotspots but also to potentially important climatic refuges.
This is especially true when considering different descriptors of biodiversity, such as taxonomic and functional richness. Here, our study highlights the importance of high-altitude habitats as potential refuges that should receive increased attention for conservation. As we found climate driven amphibian richness loss to be trait-based but not simply correlated to coarse habitat preferences (open area vs. closed forest species), we advocate landscape approaches including even previously disturbed habitat matrices, as they may contain significant diversity proportions (compare Brüning et al., 2018).
Additionally, it is crucial to recognize that solely focusing on conservation actions aimed at protecting potential refuges and high-altitude habitats may not be sufficient to effectively mitigate the impacts of climate change on amphibian biodiversity. It is imperative that we also address the root cause of the problem, which is climate change itself. While identifying and protecting climatic refuges is a valuable approach, it should be complemented by efforts aimed at achieving more restrictive and generally agreed climate targets.
Incorporating trait information into modified species distribution models can serve as a valuable tool for predicting and designing dynamic conservation strategies, as well as informing decisions related to ecosystem management (Wittmann et al., 2016). Such an approach can help identify areas that are likely to be important for maintaining functional diversity under changing climatic conditions. Future trait-based model approaches should also consider the synergistic effects of climate change and land-use change, shedding light on the role of habitat modification in biodiversity loss and ecosystem functioning. Additionally, to better understand the impacts of climate change, it is important for future trait-based studies to investigate which functional traits are most vulnerable and likely to be lost in the future.
By adopting a multifaceted approach that combines the identification of refuges, efforts to achieve strict climate targets, and the integration of trait-based models, we can develop comprehensive and effective conservation strategies that safeguard amphibian biodiversity in the face of climate change.
Declaration of competing interestThe authors declare that they have no conflict of interest.
We thank all farmers and landowners that generously supported the fieldwork. We particularly thank R. Souza, C. Loiola and B. Vitorino for assistance during expert surveys. We also extend our gratitude to N. Alecrim, K. Duarte, D. B. Delgado, and L. Gabriela for their essential contributions to measuring the amphibian morphological traits, and to N. C. Pupin and D. P. B. Costa for their assistance with the collection matters. Additionally, our thanks go to C.F.B. Haddad for making the collection available. PRA was supported by the Coordenação de Aperfeiçoamento de Pessoal de Nível Superior – Brazil (CAPES) – Finance Code 001 and by Programa de Doutorado Sanduíche no Exterior (PDSE - #88881.134118/2016-01). MHV thanks São Paulo Research Foundation (FAPESP), grants #2013/02883-7, #2017/09676-8 and <gn3> #2022/01899-6</gn3>. PRA thanks L. S. M. Sugai for the English language review and for comments on the manuscript. PRA also thanks the Alexander von Humboldt Foundation for the postdoctoral fellowship. MCR thanks to the Sao Paulo Research Foundation - FAPESP (processes #2013/50421-2; #2020/01779-5; #2021/08322-3; #2021/08534-0; #2021/10195-0; #2021/10639-5; #2022/10760-1), National Council for Scientific and Technological Development - CNPq (processes #442147/2020-1; #440145/2022-8; #402765/2021-4; #313016/2021-6; #440145/2022-8), and Sao Paulo State University - UNESP for their financial support. This study is also part of the Center for Research on Biodiversity Dynamics and Climate Change, which is financed by the Sao Paulo Research Foundation - FAPESP. Finally, we thank the two anonymous reviewers who provided very insightful suggestions.
The following are Supplementary data to this article:


