


Southern South America is projected to experience increased heavy rainfall due to global climate change. These extremes events should be more common and affect negatively both human well-being and biodiversity. Here, we studied the effects of the massive flooding in May 2024 on biodiversity. We showed that 4,300 km2 of native ecosystems were inundated, including 1,200 km2 of forests and 1,020 km2 of grasslands. Aquatic ecosystems, wetlands, and costal vegetation on sandy soils were also affected. Flooding affected 825 km2 of an insufficiently Protected Area (PA) network, impacting 17% of areas designated for sustainable use and 26% of strictly PAs. Similarly, 1,440 km2 of Permanent Preservation Areas (PPAs) were flooded, with 67% already lacking native vegetation. The flooding potentially affected 747 tetrapod species, including 84 threatened species, with amphibians and reptiles exhibiting the highest percentage of distribution affected. Threatened species were disproportionately affected by the flooding, especially amphibians, reptiles, and mammals. Therefore, restoration efforts, especially in PAs and PPAs, are critical to safeguard ecosystems and human communities in a world of rapid changes. Tetrapod species with reduced mobility, small-ranged species and threatened species should also be prioritized.

Climate change is no longer a future concern but a pressing reality with consequences already underway. The disrupted weather patterns have led to an increased frequency and intensity of extreme weather events such as heatwaves, droughts, fires, extreme rainfall, floods, and landslides (IPCC, 2021). Biodiversity is extremely affected, with documented changes in ecosystem structure, species range shifts and phenology (IPCC, 2022). Across Brazil, temperatures are expected to rise 3 °C–6 °C by 2100, according to consensual projection (Souza et al., 2014). The northern Brazilian region is expected to become much drier, which has already led to extreme fire events (Pivello et al., 2021). Conversely, the southern Brazilian region is projected to experience increased precipitation, up to 35% more rainfall by 2100 (Souza et al., 2014). Extreme rainfall events cause floodings and landslides, inundating and destroying habitats, disrupting breeding cycles, and altering food webs (Piniewski et al., 2017; Zhang et al., 2021).
In southern Brazil, increases in precipitation have already been observed. Precipitation between 1991 and 2000 was higher than the previous 48 years in the Taquari River Valley (Tognoli et al., 2021). The heavy rainfall event and associated flooding that occurred in May 2024 were the most severe ever recorded in the state of Rio Grande do Sul (Pillar and Overbeck, 2024) and it followed two smaller floodings in 2023 (Alvalá et al., 2024). The heavy rainfall in May 2024 affected more than 90% of the state's area, displaced hundreds of thousands of people, and caused 171 deaths (Marengo et al., 2024). According to Collischonn et al. (2024), rainfall between April and May 2024 in Rio Grande do Sul surpassed all previously recorded large-scale precipitation events in Brazil from 1961 to 2022, with some areas receiving 47% more rain than any past record. This extreme event not only broke historical records but also revealed critical weaknesses in flood defense infrastructure, especially in the state’s capital, Porto Alegre. This extreme event serves as a severe reminder of the vulnerability of both ecosystems and human well-being to a changing climate.
The affected area encompasses two biomes: Atlantic Forest and Pampa. They are the most threatened biomes in Brazil (Overbeck et al., 2015). Native vegetation comprises 36.3% of the original area in the Atlantic Forest (Vancine et al., 2024) and about 45% in the Pampa (Baeza et al., 2022). Therefore, native ecosystems and their biodiversity in the affected area were already severely threatened. From 1985 to 2022, the Brazilian Pampa lost 32% of its natural area, mostly for agriculture, especially soybean croplands (RAD MapBiomas Report, 2024). This massive flooding likely left these scarce natural remnants in an even worse situation, as flooding severely impacts biodiversity (Zhang et al., 2021). Furthermore, lack of native vegetation certainly worsened the catastrophic flooding we witnessed (Manes et al., 2024), highlighting a critical feedback loop, where the degradation of native vegetation increases vulnerability to extreme events, which in turn further erode the resilience of already endangered ecosystems.
Tetrapod species (amphibians, reptiles, birds, and mammals) occupy several trophic levels and play key roles in ecosystem functioning, contributing to essential services such as seed dispersal, pollination, nutrient cycling, and pest control (IPBES, 2019; Vale et al., 2023). In Rio Grande do Sul, 155 species of tetrapods are currently listed as threatened (Rio Grande do Sul, 2014). The main threats are habitat loss and degradation, invasive species, hunting, roadkill and an extreme limited system of protected areas (Santos et al., 2015; Lima et al., 2021; Laufer et al., 2022). Thus, native ecosystems and their biodiversity were already severely threatened before the flooding. Therefore, the flooding may have acted synergistically with these previous threats and directly impacting tetrapod populations. Some tetrapod species, such as ground-dwelling amphibians and burrowing mammals, might be particularly sensitive to flooding (Zhang et al., 2021). Given the ecological importance of tetrapods, their relatively well-known distributions compared to other taxonomic groups with range maps that are often used in conservation studies (Harfoot et al., 2021), we focus on this group to assess the potential impacts of the 2024 extreme flooding event on biodiversity, particularly on the remaining native vegetation, Permanent Preservation Areas (PPAs), Protected Areas (PAs), and tetrapod species distributions.
Material and methodsStudy areaOur analyses focused on the portion of the South Atlantic watershed that lies within Rio Grande do Sul state (RS), hereafter referred as SA-RS, covering approximately 141,700 km2 and 50% of the state area (Fig. 1). The SA-RS encompasses an ecotone area between the Atlantic Forest and Pampa, and it harbours several native vegetation types, including forests, grasslands, wetlands, and costal vegetation on sandy soils (restingas). This region is intensively used for agriculture, including croplands, forestry, and livestock (Rezende et al., 2018; Baeza et al., 2022).
, Brazil, with its remaining native vegetation, Protected Areas, and the flooded area in May 2024.")
Using climate historical data available from the WorldClim database (Fick and Hijmans, 2017; https://www.worldclim.org), we calculated the historical mean annual precipitation and the historical May precipitation in the SA-RS for comparison to the observed precipitation in May 2024. The mean annual precipitation is 1,508 ± 179 mm (mean ± standard deviation) and the mean May precipitation is 115 ± 16 mm. In May 2024, this region experienced an extraordinary heavy rainfall. Porto Alegre recorded 536 mm, and other cities reached 845 mm (INMET, 2024).
Flooded AreaThe map of the flooded areas was generated using two datasets: one for the Guaíba hydrographic region (Possantti et al., 2024) and the other for the Patos hydrographic region (Silva et al., 2024). For the Guaíba hydrographic region, we used the area directly affected on the peak day, May 6, 2024 (GIS layer: analise_ada_inundacao_20240506). As similar data were not available for the Patos hydrographic region, we used a simulation of inundated areas considering a flood quota of 2.73 m (GIS layer: SIG_inundacao_cota273), which is slightly below the measurements made on the peak day at this region, May 16, 2024. This estimate of the flooded area indicated that over 9,800 km² in the SA-RS were directly affected.
Ecosystems, Permanent Preservation Areas (PPAs) and Protected Areas (PAs)We used land cover maps (MapBiomas, 2023, Collection 8) to assess which vegetation types, hereafter referred to as ecosystems, were most impacted by the flooding. We overlapped the distribution of these ecosystems with the flooded area map.
Brazilian Native Vegetation Protection Law (Brazil, 2012) demands that native vegetation must be kept on special areas (especially at water bodies margins and areas with slopes exceeding 45 °) – the Permanent Preservation Areas (PPAs). Following this law requirements, we created an estimated PPAs map for both waterbody margins and areas with a slope exceeding 45 ° using a hydrography map from Hasenack and Weber (2010) and the ANADEM Digital Terrain Model (Laipelt et al., 2024).
For rivers, the PPA ranges from 30 to 500 meters from river margins, depending on river width. Therefore, we measured widths of the main rivers in the SA-RS: Taquari, Sinos, Jacuí, Vacacaí, Vacacaí-Mirim, Pardo, Antas, Caí, Gravataí, Camaquã, and Mampituba. Measurements were taken every two kilometers, starting from the headwaters to the river mouth, continuously changing PPA size in accordance with river width. For all other rivers, a standard 30-meter buffer was applied for PPA estimation. For natural lakes, PPAs of 100 meters were assigned to lakes larger than 20 hectares, while 50 meters were assigned to smaller lakes. These PPA estimates adhered solely to the general rule of the Native Vegetation Protection Law, excluding the transitional provisions outlined in Chapter XIII, which offer mitigations primarily for small rural properties. This PPAs map was overlaid with the flooded area and with the ecosystem maps to identify which PPAs areas were directly affected by the flooding and whether they preserved their natural cover, in accordance with the legal requirements.
Apart from PPAs, Brazilian legislation establishes Protected Areas (PAs) through the National System of Protected Areas (Brazil, 2000). These PAs are legally designated, have defined boundaries, and are established to conserve nature and ensure the sustainable use of natural resources. Data on PAs was obtained at National Register of Conservation Units – CNUC.
Tetrapod analysisWe analysed which tetrapod species (amphibians, reptiles, birds, and mammals) were potentially affected by the flooding through spatial analysis. We obtained distribution range maps for amphibians and reptiles from the IUCN Red List database (IUCN, 2024), for birds from the BirdLife International and Handbook of the Birds of the World (2023), and for mammals from Marsh et al. (2022). Marine species (e.g., turtles and whales) and exotic species were excluded. For birds, only resident and breeding ranges were considered.
To identify species potentially affected by the flooding, we overlapped species distribution range maps with flood extent. A spatial intersection determined the area within each species' range affected by the flooding. The percentage of species distribution affected by the flooding was then computed as the ratio of the affected area to the total distribution area of each species. All spatial operations were performed using the sf package (Pebesma and Bivand, 2023).
We calculated the proportion of species that were potentially affected by the flooding in relation to all species of each group occurring in the RS and in the SA-RS to estimate the impact on the tetrapod diversity. We also calculated this proportion in relation to the number of threatened species in the RS (Rio Grande do Sul, 2014) that were potentially affected by the flooding. For this analysis, we considered only the categories Vulnerable (VU), Endangered (EN), and Critically Endangered (CR). The categories Near Threatened (NT) and Data Deficient (DD) were considered as non-threatened. Since the red list of threatened species in the RS was published ten years ago, we also considered the IUCN Red List, classifying a species as threatened based on the higher threat level from either list.
Statistical analysesTo assess how the percentage of affected area of species distribution varied among taxonomic groups and between threatened and non-threatened species, we selected only those species that had more than 0.1% of their distributions affected by the flooding and we run a one-way analysis of variance (ANOVA), followed by a Tukey test for comparison between groups. Furthermore, we used a generalized linear model (GLM) to assess if the percentage of species distribution affected by the flooding was related to species conservation status, i.e., varied between threatened and non-threatened species. For this analysis, we ran four GLMs, one for each taxonomic group and one GLM including all species. For amphibians and reptiles, we assembled all species, since there are few species considered threatened in each group, which we called herpetofauna. Since the data is right skewed, we used GLM with an inverse gaussian family. Additionally, we also compared species richness between flooded and unflooded areas for each group using one-way ANOVA (see results in Supplementary Material). All analyses were run in the R environment, version 4.1.3 (R Core Team, 2022).
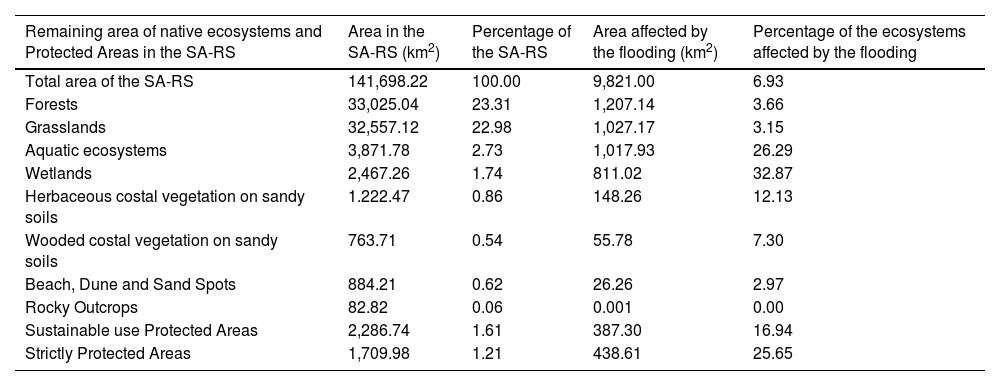
ResultsThe flooded area comprises approximately 7% of the SA-RS, impacting all ecosystems under investigation. Forests and grasslands were the most affected. However, wetlands, aquatic ecosystems, and herbaceous and wooded costal vegetation on sandy soils were disproportionately impacted when considering their original area. Additionally, both sustainable use and strictly PAs were highly affected (Table 1).
Native ecosystems and Protected Areas occurrence and their areas affected by the flooding of May 2024 in the South Atlantic watershed within Rio Grande do Sul state (SA-RS), Brazil.
| Remaining area of native ecosystems and Protected Areas in the SA-RS | Area in the SA-RS (km2) | Percentage of the SA-RS | Area affected by the flooding (km2) | Percentage of the ecosystems affected by the flooding |
|---|---|---|---|---|
| Total area of the SA-RS | 141,698.22 | 100.00 | 9,821.00 | 6.93 |
| Forests | 33,025.04 | 23.31 | 1,207.14 | 3.66 |
| Grasslands | 32,557.12 | 22.98 | 1,027.17 | 3.15 |
| Aquatic ecosystems | 3,871.78 | 2.73 | 1,017.93 | 26.29 |
| Wetlands | 2,467.26 | 1.74 | 811.02 | 32.87 |
| Herbaceous costal vegetation on sandy soils | 1.222.47 | 0.86 | 148.26 | 12.13 |
| Wooded costal vegetation on sandy soils | 763.71 | 0.54 | 55.78 | 7.30 |
| Beach, Dune and Sand Spots | 884.21 | 0.62 | 26.26 | 2.97 |
| Rocky Outcrops | 82.82 | 0.06 | 0.001 | 0.00 |
| Sustainable use Protected Areas | 2,286.74 | 1.61 | 387.30 | 16.94 |
| Strictly Protected Areas | 1,709.98 | 1.21 | 438.61 | 25.65 |
Data from 2022 land cover map of MapBiomas project, Collection 8 (MapBiomas, 2023). The flooded area map was obtained from Possantti et al. (2024) and Silva et al. (2024).
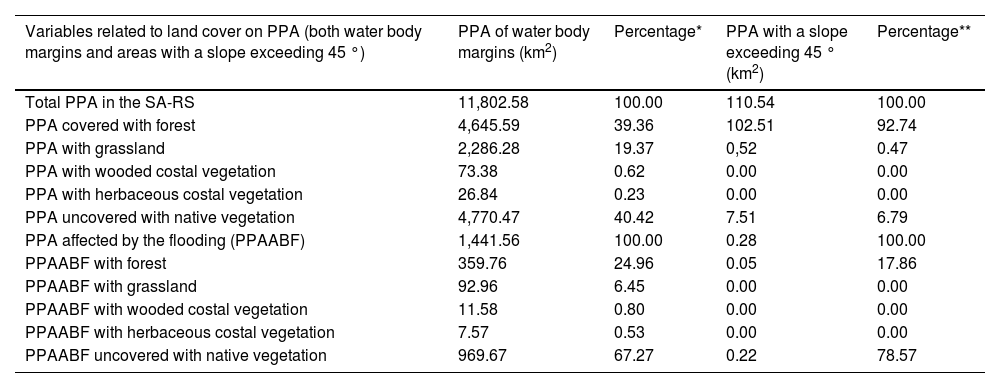
The estimated PPAs in the SA-RS cover 11,900 km2, with over 1,470 km2 (12.35% of the total PPAs) affected by the flooding. When considering only the PPAs adjacent to water body margins, 39.36% lack native vegetation cover when considering the entire SA-RS. However, when analysing the area affected by the flooding, the area not covered by native vegetation increases to 67.27%. In contrast, for the PPAs on slopes exceeding 45 °, native vegetation is lacking in 17.86% within the entire SA-RS. However, when considering the area affected by the flooding, the area no covered by native vegetation increases to alarming 78.57% (Table 2).
Permanent Preservation Areas (PPAs – both water body margins and areas with a slope exceeding 45 °) considering their area affected by the flooding of May 2024 and whether they preserved their native vegetation, in accordance with the legal requirements in the South Atlantic watershed within Rio Grande do Sul state (SA-RS), Brazil.
| Variables related to land cover on PPA (both water body margins and areas with a slope exceeding 45 °) | PPA of water body margins (km2) | Percentage* | PPA with a slope exceeding 45 ° (km2) | Percentage** |
|---|---|---|---|---|
| Total PPA in the SA-RS | 11,802.58 | 100.00 | 110.54 | 100.00 |
| PPA covered with forest | 4,645.59 | 39.36 | 102.51 | 92.74 |
| PPA with grassland | 2,286.28 | 19.37 | 0,52 | 0.47 |
| PPA with wooded costal vegetation | 73.38 | 0.62 | 0.00 | 0.00 |
| PPA with herbaceous costal vegetation | 26.84 | 0.23 | 0.00 | 0.00 |
| PPA uncovered with native vegetation | 4,770.47 | 40.42 | 7.51 | 6.79 |
| PPA affected by the flooding (PPAABF) | 1,441.56 | 100.00 | 0.28 | 100.00 |
| PPAABF with forest | 359.76 | 24.96 | 0.05 | 17.86 |
| PPAABF with grassland | 92.96 | 6.45 | 0.00 | 0.00 |
| PPAABF with wooded costal vegetation | 11.58 | 0.80 | 0.00 | 0.00 |
| PPAABF with herbaceous costal vegetation | 7.57 | 0.53 | 0.00 | 0.00 |
| PPAABF uncovered with native vegetation | 969.67 | 67.27 | 0.22 | 78.57 |
Data from 2022 land cover map of MapBiomas project, Collection 8 (MapBiomas, 2023). The flooded area map was obtained from Possantti et al. (2024) and Silva et al. (2024).
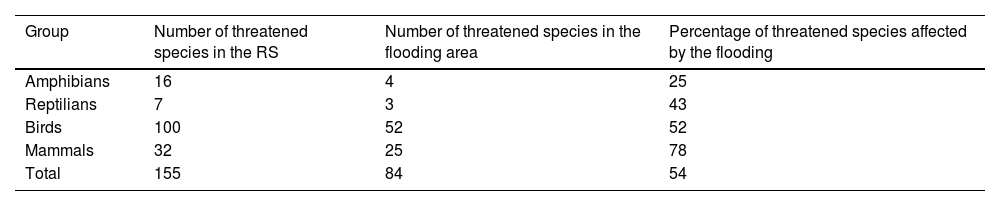
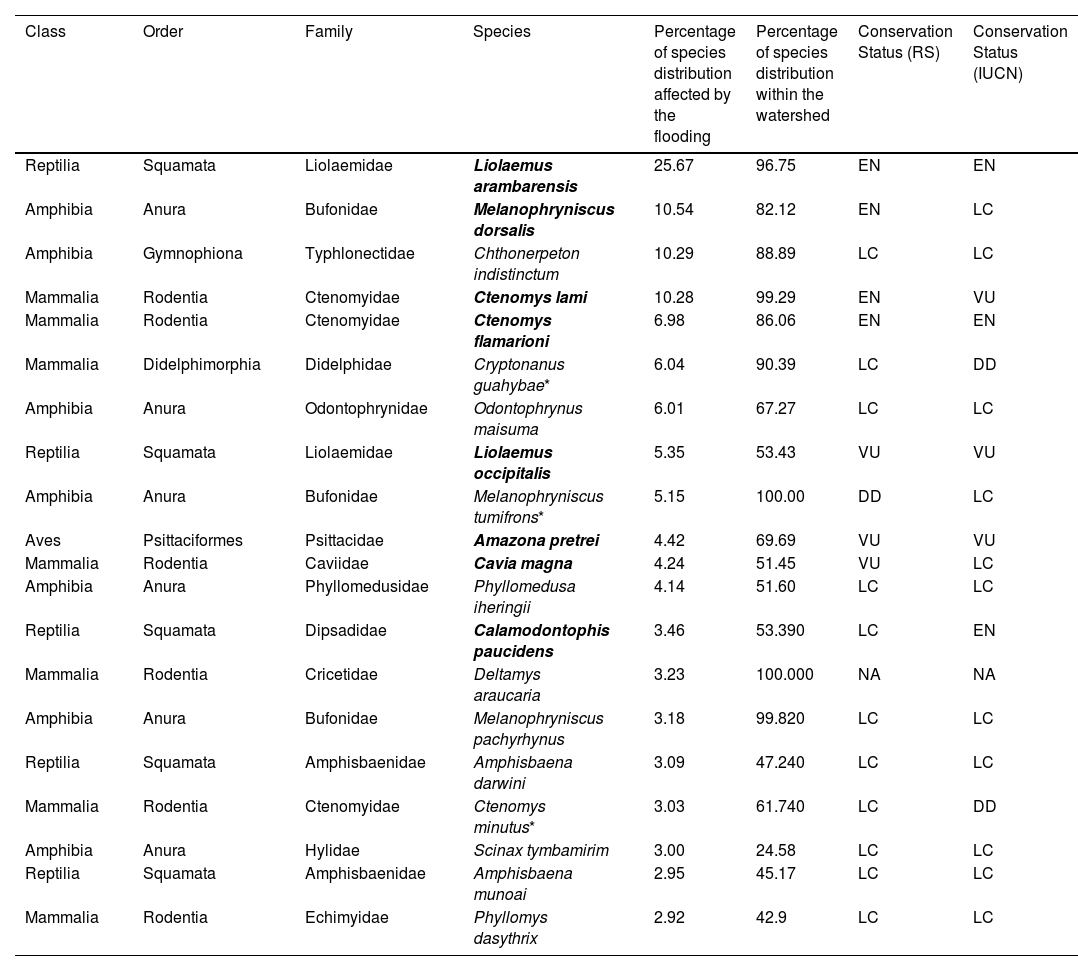
This extensive flooding affected a significant portion of the native tetrapod fauna (Fig. 2), encompassing 747 species (74 amphibians, 88 reptiles, 461 birds, and 124 mammals). This represents at least 70% of all tetrapod species with occurrence in RS and more than 85% of all tetrapod species occurring in the SA-RS. Considering the threatened species in the RS, mammals were the most potentially affected group by the flooding, followed by birds, reptiles, and amphibians, respectively (Table 3). However, when we ranked the species by the proportion of affected area, the potentially most affected species was the sand-dune lizard Liolaemus arambarensis, which had 25% of its distribution within the flooding area. It was followed by the redbelly toad Melanophryniscus dorsalis, the Argentinian caecilian Chthonerpeton indistinctum, and the tuco-tuco Ctenomys lami, all of which had ca. 10% of their ranges affected by the flooding (Table 4; Table S1).
, Brazil.")
Bar plot showing the percentage of species potentially affected by the flooding in the Rio Grande do Sul state in May 2024. Dark blue bars represent the percentage of species potentially affected in relation to all species occurring in the Rio Grande do Sul state and green bars represent the percentage of species potentially affected in relation to all species occurring in the South Atlantic watershed within Rio Grande do Sul state (SA-RS), Brazil.
Number of threatened species in the Rio Grande do Sul state (RS), number of threatened species in the flooding area, and percentage of threatened species potentially affected by the flooding in May 2024. Number of species in each region was obtained from overlapping distribution range maps (see details in the Tetrapod Analysis section). Marine species were excluded.
| Group | Number of threatened species in the RS | Number of threatened species in the flooding area | Percentage of threatened species affected by the flooding |
|---|---|---|---|
| Amphibians | 16 | 4 | 25 |
| Reptilians | 7 | 3 | 43 |
| Birds | 100 | 52 | 52 |
| Mammals | 32 | 25 | 78 |
| Total | 155 | 84 | 54 |
The twenty top-ranked tetrapod species potentially affected by the flooding in May 2024, in the Rio Grande do Sul state. Species names in bold are threatened species.
| Class | Order | Family | Species | Percentage of species distribution affected by the flooding | Percentage of species distribution within the watershed | Conservation Status (RS) | Conservation Status (IUCN) |
|---|---|---|---|---|---|---|---|
| Reptilia | Squamata | Liolaemidae | Liolaemus arambarensis | 25.67 | 96.75 | EN | EN |
| Amphibia | Anura | Bufonidae | Melanophryniscus dorsalis | 10.54 | 82.12 | EN | LC |
| Amphibia | Gymnophiona | Typhlonectidae | Chthonerpeton indistinctum | 10.29 | 88.89 | LC | LC |
| Mammalia | Rodentia | Ctenomyidae | Ctenomys lami | 10.28 | 99.29 | EN | VU |
| Mammalia | Rodentia | Ctenomyidae | Ctenomys flamarioni | 6.98 | 86.06 | EN | EN |
| Mammalia | Didelphimorphia | Didelphidae | Cryptonanus guahybae* | 6.04 | 90.39 | LC | DD |
| Amphibia | Anura | Odontophrynidae | Odontophrynus maisuma | 6.01 | 67.27 | LC | LC |
| Reptilia | Squamata | Liolaemidae | Liolaemus occipitalis | 5.35 | 53.43 | VU | VU |
| Amphibia | Anura | Bufonidae | Melanophryniscus tumifrons* | 5.15 | 100.00 | DD | LC |
| Aves | Psittaciformes | Psittacidae | Amazona pretrei | 4.42 | 69.69 | VU | VU |
| Mammalia | Rodentia | Caviidae | Cavia magna | 4.24 | 51.45 | VU | LC |
| Amphibia | Anura | Phyllomedusidae | Phyllomedusa iheringii | 4.14 | 51.60 | LC | LC |
| Reptilia | Squamata | Dipsadidae | Calamodontophis paucidens | 3.46 | 53.390 | LC | EN |
| Mammalia | Rodentia | Cricetidae | Deltamys araucaria | 3.23 | 100.000 | NA | NA |
| Amphibia | Anura | Bufonidae | Melanophryniscus pachyrhynus | 3.18 | 99.820 | LC | LC |
| Reptilia | Squamata | Amphisbaenidae | Amphisbaena darwini | 3.09 | 47.240 | LC | LC |
| Mammalia | Rodentia | Ctenomyidae | Ctenomys minutus* | 3.03 | 61.740 | LC | DD |
| Amphibia | Anura | Hylidae | Scinax tymbamirim | 3.00 | 24.58 | LC | LC |
| Reptilia | Squamata | Amphisbaenidae | Amphisbaena munoai | 2.95 | 45.17 | LC | LC |
| Mammalia | Rodentia | Echimyidae | Phyllomys dasythrix | 2.92 | 42.9 | LC | LC |
RS = Rio Grande do Sul, IUCN = International Union for Conservation of Nature, EN = Endangered, LC = Least Concern, VU = Vulnerable, NA = Not Assessed. SA-RS = South Atlantic watershed within Rio Grande do Sul state.
On average, species had 0.48 ± 1.35% of their distributions potentially affected by the flooding. However, the magnitude of this effect was different among groups. Amphibians and reptiles exhibited the highest percentage of distribution affected by the flooding, followed by mammals and birds, respectively (Fig. S1). There was statistical difference in the mean percentage of distribution affected by the flooding among groups (F = 10.26, P < 0.0001), where amphibians (1.49 ± 2.13%) and reptiles (1.29 ± 3.28%) were potentially more affected than mammals (1.04 ± 1.77%) and birds (0.42 ± 0.46%).
Considering their conservation status, overall, threatened species were more potentially affected by the flooding than non-threatened species (Fig. 3). On average, threatened species had twice the percentage of their distributions affected by the flooding than non-threatened species (estimate = −2.29, P < 0.0001). This pattern was followed by the herpetofauna and mammals (estimate = −0.91, P < 0.001; estimate = −1.55, P = 0.03; respectively), but not for birds (estimate = −2.19, P = 0.26).
, bottom-left plot includes birds, and bottom-right plot includes mammals. The mean of percentage of species distribution affected by the flooding was significantly higher for threatened species than for non-threatened species for all species (P < 0.0001), herpetofauna (P = 0.0002), and mammals (P = 0.026). Only birds did not exhibit statistical difference in the mean percentage of species distribution affected by the flooding between threatened and non-threatened species (P = 0.26). Different letters indicate statistical difference in mean of the percentage of species distribution affected by the flooding for threatened and non-threatened species (P < 0.05). Whiskers indicate standard error.")
Bar plot showing the mean percentage of species distribution affected by the flooding for threatened and non-threatened species. Top-left plot includes all tetrapod species, top-right plot includes species from the herpetofauna (amphibians and reptiles), bottom-left plot includes birds, and bottom-right plot includes mammals. The mean of percentage of species distribution affected by the flooding was significantly higher for threatened species than for non-threatened species for all species (P < 0.0001), herpetofauna (P = 0.0002), and mammals (P = 0.026). Only birds did not exhibit statistical difference in the mean percentage of species distribution affected by the flooding between threatened and non-threatened species (P = 0.26). Different letters indicate statistical difference in mean of the percentage of species distribution affected by the flooding for threatened and non-threatened species (P < 0.05). Whiskers indicate standard error.
We present here an estimate of the potential impacts of a major flood event on biodiversity, incorporating vegetation maps and tetrapod species distributions. The results are alarming: nearly 4,300 km2 of native ecosystems were flooded, including large portions of the already limited PA network. A worrisome finding is that 67% of the PPAs in the flooded area, i.e., areas that are legally required to maintain their native vegetation, already were without native vegetation prior to the flooding. This situation underlines the high vulnerability of the anthropized landscapes to events of heavy rainfall and their consequences, such as floodings and landslides. Considering wildlife, 747 tetrapod species were potentially affected, including 84 threatened species. Furthermore, threatened species were potentially more affected by the flooding than non-threatened species. Therefore, in addition to the well-documented catastrophic socioeconomic impacts, this major flooding may have impacted biodiversity significantly as well.
Ecosystems and Protected Areas (PAs)Our results revealed that at least 1,200 km2 of forests and 1,020 km2 of grasslands were flooded. Proportionally, the most affected ecosystems were wetlands, locally called banhados, aquatic ecosystems and costal vegetation on sandy soils. Native vegetation in the SA-RS covers approximately 50% of its original extent, with only 2.8% located within a PA. Total affected area of native ecosystems, ca. 4,300 km2, is larger than all the PAs in the SA-RS, which cover about 4,000 km2. This already limited network of PAs was also highly impacted, with 25.7% of strict PAs and 16.9% of sustainable use PAs flooded. This represents more than 825 km2 of PAs directly impacted by the flooding. The extent of this impact highlights the urgent need to restore ecosystems in areas that had already lost most of its native vegetation (Strassburg et al., 2020) and to expand the PA network in underrepresented areas (Lima et al., 2020; Malecha et al., 2023), incorporating climatic risk scenarios into conservation planning (Nguyen et al., 2022).
Permanent Preservation Areas (PPAs)PPAs are mandatory to maintain their natural vegetation and aim to preserve water resources, landscapes, geological stability, biodiversity, and soil quality, thereby ensuring the well-being of human populations (Brazil, 2012). However, we showed that 40% of the PPA related to water body margins had already lost their original cover within the SA-RS. This number rises to 67% when considering the PPA directly affected by the flooding. PPA related to areas with slopes exceeding 45 ° are in an even worse situation. Despite 93% of these PPAs on the SA-RS preserving their natural cover, those directly affected by the flooding had already lost about 80% of their natural vegetation, increasing landslide risks. Maintaining and restoring native vegetation is a nature-based solution with high efficiency in diminishing flooding risks after extreme rainfall events (Manes et al., 2024). While native vegetation in all the landscape is important for mitigating the effects of rainfall, the importance of PPAs is even higher, because they designed to protect areas of higher vulnerability. Therefore, it is imperative to prioritize the conservation and restoration of PPAs to safeguard ecosystems and human communities. This preservation should be reinforced into national and regional legislations. However, recent legislative changes in the RS indicate otherwise. The recently reviewed Environmental Code of Rio Grande do Sul (Rio Grande do Sul, 2020) significantly weakened natural vegetation protection (Ferraz et al., 2024). At the national level, despite the general rule mandating the preservation of PPAs, the transitional provisions of the same law ease these requirements in many situations (Brazil, 2012), weakening the protection of these vulnerable areas. Further than legislative requirements, carbon market could provide a financial support to small landowners for maintaining natural vegetation on PPAs (Evans, 2018; Dutra et al., 2024) and should be implemented on flooding vulnerable areas.
Tetrapod speciesA high number of species were potentially affected by this major flooding, representing 85% of the tetrapod species in the SA-RS. However, as IUCN range maps might underestimate the complete species' geographical range (Pineda and Lobo, 2012), the number of affected species might be even larger. Amphibians and reptiles had the highest percentage of their distributions affected. Furthermore, amphibians and reptiles are considered the most vulnerable to flooding due to their specific habitat requirements and low mobility (Zhang et al., 2021). Specially, the endangered lizard Liolaemus arambarensis, who lives in coastal sand dunes, was the most affected species. Mammals and birds, in general, are considered more resilient due to their higher mobility. However, they still may face significant challenges related to reproduction areas and resource depletion. Additionally, higher mobility is not true for all birds and mammals. For instance, affected populations of tuco-tucos (Ctenomys), which have burrowing lifestyle, with three species among the top-ranked affected species, may have suffered high mortality rates, exacerbating their conservation status in the future. Noteworthy, other burrowing animals were potentially affected, such as caecilians and cavies. These results are concerning because extreme events have already caused tetrapod’s extinctions, especially for small-ranged species (Lips, 2018). Almost all top-ranked affected species are small-ranged, aggravating the flooding impact on their conservation status. Worrisomely, threatened species were disproportionately affected by the flooding, especially amphibians, reptiles, and mammals. Eighty-four threatened species were potentially affected, and the percentage of their distribution affected was twice as large as that of non-threatened species. These findings emphasize the urgent need for targeted conservation efforts to protect species small-ranged, with low mobility and that are already threatened from the increasing frequency and intensity of floodings.
Concluding remarksUnfortunately, all climate models indicate that many regions of the world will face extreme rainfall and, therefore, major flooding events in the decades to come (IPCC, 2021). The SA-RS experienced its largest flooding ever recorded, and the impacts on biodiversity are massive, in addition to socioeconomic impacts. To prevent effects of future extreme rainfall events, it is imperative to promote native vegetation restauration, especially in the PPAs and PAs. To mitigate the effects of this flooding, many initiatives are necessary. Both traditional and nature-based solutions can be applied to mitigate flooding caused by extreme events. Under traditional solutions, sustainable technologies (e.g., permeable pavements) and gray infrastructures (e.g., ditches and culverts) have positive impacts both ecologically and socially. However, nature-based solutions, such as urban parks, rain gardens, and green infrastructure, most effectively attenuate flooding hazards (Prado et al., 2024). More importantly, maintaining and restoring native vegetation is key to diminish flooding risks and landslides (Manes et al., 2024).
In addition to emergency funding to rebuild infrastructures adapted to extreme events, it is necessary to promote funding for ecosystems and habitat restoration, especially for (i) amphibians and reptiles, (ii) tetrapod species with reduced mobility, (iii) small-ranged species, and (iv) threatened species. Additionally, special grants should be promoted to further research on: (i) the effects of this flooding on aquatic ecosystems, (ii) the stability of the affected ecosystems post-disaster with resilience and resistance measures, and (iii) fieldwork to evaluate the effects of this flooding on biodiversity in situ, especially for the top-ranked affected species.
We emphasize that our estimations are based on pre-disaster species distribution data, and we did not account for potential range contractions, mortality estimates, or habitat loss resulting directly from the flooding. However, using range maps is a first approximation to obtain the magnitude of this extreme event. Therefore, future studies should include post-disaster surveys and monitoring programs to evaluate population trends, particularly for threatened species. Standardized populational monitoring, using techniques such as mark-recapture, camera traps, acoustic monitoring, and eDNA, can provide critical data on species persistence, recolonization potential, and habitat use after extreme events. Long-term ecological studies will also be essential to understand delayed impacts and ecosystem recovery trajectories. Here we focused only on tetrapod species, but fishes, plants and invertebrates were likely to be impacted by the flooding as well. Generating such data is vital for building more accurate impact models and informing conservation and restoration priorities under increasing climate variability.
The authors declare that they have no conflicts of interest that could inappropriately influence this research.
We are grateful to Lucas Piovesan who made the graphical abstract. FLS received a fellowship from the National Council for Scientific and Technological Development (CNPq, Grant ID: 141113/2021-9) and ‘Doutorado Nota 10’ Grant from Fundação de Amparo à Pesquisa do Estado do Rio de Janeiro (FAPERJ, Grant no. E-26/203.035/2023). MMW thanks the Financiadora de Estudos e Projetos (FINEP) for financial support (MCT/FINEP/CTINFRA-CAMPI REGIONAIS-01/2010).
During the preparation of this work the authors used ChatGPT, a language model developed by OpenAI, and Bard, a large language model from Google AI, to improve language and readability in some parts of the text. After using this tool, the authors reviewed and edited the content as needed and take full responsibility for the content of the publication.
The following are Supplementary data to this article:

