


Ecological niche models (ENMs) are often used to investigate how climatic variables from known occurrence records can estimate potential species range distribution. Although climate-based ENMs provide critical baseline information, the inclusion of non-climatic predictors related to vegetation cover might generate more realistic scenarios. This assumption is particularly relevant for species with life-history traits related to forest habitats and sensitive to habitat loss and fragmentation. Here, we developed ENMs for 36 Atlantic Forest endemic birds considering two sets of predictor variables: (i) climatic variables only and (ii) climatic variables combined with the percentage of remaining native vegetation. We hypothesized that the inclusion of native vegetation data would decrease the potential range distribution of forest-dependent species by limiting their occurrence in regions harboring small areas of native vegetation habitats, despite otherwise favorable climatic conditions. We also expected that habitat restriction in the climate–vegetation models would be more pronounced for highly forest-dependent birds. The inclusion of vegetation data in the modeling procedures restricted the final distribution ranges of 22 out of 36 modeled species, while the 14 remaining presented an expansion of their ranges. We observed that species with high and medium forest dependency showed higher restriction in range size predictions between predictor sets than species with low forest dependency, which showed no alteration or range expansion. Overall, our results suggest that ENMs based on climatic and landscape variables may be a useful tool for conservationists to better understand the dynamic of bird species distributions in threatened and highly fragmented regions such as the Atlantic Forest hotspot.
In the last three decades, ecological niche models (hereafter ENMs, sensuPeterson and Soberón, 2012) have been widely used to generate predictions of environmental suitability for species based on the association between known species occurrences and environmental conditions of the sites where species occurrences have been recorded (Araújo and Peterson, 2012). Assuming that climate is the main factor influencing species distribution at large spatial extents and coarse data resolutions, most ENM studies on species range limits have focused on determining species’ climatic requirements based on a multivariate space of climatic variables (i.e. bioclimatic envelope), and leaving aside the effects of non-climatic drivers (Pearson et al., 2004; Araújo and Peterson, 2012). However, the inclusion of non-climatic variables such as changes in vegetation cover (Pearson et al., 2004; Reino et al., 2013; Vasconcelos and Doro, 2016), and land use (Luoto et al., 2007; Newbold, 2018), can improve the accuracy of ENMs by including variables that are ecologically relevant (but see Thuiller et al., 2004). The combined effects of land-use and climate change by 2070 are predicted to lead to an average cumulative loss of 37.9% of species from vertebrate communities under current policies (Newbold, 2018). Although ENMs including non-climatic variables seem to be a useful tool to shed light on the potential localities where viable populations of the target species are likely to be maintained, a paucity of studies has used it to predict habitat suitability for endemic species with distinct degrees of habitat dependency (e.g. Marini et al., 2009).
Tropical forests house over half of Earth’s biodiversity and are among the world’s most threatened terrestrial ecosystems (Malhi et al., 2014). Loss and fragmentation of natural habitats lead to the reduction of resources and landscape connectivity, and increase edge effects that jointly affect species dispersal, colonization, and extinction (Fahrig, 2003; Gaston et al., 2003; Warren et al., 2001; Fischer and Lindenmayer, 2007). The Brazilian Atlantic Forest, a global biodiversity hotspot, has ∼72% of its original area converted for human use or degraded by anthropogenic activities (Rezende et al., 2018). Currently, more than 80% of the Brazilian Atlantic Forest fragments are <50 ha and protected areas encompass only 9% of the remaining forest (Ribeiro et al., 2009). At the same time, this region harbors 832 bird species, of which ∼26% are endemic (BirdLife International, 2018; Hasui et al., 2018; Vale et al., 2018b), and highly sensitive to habitat loss and fragmentation (Uezu et al., 2005; Anjos, 2006; Martensen et al., 2008, 2012). Reductions in bird diversity are due in large part to the loss of less resilient species (i.e. the capacity of a population to recover from disturbance), such as large-bodied species and trophic specialists (e.g. Uezu et al., 2005; Anjos, 2006), and an increase in stress-tolerant species typical of open areas (Ribon et al., 2003; Martensen et al., 2008, 2012). Although these studies have shown that habitat loss and fragmentation constrain bird species distributions at both local and regional scales, the extent to which the effects of habitat loss constrain species distributions on broad scales (i.e., the geographic limits of species; Orme et al., 2006) remain poorly explored for regions other than Europe (e.g. Pearson et al., 2004; Thuiller et al., 2004; Luoto et al., 2007; Trivinõ et al., 2011; Reino et al., 2013, 2018).
Here, we evaluate how the addition of native vegetation cover into climate-based ENMs affects the potential distribution ranges of 36 Atlantic Forest endemic bird species with distinct degrees of forest dependency (Stotz et al., 1996; BirdLife International, 2018). The forest dependency concept indicates whether a species tends to occupy: (i) well-preserved habitats in different strata of native forest formations, exhibiting high dependency; (ii) forest edges and understory environments, exhibiting medium dependency; or (iii) anthropogenic mosaics and non-forested landscapes, exhibiting low dependency. This concept is highly correlated to species sensitivity to disturbance reflecting how often a species is associated with disturbed or well-preserved forest patches (Stotz et al., 1996; Alexandrino et al., 2016) and can be used to link the results of ENMs to species’ ecological needs (Marini et al., 2009). We performed individual ENMs for each bird species considering two sets of variables: (i) climatic variables only (hereafter climate-only model); and (ii) climatic variables combined with the percentage of native vegetation remnants (hereafter climate–vegetation model). We hypothesize that the addition of the vegetation predictor would decrease the predicted range size of forest-dependent species by limiting their predicted occurrence in regions harboring small areas of native vegetation habitats, despite otherwise favorable climatic conditions. We also expect that the importance of the vegetation predictor would be more pronounced for highly forest-dependent birds. Understanding the association between species habitat dependency and model accuracy is useful to improve conservation planning based on species habitat requirements and habitat specificity (Marini et al., 2009). Therefore, we expect that habitat suitability forecasting generated by integrative models might be a valuable tool to understand the potential effects of the loss and fragmentation of natural habitats on the distribution of endemic bird species in the Atlantic Forest.
Material and methodsSpecies dataWe used occurrence points of endemic bird species distributed in 16.599 10 × 10 km resolution UTM cells encompassing the Brazilian Atlantic Forest (domain limits established by the Brazilian Ministry of Environment and the Brazilian Institute for Geography and Statistics; Fig. 1). This resolution is the most relevant for detecting the influence of land cover in ENMs (Luoto et al., 2007). Occurrence points per species were compiled from two different databases: (i) data set on Brazilian Atlantic Forest bird occurrence (Hasui et al., 2018); and (ii) Global Biodiversity Information Facility (https://www.gbif.org/). We removed from our data: (i) duplicate occurrence points; (ii) occurrence points in Argentina and Paraguay because the vegetation layer used herein is restricted to Brazil; (iii) imprecise point occurrences (e.g. coordinates assigned to municipalities); and (iv) historical points (i.e. records before 1990, therefore, we evaluated point occurrences from 1990 to 2017). Based on this curated data, we selected 36 endemic bird species (Table 1) following two main criteria: (i) species should have at least 60 georeferenced occurrence points available; and (ii) to eliminate phylogenetic bias, species should be preferably from different orders and families. In the end, our final dataset contains 2160 occurrence points. We classified species according to their forest dependency (high, medium, and low) based on information gathered from BirdLife International (2018) and complemented by consultation with experts (Table 1). From the 36 species evaluated in this study, eight were classified as low, 18 as medium, and 10 as high forest dependency (Table 1). We followed the updated list of the South American Classification Committee of the American Ornithological Society (http://www.museum.lsu.edu/~Remsen/SACCBaseline.htm) for bird nomenclature.
. Brazilian Atlantic Forest established by the Brazilian Ministry of Environment (MMA) and the Brazilian Institute for Geography and Statistics (IBGE). Grid resolution of ∼10 km.")
Percentage of vegetation cover in the Brazilian Atlantic Forest remaining in 2018 (available at http://mapas.sosma.org.br/dados/). Brazilian Atlantic Forest established by the Brazilian Ministry of Environment (MMA) and the Brazilian Institute for Geography and Statistics (IBGE). Grid resolution of ∼10 km.
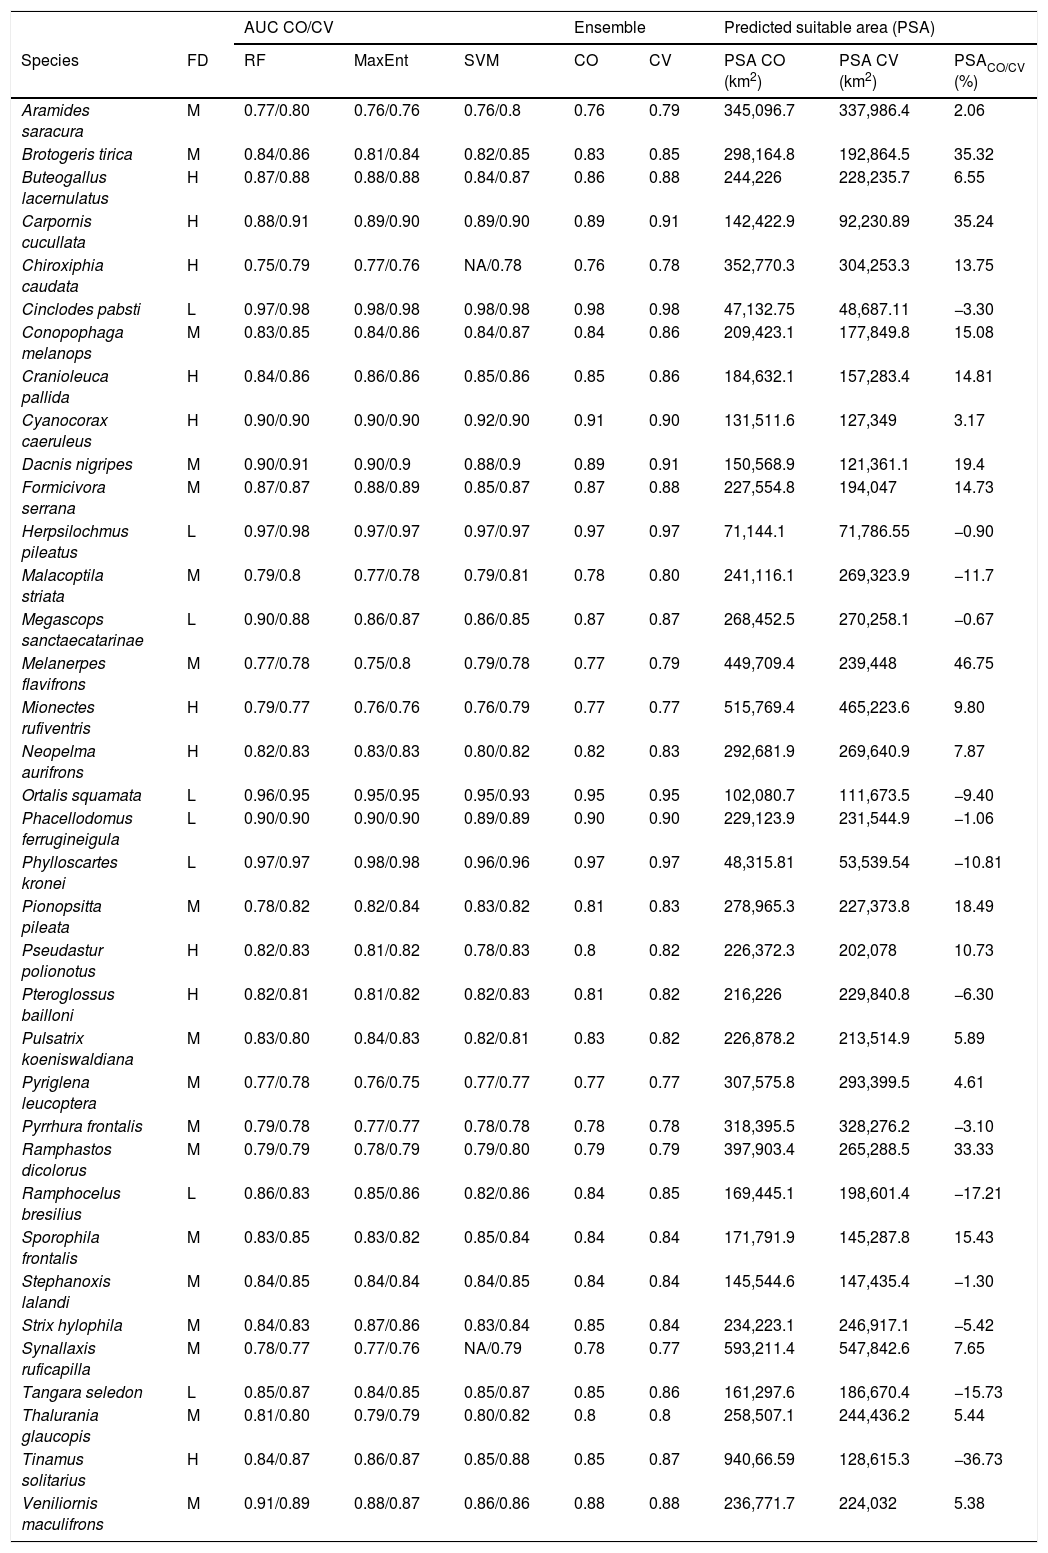
Area under the curve (AUC) values for each algorithm considering climate-only (CO) and climate–vegetation (CV) models. Abbreviations are as follows. FD – forest dependency (BirdLife International, 2018): L = low, M = medium, and H = high. RF – RandomForest, MaxEnt – Maximum Entropy, and SVM – Support Vector Machines. NA = not available (discarded models - AUC < 0.75). PSA CO – Predicted suitable area by climate-only model, and PSA CV – Predicted suitable area by climate–vegetation model. PSACO/CV (%) – Percentage of the predicted suitable area of climate-only models relative to climate–vegetation models (PSA CV). Positive PSACO/CV indicates a larger predicted suitable area of climate-only model, negative PSACO/CV indicates a larger predicted suitable area of climate–vegetation model.
| AUC CO/CV | Ensemble | Predicted suitable area (PSA) | |||||||
|---|---|---|---|---|---|---|---|---|---|
| Species | FD | RF | MaxEnt | SVM | CO | CV | PSA CO (km2) | PSA CV (km2) | PSACO/CV (%) |
| Aramides saracura | M | 0.77/0.80 | 0.76/0.76 | 0.76/0.8 | 0.76 | 0.79 | 345,096.7 | 337,986.4 | 2.06 |
| Brotogeris tirica | M | 0.84/0.86 | 0.81/0.84 | 0.82/0.85 | 0.83 | 0.85 | 298,164.8 | 192,864.5 | 35.32 |
| Buteogallus lacernulatus | H | 0.87/0.88 | 0.88/0.88 | 0.84/0.87 | 0.86 | 0.88 | 244,226 | 228,235.7 | 6.55 |
| Carpornis cucullata | H | 0.88/0.91 | 0.89/0.90 | 0.89/0.90 | 0.89 | 0.91 | 142,422.9 | 92,230.89 | 35.24 |
| Chiroxiphia caudata | H | 0.75/0.79 | 0.77/0.76 | NA/0.78 | 0.76 | 0.78 | 352,770.3 | 304,253.3 | 13.75 |
| Cinclodes pabsti | L | 0.97/0.98 | 0.98/0.98 | 0.98/0.98 | 0.98 | 0.98 | 47,132.75 | 48,687.11 | −3.30 |
| Conopophaga melanops | M | 0.83/0.85 | 0.84/0.86 | 0.84/0.87 | 0.84 | 0.86 | 209,423.1 | 177,849.8 | 15.08 |
| Cranioleuca pallida | H | 0.84/0.86 | 0.86/0.86 | 0.85/0.86 | 0.85 | 0.86 | 184,632.1 | 157,283.4 | 14.81 |
| Cyanocorax caeruleus | H | 0.90/0.90 | 0.90/0.90 | 0.92/0.90 | 0.91 | 0.90 | 131,511.6 | 127,349 | 3.17 |
| Dacnis nigripes | M | 0.90/0.91 | 0.90/0.9 | 0.88/0.9 | 0.89 | 0.91 | 150,568.9 | 121,361.1 | 19.4 |
| Formicivora serrana | M | 0.87/0.87 | 0.88/0.89 | 0.85/0.87 | 0.87 | 0.88 | 227,554.8 | 194,047 | 14.73 |
| Herpsilochmus pileatus | L | 0.97/0.98 | 0.97/0.97 | 0.97/0.97 | 0.97 | 0.97 | 71,144.1 | 71,786.55 | −0.90 |
| Malacoptila striata | M | 0.79/0.8 | 0.77/0.78 | 0.79/0.81 | 0.78 | 0.80 | 241,116.1 | 269,323.9 | −11.7 |
| Megascops sanctaecatarinae | L | 0.90/0.88 | 0.86/0.87 | 0.86/0.85 | 0.87 | 0.87 | 268,452.5 | 270,258.1 | −0.67 |
| Melanerpes flavifrons | M | 0.77/0.78 | 0.75/0.8 | 0.79/0.78 | 0.77 | 0.79 | 449,709.4 | 239,448 | 46.75 |
| Mionectes rufiventris | H | 0.79/0.77 | 0.76/0.76 | 0.76/0.79 | 0.77 | 0.77 | 515,769.4 | 465,223.6 | 9.80 |
| Neopelma aurifrons | H | 0.82/0.83 | 0.83/0.83 | 0.80/0.82 | 0.82 | 0.83 | 292,681.9 | 269,640.9 | 7.87 |
| Ortalis squamata | L | 0.96/0.95 | 0.95/0.95 | 0.95/0.93 | 0.95 | 0.95 | 102,080.7 | 111,673.5 | −9.40 |
| Phacellodomus ferrugineigula | L | 0.90/0.90 | 0.90/0.90 | 0.89/0.89 | 0.90 | 0.90 | 229,123.9 | 231,544.9 | −1.06 |
| Phylloscartes kronei | L | 0.97/0.97 | 0.98/0.98 | 0.96/0.96 | 0.97 | 0.97 | 48,315.81 | 53,539.54 | −10.81 |
| Pionopsitta pileata | M | 0.78/0.82 | 0.82/0.84 | 0.83/0.82 | 0.81 | 0.83 | 278,965.3 | 227,373.8 | 18.49 |
| Pseudastur polionotus | H | 0.82/0.83 | 0.81/0.82 | 0.78/0.83 | 0.8 | 0.82 | 226,372.3 | 202,078 | 10.73 |
| Pteroglossus bailloni | H | 0.82/0.81 | 0.81/0.82 | 0.82/0.83 | 0.81 | 0.82 | 216,226 | 229,840.8 | −6.30 |
| Pulsatrix koeniswaldiana | M | 0.83/0.80 | 0.84/0.83 | 0.82/0.81 | 0.83 | 0.82 | 226,878.2 | 213,514.9 | 5.89 |
| Pyriglena leucoptera | M | 0.77/0.78 | 0.76/0.75 | 0.77/0.77 | 0.77 | 0.77 | 307,575.8 | 293,399.5 | 4.61 |
| Pyrrhura frontalis | M | 0.79/0.78 | 0.77/0.77 | 0.78/0.78 | 0.78 | 0.78 | 318,395.5 | 328,276.2 | −3.10 |
| Ramphastos dicolorus | M | 0.79/0.79 | 0.78/0.79 | 0.79/0.80 | 0.79 | 0.79 | 397,903.4 | 265,288.5 | 33.33 |
| Ramphocelus bresilius | L | 0.86/0.83 | 0.85/0.86 | 0.82/0.86 | 0.84 | 0.85 | 169,445.1 | 198,601.4 | −17.21 |
| Sporophila frontalis | M | 0.83/0.85 | 0.83/0.82 | 0.85/0.84 | 0.84 | 0.84 | 171,791.9 | 145,287.8 | 15.43 |
| Stephanoxis lalandi | M | 0.84/0.85 | 0.84/0.84 | 0.84/0.85 | 0.84 | 0.84 | 145,544.6 | 147,435.4 | −1.30 |
| Strix hylophila | M | 0.84/0.83 | 0.87/0.86 | 0.83/0.84 | 0.85 | 0.84 | 234,223.1 | 246,917.1 | −5.42 |
| Synallaxis ruficapilla | M | 0.78/0.77 | 0.77/0.76 | NA/0.79 | 0.78 | 0.77 | 593,211.4 | 547,842.6 | 7.65 |
| Tangara seledon | L | 0.85/0.87 | 0.84/0.85 | 0.85/0.87 | 0.85 | 0.86 | 161,297.6 | 186,670.4 | −15.73 |
| Thalurania glaucopis | M | 0.81/0.80 | 0.79/0.79 | 0.80/0.82 | 0.8 | 0.8 | 258,507.1 | 244,436.2 | 5.44 |
| Tinamus solitarius | H | 0.84/0.87 | 0.86/0.87 | 0.85/0.88 | 0.85 | 0.87 | 940,66.59 | 128,615.3 | −36.73 |
| Veniliornis maculifrons | M | 0.91/0.89 | 0.88/0.87 | 0.86/0.86 | 0.88 | 0.88 | 236,771.7 | 224,032 | 5.38 |
We selected climatic variables related to temperature and precipitation that represent proxies for physiological constraints and limit species distribution for birds at broad spatial scales (e.g. Marini et al., 2009; Trivinõ et al., 2011), and capture both the annual and the seasonal characteristics of the Brazilian Atlantic Forest climatic variations (Oliveira-Filho and Fontes, 2000). We downloaded six bioclimatic variables from the WorldClim 2.0 database (Fick and Hijmans, 2017), at a 5.0 arc-minute spatial resolution: (i) temperature seasonality (bio4); (ii) maximum temperature of the warmest month (bio5); (iii) temperature annual range (bio7); (iv) annual precipitation (bio12); (v) precipitation seasonality (bio15); and (vi) precipitation of the driest quarter (bio17). We applied a Pearson’s correlation test to check for multicollinearity among the bioclimatic variables. We removed bio17 from subsequent analyses due to its high correlation with bio12 (r = 0.75) and bio15 (r = −0.94), and maintained other climatic variables which correlation ranged from −0.7 to 0.7, indicating a low influence of multicollinearity (Dormann et al., 2013; Fig. S1).
Percentage of native vegetation coverWe downloaded a shapefile containing information on the total native vegetation area remaining in 2018 in the Brazilian Atlantic Forest (http://mapas.sosma.org.br/dados/). The native vegetation area in the shapefile was delimited based on orbital images from the sensor OLI/Landsat 8 at a scale of 1:50,000 (SOS Mata Atlântica and INPE, 2020). To use the percentage of native vegetation cover in ENMs, we converted the shapefile into a grid file and raster format considering the same resolution used in this study (Fig. 1).
Ecological niche modelingAll models were built in R v. 4.0 (R Development Core Team, 2020) using the SSDM R package (Schmitt et al., 2017). We performed six models (i.e. three climate-only models and three climate–vegetation models) for each species using the following methods: (i) RF – RandomForest, (ii) MaxEnt – Maximum Entropy, and iii) SVM – Support Vector Machines. We used the default settings from SSDM package (Schmitt et al., 2017) that determines: (i) RF model with 2500 trees, a minimum size of terminal nodes equal one, and the same number of randomly created pseudo-absences as available presences (Barbet-Massin et al., 2012); (ii) MaxEnt model fitted on presence-only data and 10,000 randomly generated pseudo-absence points; and (iii) SVM model with the epsilon parameter in the insensitive loss function equal 1e-08, three-fold cross-validation on the training data to assess the quality of the model, and the same number of randomly created pseudo-absences as available presences. We evaluated predictive performance using the area under curve (AUC) of the receiver operating characteristic (ROC) (Fielding and Bell, 1997). The AUC (ranging from 0 to 1) represents the probability that, for a randomly selected set of observations, the model prediction for a presence observation will be higher than the prediction for an absence observation. AUC values of 0.5 represent a model no better than random, whereas a value of 1 indicates perfect model discrimination between presence and absence records. We used average of AUC using threefold cross-validation (two times in the training set and once the evaluation set), repeated ten times, which gives a more robust estimate of the predictive performance of each model. We excluded from subsequent analyses those models with poor performance represented by AUC lower than 0.75 because they are not discriminatory enough to be helpful. Then, to account for inter-model variability and reduce uncertainty, we applied the ensemble of forecasting approach to find a consensus among ENMs (Araújo and New, 2007). More specifically, we used a weighted average based on AUC (Schmitt et al., 2017). This approach has been proven to be more interpretative than a single-model analysis. Following Zurell et al. (2020), we provide the ODMAP protocol of the modelling process (Table S2).
Differences in predicted suitable area between climate-only and climate–vegetation modelsWe created a binary map from each ensemble (climate-only and climate–vegetation models) using True Skill Statistic (TSS) as a threshold that maximizes the sum of sensitivity and specificity of the ensemble (Schmitt et al., 2017) and determined their predicted suitable area (PSA, km²). Then, we calculated for each species the relative difference in the PSA of climate-only models and climate–vegetation models using the following math:
where PSACO/CV is the percentage of predicted suitable area of climate-only models (COPSA) that was predicted as suitable area by climate–vegetation models (CVPSA). Therefore, PSACO/CV measures the relative range size differences between models. Positive values indicate that the climate-only model predicted larger suitable area and negative values indicate that the climate–vegetation model predicted larger suitable area. We also overlapped the binary maps of predicted suitable areas for each species to visualize the areas that are congruent between predicted models and areas that differed between climate-only and climate–vegetation models.Comparing the difference in predicted suitable areas (PSACO/CV) among forest dependency degrees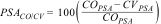
We utilized phylogenetic ANOVA to compare PSACO/CV values among the three forest dependency groups (low, medium, and high) using the phytools R package (Revell, 2012). Phylogenetic ANOVA controls the fact that species may not represent statistically independent data and ascertain whether there is an association between variation in PSACO/CV values and forest dependency groups. All resultant p-values were corrected for multiple comparisons using a Bonferroni correction. To perform this approach, we pruned the time-calibrated tree proposed by Jetz et al. (2012, https://birdtree.org/) to include the 36 bird species used in our study.
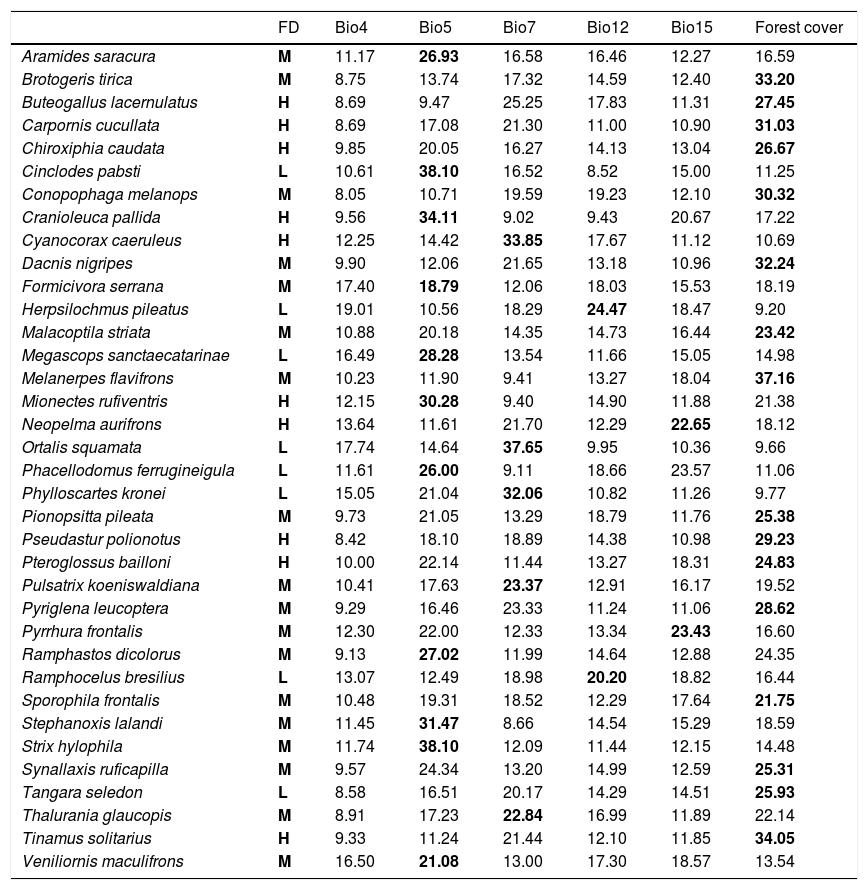
ResultsOverall, modeling procedures provided satisfactory predictions (AUCco = 0.85 ± 005; AUCcv = 0.86 ± 005) and only two models generated by SVM had AUC < 0.75 (Table 1). The relative range size difference varied from -36.73% to 46.75% (mean: 4.62, SD: 17.23; Table 1). We observed a significant effect of species’ forest dependency degree on the relative range size differences (F = 4.62, P = 0.03; Fig. 2). On average, for species with high and medium forest dependency climate–vegetation models predicted lower range sizes. In contrast, for low forest dependency species, climate–vegetation models predicted similar or larger range sizes than climate-only models. Species with high and medium forest dependency showed stronger differences in range size predictions between predictor sets than species with low forest dependency (Fig. 2). Melanerpes flavifrons (medium forest dependency), Brotogeris tirica (medium forest dependency), Carpornis cucullata (high forest dependency), and Ramphastos dicolorus (medium forest dependency) had the highest relative range size differences with climate-only models predicting a range roughly a third larger (46.75%, 35.32%, 35.24%, and 33.33% respectively) than models including vegetation cover as a predictor. Vegetation cover had the highest contribution to model output of 16 out of 36 species and the second-highest contribution of eight species indicating its importance as a predictor variable (Table 2). From the climatic variables, Bio5 (maximum temperature of the warmest month) was most often selected as most important variable (in 11 out of 36 species).
 Consensus phylogeny (based on Jetz et al., 2012) indicating the relationship between the 36 bird species modeled in this study. (B) Relative differences in predicted suitable area (PSACO/CV) of climate-only (CO) model compared to climate–vegetation (CV) model. Positive values indicate larger ranges predicted by climate-only model and negative values indicate larger ranges predicted by climate–vegetation model. (C) Relative differences in predicted suitable area (PSACO/CV) according to species’ forest dependency. Different letters indicate significant differences in relative range size differences (adjusted p values < 0.05).")
(A) Consensus phylogeny (based on Jetz et al., 2012) indicating the relationship between the 36 bird species modeled in this study. (B) Relative differences in predicted suitable area (PSACO/CV) of climate-only (CO) model compared to climate–vegetation (CV) model. Positive values indicate larger ranges predicted by climate-only model and negative values indicate larger ranges predicted by climate–vegetation model. (C) Relative differences in predicted suitable area (PSACO/CV) according to species’ forest dependency. Different letters indicate significant differences in relative range size differences (adjusted p values < 0.05).
Percent contribution values of each environmental variable used in the models. Abbreviations are as follows. FD – forest dependency (BirdLife International, 2018): L = low, M = medium, and H = high. Bio4 = temperature seasonality; Bio5 = maximum temperature of the warmest month; Bio7 = temperature annual range; Bio12 = annual precipitation; Bio15 = precipitation seasonality; and Forest cover = percentage of vegetation cover in the Brazilian Atlantic Forest remaining in 2018. In bold, the values with the greatest contribution for each species.
| FD | Bio4 | Bio5 | Bio7 | Bio12 | Bio15 | Forest cover | |
|---|---|---|---|---|---|---|---|
| Aramides saracura | M | 11.17 | 26.93 | 16.58 | 16.46 | 12.27 | 16.59 |
| Brotogeris tirica | M | 8.75 | 13.74 | 17.32 | 14.59 | 12.40 | 33.20 |
| Buteogallus lacernulatus | H | 8.69 | 9.47 | 25.25 | 17.83 | 11.31 | 27.45 |
| Carpornis cucullata | H | 8.69 | 17.08 | 21.30 | 11.00 | 10.90 | 31.03 |
| Chiroxiphia caudata | H | 9.85 | 20.05 | 16.27 | 14.13 | 13.04 | 26.67 |
| Cinclodes pabsti | L | 10.61 | 38.10 | 16.52 | 8.52 | 15.00 | 11.25 |
| Conopophaga melanops | M | 8.05 | 10.71 | 19.59 | 19.23 | 12.10 | 30.32 |
| Cranioleuca pallida | H | 9.56 | 34.11 | 9.02 | 9.43 | 20.67 | 17.22 |
| Cyanocorax caeruleus | H | 12.25 | 14.42 | 33.85 | 17.67 | 11.12 | 10.69 |
| Dacnis nigripes | M | 9.90 | 12.06 | 21.65 | 13.18 | 10.96 | 32.24 |
| Formicivora serrana | M | 17.40 | 18.79 | 12.06 | 18.03 | 15.53 | 18.19 |
| Herpsilochmus pileatus | L | 19.01 | 10.56 | 18.29 | 24.47 | 18.47 | 9.20 |
| Malacoptila striata | M | 10.88 | 20.18 | 14.35 | 14.73 | 16.44 | 23.42 |
| Megascops sanctaecatarinae | L | 16.49 | 28.28 | 13.54 | 11.66 | 15.05 | 14.98 |
| Melanerpes flavifrons | M | 10.23 | 11.90 | 9.41 | 13.27 | 18.04 | 37.16 |
| Mionectes rufiventris | H | 12.15 | 30.28 | 9.40 | 14.90 | 11.88 | 21.38 |
| Neopelma aurifrons | H | 13.64 | 11.61 | 21.70 | 12.29 | 22.65 | 18.12 |
| Ortalis squamata | L | 17.74 | 14.64 | 37.65 | 9.95 | 10.36 | 9.66 |
| Phacellodomus ferrugineigula | L | 11.61 | 26.00 | 9.11 | 18.66 | 23.57 | 11.06 |
| Phylloscartes kronei | L | 15.05 | 21.04 | 32.06 | 10.82 | 11.26 | 9.77 |
| Pionopsitta pileata | M | 9.73 | 21.05 | 13.29 | 18.79 | 11.76 | 25.38 |
| Pseudastur polionotus | H | 8.42 | 18.10 | 18.89 | 14.38 | 10.98 | 29.23 |
| Pteroglossus bailloni | H | 10.00 | 22.14 | 11.44 | 13.27 | 18.31 | 24.83 |
| Pulsatrix koeniswaldiana | M | 10.41 | 17.63 | 23.37 | 12.91 | 16.17 | 19.52 |
| Pyriglena leucoptera | M | 9.29 | 16.46 | 23.33 | 11.24 | 11.06 | 28.62 |
| Pyrrhura frontalis | M | 12.30 | 22.00 | 12.33 | 13.34 | 23.43 | 16.60 |
| Ramphastos dicolorus | M | 9.13 | 27.02 | 11.99 | 14.64 | 12.88 | 24.35 |
| Ramphocelus bresilius | L | 13.07 | 12.49 | 18.98 | 20.20 | 18.82 | 16.44 |
| Sporophila frontalis | M | 10.48 | 19.31 | 18.52 | 12.29 | 17.64 | 21.75 |
| Stephanoxis lalandi | M | 11.45 | 31.47 | 8.66 | 14.54 | 15.29 | 18.59 |
| Strix hylophila | M | 11.74 | 38.10 | 12.09 | 11.44 | 12.15 | 14.48 |
| Synallaxis ruficapilla | M | 9.57 | 24.34 | 13.20 | 14.99 | 12.59 | 25.31 |
| Tangara seledon | L | 8.58 | 16.51 | 20.17 | 14.29 | 14.51 | 25.93 |
| Thalurania glaucopis | M | 8.91 | 17.23 | 22.84 | 16.99 | 11.89 | 22.14 |
| Tinamus solitarius | H | 9.33 | 11.24 | 21.44 | 12.10 | 11.85 | 34.05 |
| Veniliornis maculifrons | M | 16.50 | 21.08 | 13.00 | 17.30 | 18.57 | 13.54 |
Our results indicate that excluding habitat variables from the models largely overestimates species range sizes especially for habitat specialists. Despite the devastating effects of habitat loss and fragmentation on biodiversity, affecting species’ survival and promoting range shifts (Fahrig, 2003; Warren et al., 2001; Jetz et al., 2007), many species range predictions rely mainly on climate predictors. This is worrisome because excluding habitat variables from the models could lead to overoptimistic predictions of the future of biodiversity for vulnerable ecosystems such as the Brazilian Atlantic Forest.
For most of medium and high forest dependent species climate-only models predicted range sizes up to 47% larger than models including vegetation cover as a predictor. These differences in range size estimates are alarming as they indicate that climate-only models may underestimate potential population losses related to forest degradation. Previous studies have indicated that if human activities continue to degrade Brazilian Atlantic Forest cover likely large populations will be lost at local scales (Ribon et al., 2003; Martensen et al., 2012; Galetti et al., 2013), and could even lead to the extirpation of bird species with high and medium forest dependency (e.g. Jetz et al., 2007; Urban, 2015). For example, projections of land cover conversion by the year 2100 indicate that birds may lose more than half of their range size in tropical and subtropical regions, and are thus, particularly vulnerable to extinction (Jetz et al., 2007). Frugivorous birds in Atlantic Forest are affected by patch size reduction with large-sized seed-dispersers being extirpated from small forest fragments (Galetti et al., 2013; Bovo et al., 2018; Emer et al., 2018). This scenario is worrying because it would catalyze the homogenization replacing species with restricted ecological requirements by stress-tolerant species typical of open areas, resulting in decreased beta diversity and biotic impoverishment (McKinney and Lockwood, 1999; Lôbo et al., 2011). Even if species with medium and high forest dependency do not become extinct, they probably will have their geographic range area reduced. Consequently, other pressures related to small population sizes, low connectivity between populations, and inbreeding will make the long-term persistence of these species extremely difficult (Metzger et al., 2009).
Previous studies evaluating whether habitat loss and fragmentation impact species distribution on a broad scale have found mixed results (Thuiller et al., 2004; Luoto et al., 2007; Trivinõ et al., 2011; Reino et al., 2013; Vasconcelos and Doro, 2016; Reino et al., 2018). Some studies showed that including vegetation cover (grid resolution 10 × 10 km) improves model predictions for frogs in Atlantic Forest (Vasconcelos and Doro, 2016) and some birds in the Iberian Peninsula (Trivinõ et al., 2011; Reino et al., 2013). In contrast, Thuiller et al. (2004) found that the addition of vegetation cover to bioclimatic models (grid resolution 50 × 50 km) has not improved the predictive accuracy of birds in Europe. Partly these contradictory results can be explained by differences in spatial resolution (Luoto et al., 2007). Adding to this discussion, our results clearly emphasize the importance of habitat specificity of species as a reason for mixed results (Warren et al., 2001; Trivinõ et al., 2011; Reino et al., 2018). Species often respond to environmental changes in different ways owing to intrinsic life-history traits and habitat requirements (Warren et al., 2001; Maggini et al., 2014; Trivinõ et al., 2011). The effects of habitat fragmentation on birds might vary according to intrinsic characteristics of the species, such as forest dependency, sensitivity to disturbances, and dispersal limitations (Galetti et al., 2013; Maggini et al., 2014; Bovo et al., 2018; Reino et al., 2018). For example, except for Tangara seledon, vegetation cover was not ranked among the first three predictor variables contributing to model output of bird species with low forest dependency. Furthermore, climate–vegetation models predicted range sizes similar to those predicted by climate-only models indicating that other factors such as physiological constraints or dispersal limitation rather than vegetation cover might delimit the spatial distribution of species with low forest dependency. Taken together, our results indicate that the addition of vegetation cover in ENMs might provide robust predictions when modelling geographic species distribution at fine resolutions (10 × 10 km) and discriminating species-specific responses based on their life-history traits.
We recognize that, besides climate conditions and land-use changes, there are other factors, such as biotic interactions and poaching, affecting bird range distributions (Uezu et al., 2005; Hasui et al., 2017; Zurell, 2017; Bovo et al., 2018). Working with the native vegetation cover without incorporating other landscape metrics into the model (e.g. patch size, format, connectivity among patches, habitat quality, and surrounding landscape matrix) might also mask the effect of other drivers of species’ range shifts (Fahrig, 2003; Ribon et al., 2003; Martensen et al., 2012; Hasui et al., 2017). Furthermore, we did not consider the adaptive responses of different populations to environmental change. Previous studies argue that the sensitivity to fragmentation and habitat loss may vary geographically among different populations within species (Anjos et al., 2010; Orme et al., 2019; Williams and Newbold, 2021). For example, Orme et al. (2019) found that populations of Atlantic Forest birds are more sensitive to deforestation when near their range edge, which generates a differential effect of habitat fragmentation between populations. Stephanoxis lalandi (Trochilidae) is classified as having a medium forest dependency and still it showed the lowest relative range size differences between models and compared with other medium forest dependency species. Populations of this species have been reported more often living within anthropogenic landscapes during the last decades (Hasui et al., 2018) indicating large niche breadth or misclassification (Alexandrino et al., 2016). In the future, plasticity and behavioral adaptations in habitat preferences should receive more attention. For last, 14 of the 36 bird species had a small extent of their geographical ranges limited due to exclusion of occurrence points from the Atlantic Forest of Argentina and Paraguay. These exclusions can generate truncated niches due to incomplete representation of environmental conditions generating inaccurate extrapolations (Peterson et al., 2018). Although we cannot discard that excluding occurrence points outside Brazilian Atlantic Forest could affect our ENM predictions, we consider that niche truncation is not affecting our results because predictions were based on environmental conditions under which the model was calibrated and they were not used for extrapolation to new places or environments outside Brazilian Atlantic Forest (Zurell et al., 2012)
Considering that climate change and human land-use changes are the two main factors causing variation in range shifts, climate–vegetation models would provide useful information to support quick decisions, such as conservation planning for species with specific ecological requirements, or guidelines to identify priority areas for forest conservation in modified landscape (Jetz et al., 2007; Guisan et al., 2013; Vale et al., 2018a). Therefore, understanding how native vegetation cover affects the potential distribution ranges of species could be particularly useful to the threatened biodiversity in the Brazilian Atlantic Forest where information on broad-scale species distribution patterns is still limited compared to the effects of native vegetation cover on local and regional scales.
Data accessibilityScripts and datasets to replicate the analyses of the study are available at https://figshare.com/s/818a21d34522e27d2562. Furthermore, the species occurrence points are available on the supplementary data of Hasui et al. (2018) and at the Global Biodiversity Information Facility online database (GBIF; https://www.gbif.org/). The climatic variables can be found on WorldClim 2.0 database (Fick and Hijmans, 2017; http://www.worldclim.org). The layer containing the percentage of native vegetation cover until 2018 is available at the SOS Mata Atlântica website (http://mapas.sosma.org.br/dados/).
Declaration of interestsThe authors declare that they have no known competing financial interests or personal relationships that could have appeared to influence the work reported in this paper.
We thank Gabriel E. B. de Barros for helping with GIS dataset and Thadeu S. de Souza for helping with the ecological niche modeling procedures. Fernando I. de Godoy for kindly providing the images of Carponis cucullata and Herpsilochmus pileatus. A.E.O.-S. thanks Fundação de Amparo à Pesquisa do Estado de São Paulo for her scientific initiation fellowship (FAPESP, #2018/02591-0). DZ acknowledges support from the German Science Foundation (DFG, grant no. ZU 361-1/1).
The following is Supplementary data to this article:

