


We identified the 30% most-important forest remnants for conservation in the Atlantic Forest domain in South America based on three bird diversity components: (1) overall species potential distribution, (2) potential distribution of threatened species, and (3) diversity of functional traits. We evaluated the extent of overlap among priority areas using the different approaches and analysed the efficiency of the current Protected Areas network at protecting biodiversity in current and potential future (2040 and 2080) climate scenarios. The overlap among the most important areas is low among the different bird diversity components in all climate scenarios, and few changes were found in priority areas between the current and future scenario. The proportion of species that reached the minimum amount of their distribution areas protected varied from zero to 4% depending on the climate scenario and the species conservation status (threatened or not). Priority areas based on the potential distribution of threatened species were less correlated to areas based on the overall species potential distribution than to functional traits in all climate scenarios, suggesting that there might be considerable differences between species composition and their functionalities. Our analyses point out the main regions where resources should be allocated to conservation of birds in a mega-biodiversity region.
The establishment of Protected Areas (hereafter PA) has long been used as a cornerstone strategy for conserving biodiversity worldwide (Margules and Pressey, 2000; Wauchope et al., 2022). Although the amount of terrestrial PA has increased in recent years, it is well below the minimum requirements for long-term maintenance of biodiversity (∼16% of the terrestrial surface are currently protected; UNEP-WCMC and IUCN, 2020). Evidence suggests that the land area that should be preserved to maintain biodiversity and provide important ecosystem services such as water quality regulation and carbon storage may vary from 44 to 70% (Allan et al., 2022; Jung et al., 2021). In view of the need to expand the PA network, one of the targets of the first draft of the post-2020 Global Biodiversity Framework proposes protecting 30% of land surface area by 2030, the “30 by 30 target” (CBD, 2021; Jung et al., 2021). This means that there is a need to identify important areas for conservation, especially in tropical environments with high biodiversity and high levels of habitat loss (Barlow et al., 2018; Haddad et al., 2015; Myers et al., 2000).
While prioritising areas based on overall species distribution may effectively capture a large portion of biodiversity, focusing on threatened taxa can be relevant in avoiding imminent extinctions (Ricketts et al., 2005). A rather different approach – adopting strategies that consider functional diversity – may benefit ecosystem processes and resilience to environmental changes (Carlucci et al., 2020; Martello et al., 2018; Violle et al., 2007). Although it is possible to use different approaches for prioritizing areas for conservation, some striking incongruences can be found when using different aspects of biodiversity (Belote et al., 2021; Brum et al., 2017; Sibarani et al., 2019; Sobral et al., 2014). In addition, climate change can cause shifts in species distributions, which means that critical conservation areas may differ in the future (Avalos and Hernández, 2015). These factors make the process of selecting priority areas for conservation challenging.
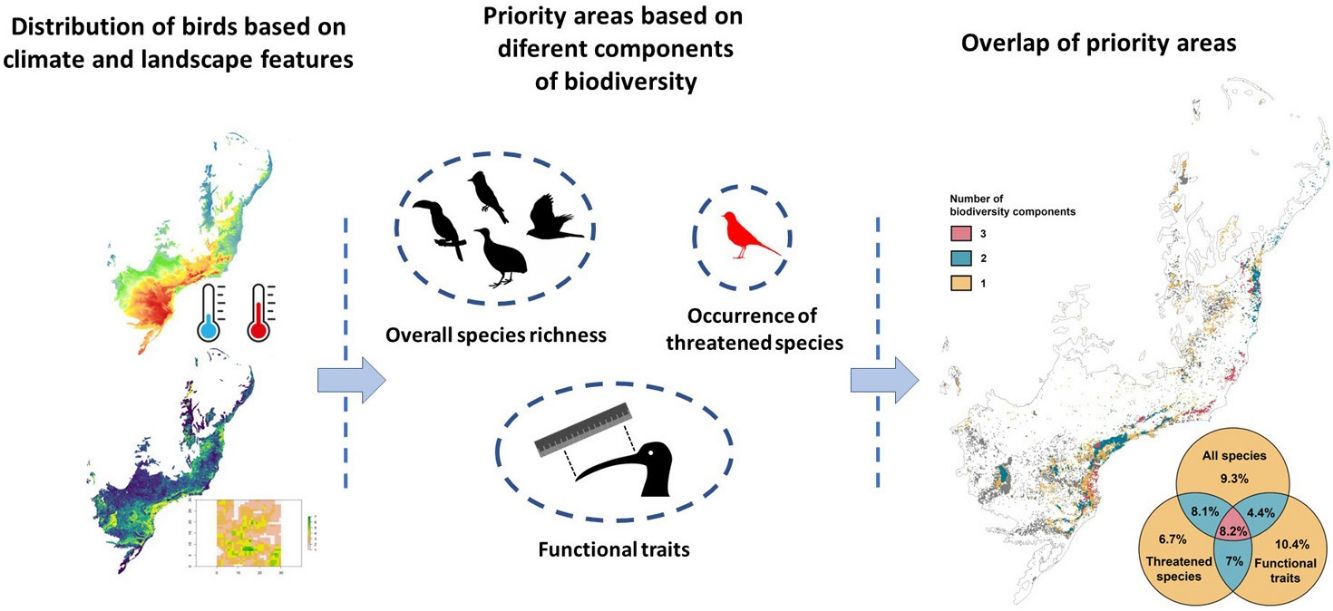
In this article we used a landscape-based approach to identify important areas for bird conservation in a fragmented tropical biodiversity hotspot, the Atlantic Forest in South America (AF; Fig. 1). We focused on forest birds because they are a diverse group that can be used as indicators of habitat quality (Alexandrino et al., 2016). Our aims were to (1) identify, in line with the “30 by 30” target, the 30% most important regions for different components of bird diversity: overall species potential distribution, the potential distribution of threatened species, and functional traits; (2) evaluate congruences and divergences among the most important areas based on these three components; (3) evaluate how priority regions for conservation may be different under future climate scenarios; and (4) assess the how the current PA network cover the important forest fragments pointed in our analysis, in addition to identify regions where it could be expanded.
 in different climate scenarios (current climate scenario in the left panel and 2080 climate scenario in the right panel). The Venn diagrams show the percentage of overlap of the Atlantic Forest patches representing the 30% top priority areas for the different bord diversity components analysed. Colors in the maps show forest patches with different amounts of overlap. Forest patches in which none of the biodiversity components showed importance are in light gray.")
Overlap among priority areas based on the different bird diversity components analysed (overall species potential distribution, potential distribution of threatened species and functional traits) in different climate scenarios (current climate scenario in the left panel and 2080 climate scenario in the right panel). The Venn diagrams show the percentage of overlap of the Atlantic Forest patches representing the 30% top priority areas for the different bord diversity components analysed. Colors in the maps show forest patches with different amounts of overlap. Forest patches in which none of the biodiversity components showed importance are in light gray.
Despite its high number of species and endemism, after centuries of devastation, only 28% of AF native vegetation currently persists (Rezende et al., 2018), and most of the forest remnants are small and isolated from each other (Ribeiro et al., 2009). In addition, the domain has been suffering a loss of mature forests, which has been compensated by the emergence of secondary forest patches primarily formed through natural regeneration. Because of this, the overall extent of native vegetation has remained stable over the past decades (Rosa et al., 2021). However, it is important to highlight that the secondary forests may not possess the same level of biodiversity as the old growth forests (Gibson et al., 2011).
Species distribution modelling The potential distribution of species were generated based on the Species Distribution Models (SDM) approach (Guisan et al., 2017; Peterson et al., 2011). As climatic variables usually defines species potential distribution at large biogeographic scales, while the landscape influences the distribution regionally (Peterson et al., 2011; Sobral-Souza et al., 2021; Tourinho et al., 2022), for each species, our models were based on two classes of predictor variables separately – (1) climate and (2) landscape. To better represent species distributions, we only considered areas of potential distribution those that were suitable under both classes, the same approach used by Tonetti et al. (2022).
Spatial occurrence of species were obtained from the following databases: Global Biodiversity Information Facility (GBIF; https://www.gbif.org); iNaturalist (https://www.inaturalist.org); VertNet (http://vertnet.org); eBird (https://ebird.org); and Integrated Digitized Biocollections (iDigBio; https://www.idigbio.org) considering taxonomical synonyms with the aid of the spocc R package (Chamberlain, 2020). After all filtering procedures on species’ occurrence points (Supplementary material), we projected the potential distribution of 368 species. For the climatic models we considered the 19 bioclimatic variables from the WordClim 2.1 database (https://www.worldclim.org/data/worldclim21.html). These variables are derived from temperature and precipitation data collected during the years of 1970 and 2000 in weather stations distributed around the world and were used to represent the current climate scenario (Fick and Hijmans, 2017). To predict suitable areas for species distribution according to landscape, we calculated the following variables based on our 30-m resolution raster with the aid of the LSMetrics package in the GRASS GIS environment (https://github.com/LEEClab/LS_METRICS/wiki; Niebuhr, 2018): (1) edge amount considering pixels less than 60 m from edge and for each pixel a mean value around a 1.000 m moving window was calculated (Hagen-Zanker, 2016), (2) area of patches functionally connected considering that species may cross a 60 m-distance in matrix, (3) forest percentage (moving window = 1.000 m), and (4) patch area. These distances for edge depth, moving window, and gap crossing were chosen based on the literature (Graham and Socha, 2019; Uezu et al., 2005). We also considered elevation in association to the landscape variables as it proved to be important to predict species distributions (Guisan et al., 2017; Peterson et al., 2011).
We employed the ensemble distribution models approach combining the prediction of the following algorithms: bioclim, domain, random forest, and maxent. These algorithms do not require true absence data, they estimate species distribution using presence-only (bioclim and domain), background (maxent), and pseudo-absence points (Vale et al., 2018). After training models using the current climate and landscape scenarios, we projected the SDM for both current and future climate scenarios. However, we only considered the current forest patch configuration of the AF landscape to predict species distributions under both climate scenarios. We projected the potential distribution of species for the year of 2040 and 2080 using intermediate scenarios of climate change from the WordClim 2.1 database (SSP 370, IPCC, 2022), as scenarios that predict low effects of climate change and those that predict very intense effects are unlikely to occur (Hausfather and Peters, 2020) We also did not project the distribution of species in the temporally more distant scenario (2100), as it can be less accurate (Hausfather and Peters, 2020). Please see the Supplementary Material for more details on the methods used to predict species potential distribution.
Functional traitsWe considered two classes of functional traits of the 368 bird species studied (Table S1): (1) morphological and (2) foraging attributes of species. Five morphological measurements were used: (1) the hand-wing index; (2) tail/wing, and (3) tarsus/wing relationships, which may indicate locomotory characteristics of species (Bregman et al., 2016); (4) bill shape (bill length/width ratio), which can be used as a proxy of dietary traits (Bovo et al., 2018), and (5) body mass (values were log-transformed to reduce the influence of extreme values) which is related to physiology and ecology of birds and the amount of food consumed (Bovo et al., 2018). The hand-wing index was collected from Tobias et al. (2022). The other morphological measurements were extracted from the literature (70% of individuals; Rodrigues et al., 2019), specimens deposited in the Museum of Zoology of the University of São Paulo (23.6%), and individuals measured in the field by the authors (6.4%). Whenever possible, we measured two males and two females and extracted a mean value to account for species variability. We obtained ecological data from the literature (Wilman et al., 2014) and represent continuous values of the proportional composition of the food birds consume (invertebrates, vertebrates, fruits, nectar, seed, and other plant material) as well as the foraging strata species occupy (ground, understory, mid to high, canopy or aerial). In line with other authors (Bregman et al., 2016), we then used the mean values of traits for each species to conduct a Principal Component Analysis of morphological traits and of foraging attributes. This allowed us to characterize the large variation in functional traits in a smaller number of dimensions.
Identification of priority areas in different scenariosTo identify priority areas we used the Zonation algorithm (Moilanen et al., 2014). Based on the distribution of individual features, Zonation produces a hierarchical prioritization rank in which pixel values vary from 0 to 1. We choose the Core Area Zonation (CAZ) as a removal rule. CAZ gives more weight to features with smaller distribution (Moilanen et al., 2014). Only forest patches were considered in the analysis (see a description of the study area and database used in the Supplementary Material).
We used layers of the following three classes of features: (1) overall species potential distribution, (2) globally threatened species potential distribution (BirdLife International, 2022), and (3) distribution of functional traits of birds. We mapped the functional traits of birds following a similar approach used by Brum et al. (2017) and Sibarani et al. (2019). We first split the first axis of the PCA of morphological data (which accounted for 98% of the variance in morphological data) and the first four axes of foraging data (which explained 81% of variation) into 10% quantiles and then converted into categorical variables (each of the percentile is a category). We then constructed a matrix of binary variables for each species and multiplied this matrix by the occurrence of species in the study area, as determined from the maps generated by the SDM.The result was distribution maps of each trait so that the same trait can represent a pixel by more than one species (Box S1).
Using the continuous raster ranked by Zonation we identified the 30% most-important pixels as priority areas for conservation according to each biodiversity component. We considered the distribution of species separately for the different climate scenario (current, 2040 and 2080). To evaluate the congruence among priority areas, we superimposed the 30% most important areas for each feature class in each climate scenario to identify the amount of area that overlap. We also performed a Kendall rank correlation test among the continuous ranks in different periods and for different bird diversity components.
We accounted for the amount of area of each 30% binary priority map with the current PA network considering the IUCN classes I–IV. PA data were downloaded from the protected planet database (https://www.protectedplanet.net/). The current PA network covers 12.2% of AF forest patches, and to expand it to 30% we identified the 17.8% top priority forest remnants beyond the already protected ones using the current PA network as an input in the Hierarchical Removal mask in the Zonation software (Moilanen et al., 2014).
To evaluate the current PA’s coverage, we accounted for the proportion of species that achieved minimum targets of their distributional ranges covered by reserves. One of the targets, first proposed by Rodrigues et al. (2004), set the minimum amount of the distributional range of a species varying from 10% for species with more than 250.000 km2 of distributional range increasing to 100% for species with small geographical ranges (<1.000 km2). A log-linear interpolation is applied to values between these two thresholds (Butchart et al., 2015; Rodrigues et al., 2004). Like other studies (Belote et al., 2021), we also set a target to protect at least 30% of the species distributional range. The efficiency of the priority landscapes was evaluated based on the current and 2080 potential distribution of species, and the best landscapes considered were those based only on the current distribution of species – i.e. to set the targets we did not consider the potential future distribution of species.
ResultsThe amount of overlap among the 30% most important areas for biodiversity conservation is low in both current and 2080 climate scenarios (Figs. 1 and S1). Most areas where the 30% top priority regions for conserving the three different bird diversity components overlap are represented by large forest patches near the coast (Figs. 1 and 3). Bird diversity components with higher overlap are overall species potential distribution and occurrence of threatened species (Figs. 1 and 2). The Kendall rank correlation test among the continuous raster showing the rank of priority areas according to Zonation was also low among the different bird diversity components in all climate scenarios, and as for the overlap of the 30% most important areas of binary maps, overall species potential distribution and potential distribution of threatened species are more correlated among each other when compared to areas important according to functional traits (Figs. S1 and S2; Tables S2 to S4).
 and threatened species (right panels) that might achieve thresholds of their occurrence areas protected according to two targets: (1) at least 30% of distributional areas protected (panels A and B), and (2) the target proposed by Rodrigues et al. (2004; panels C and D) – and considering different thresholds for the continuous Zonation priority rank maps (x-axis). Black lines represent the distribution of species under the current climate scenario and red lines under the 2080 climate scenario. Zonation priority rank landscapes considered are those indicated by the current distribution of species only.")
Percentage of total (left panels) and threatened species (right panels) that might achieve thresholds of their occurrence areas protected according to two targets: (1) at least 30% of distributional areas protected (panels A and B), and (2) the target proposed by Rodrigues et al. (2004; panels C and D) – and considering different thresholds for the continuous Zonation priority rank maps (x-axis). Black lines represent the distribution of species under the current climate scenario and red lines under the 2080 climate scenario. Zonation priority rank landscapes considered are those indicated by the current distribution of species only.
Although we have identified potential important areas for conservation in 2040, we are only showing figures for the current and the 2080 climate scenarios for practical reasons. In 2040, we estimate around 52% of species will have a reduced distribution, with the mean loss running at 11.5% (S.D. = 18.4%) of current distribution; and 48% of species can increase a mean of 5.6% (S.D. = 5%) in their distributional areas. In the 2080 scenario, 52.4% of species can suffer a mean contraction of 9.7% (S.D. = 19.2%), 47.5% of species can increase their areas in 3.9% (S.D. = 6.5%) and eight species can have no potential distributional areas available, suggesting that they can be extinct (Table S1).
Only 2.9% of the species reached the target of the amount of areas protected proposed by Rodrigues et al. (2004) in the current climate scenario, and 4% in the 2080 climate scenario. Only 0.5% of the species reached at least 30% of their distributional ranges covered by PA in the current climate scenario and 1.1% for the 2080 climate. For threatened species only, none has reached the minimum distributional range covered by PA in the current nor in the 2080 climate scenario for both targets.
Whereas the current PA network leads to a low percentage of species reaching their distributional ranges, the top 12.2% of the ranked landscape could adequately safeguard from 5.5% to 61% of species depending on the threatened status and climate scenario (Fig. 2). The amount of the top 30% of most important areas covered by reserves is low for all bird diversity components investigated with slight variations in the different climate scenarios (Table 1). Despite that, pixel values of the continuous raster of the Zonation priority rank are higher when comparing regions within and outside PA in the current and 2080 climate scenarios (Figs. S3 and S4). All the differences were significant under the Wilcoxon rank sum test (p < 0.05). Fig. 3 shows areas in the AF where the current PA network can be expanded.
Percentage of the 30% most important areas for the different components of bird diversity covered by protected areas.
| Climate scenario | Overall species potential distribution | Threatened species potential distribution | Functional traits |
|---|---|---|---|
| Current climate | 15 | 13.1 | 21.1 |
| 2040 climate | 15.5 | 14.5 | 20.7 |
| 2080 climate | 17 | 14.3 | 19.8 |
 in different climate scenarios (current climate scenario in the left panel and 2080 climate scenario in the right panel). The Venn diagrams show the percentage of overlap of the Atlantic Forest patches representing the 17.8% top priority areas for the different components analysed when considering the 12.2% of forest patches already protected (represented in black). Colors in the maps show forest patches with different amounts of overlap. Forest patches in which none of the biodiversity components showed importance are in light gray.")
Overlap among the priority areas that could be protected to increase the current protected areas network to 30% of the AF remnants. Priority areas were identified based on the different bird diversity components analysed (overall species potential distribution, potential distribution of threatened species and functional traits) in different climate scenarios (current climate scenario in the left panel and 2080 climate scenario in the right panel). The Venn diagrams show the percentage of overlap of the Atlantic Forest patches representing the 17.8% top priority areas for the different components analysed when considering the 12.2% of forest patches already protected (represented in black). Colors in the maps show forest patches with different amounts of overlap. Forest patches in which none of the biodiversity components showed importance are in light gray.
To our knowledge our study is the only one that included landscape metrics when projecting the potential distribution of species in the PA planning. Similar to others (Kremen et al., 2008; Sibarani et al., 2019), our analysis considered only forest patches. Landscape features influence the persistence of populations of forest birds, thus considering their effects may provide a more accurate representation of species distribution (Guisan et al., 2017; Pizo and Tonetti, 2020; Tourinho et al., 2022).
As expected, and similarly to other study which also evaluated the effects of landscape and climate change on bird distributions in the AF (Tourinho et al., 2022), we found that large forest patches presented higher importance for bird conservation. Other studies that aimed at identifying important areas for the occurrence of plants (Murray-smith et al., 2009; Zwiener et al., 2017), amphibians (Trindade-Filho et al., 2012), primates (Lima et al., 2019), and snakes (Lourenço-de-Moraes et al., 2019) in the AF region have also reported the higher importance of large forest patches closer to the Brazilian coast. We found greater overlap among the three different bird diversity components investigated in this portion of the study area (Fig. 1). In spite of that, it is important mentioning that some small fragments showed high overlap among the three different prioritization approaches, reinforcing that small forest patches (as those with many endemic and threatened species in the northeast portion of the AF; Pizo and Tonetti, 2020) are also important for conservation(Fig. 1; Kremen et al., 2008; Riva and Fahrig, 2022).
In line with other studies (Brum et al., 2017; Mazel et al., 2014; Sibarani et al., 2019; Sobral et al., 2014), we found a substantial mismatch when comparing priority areas using different diversity components. Interestingly, the potential distribution of threatened species was less correlated to the potential distribution of overall species than to functional traits in all climate scenarios, and when the three approaches were compared, overall species potential distribution and functional traits were the less correlated (Fig. S2; Tables S2 to S4). This suggests that there might be considerable differences between species composition and their functionalities (Bełcik et al., 2020). It is expected that areas where functional richness is higher are more resilient to environmental disturbances and can be more relevant in promoting ecosystem processes in fragmented landscapes (e.g. seed dispersal, and pollination; Barros et al., 2019; Bregman et al., 2016).
Prioritization of important areas for conservation under different climate scenariosOther studies also found high overlap when comparing priority areas in current and potential future climate scenarios based on the distribution of birds in the Atlantic Forest (Vale et al., 2018; Tourinho et al., 2022), as well as plants, invertebrates and birds in Great Britain, Europe (Critchlow et al., 2022). Under the effects of global warming, species are expected to shift their distributions to track changing climatic conditions, which means that they commonly move towards the poles and top of mountains (Guisan et al., 2017). The AF comprises high latitudinal and altitudinal ranges (Muylaert et al., 2018) and species richness is expected to increase in the south of the study area and in areas where elevation is higher (Figs S5 and S6). Because these shifts on species distributions can be complex (Vanderwal et al., 2013), species are likely to shift their distributions in a non-unidirectional, with some birds can potentially moving to the southern parts of the study region while others to higher altitude regions, which may partially explain the high overlap among priority areas in the current and both future climate scenarios. Although the high overlap of potential distributional areas may seem advantageous for expanding the current protected area (PA) network, covering species distributions in both climate scenarios, it is important to note that a significant portion (52.4%) of species might experience reductions in their distributional areas due to climate change. This would necessitate an increase in their minimum area covered by PA.
Regions pointed to expanding the current PA network are also similar in different climate scenarios (Fig. 3). Despite the expansion of PA can be effective in mitigating the negative effects of climate change by, for example, providing habitat for species that may perform movements to other regions (Lehikoinen et al., 2021) and sequester carbon (Melillo et al., 2016), it should be seen as an auxiliary measure to conserve biodiversity in the future. Expanding the extent of the global PA network by 30% will clearly be an important adaptation strategy to support the region's biodiversity as the climate changes, as PA are an important carbon stock worldwide (CBD, 2021; Jung et al., 2021). Nevertheless, reducing emissions globally must remain the key focus of climate change efforts (Holl and Brancalion, 2020; Tonetti et al., 2022).
Coverage of the current PA network on species distributionsLike other studies, our analysis corroborates the assertion that the coverage of the PA network could be enhanced with conservation planning (Brum et al., 2017; Critchlow et al., 2022; Jenkins et al., 2015; Margules and Pressey, 2000; Vale et al., 2018; Venter et al., 2018). The percentage of overall or threatened species which reached the minimum amount of their distributional areas covered by the current PA under the two different targets evaluated is lower when compared to the proportion of species that can achieve the thresholds of distributional areas protected by the best 12.2% of landscapes (Fig. 3). The capability of the PA network in covering the distribution of species has also proven to be limited in other parts of the world (Belote et al., 2021; Rodrigues et al., 2004). Obviously, the importance of the current PA network should not be overshadowed because of it. In fact, many bird species present most of their population in PA in tropical regions, including the AF (Cazalis et al., 2020; Develey and Phalan, 2021; Tonetti et al., 2017).
Limitations, opportunities, and future perspectivesBecause of the notorious limited amount of resources countries expend on biodiversity conservation (specially in developing tropical regions, where biodiversity is high; McClanahan and Rankin, 2016), studies that aim to use holistic approaches to prioritize areas for the creation of new reserves are essential to maximize biodiversity benefits outcomes PA can provide when implementing the 30 by 30 target. Even if it can not be possible to protect 30% of the forest remnants in tropical fragmented forests, those regions where there are overlap among all components of biodiversity should be first prioritized to expand the current PA network (as those forest patches in the eastern portion of AF; Fig. 3). It is indispensable that not only the expansion of the new PA network be promoted but also the proper management of the reserves be guaranteed. In addition to the investment of resources, expanding the global PA network to 30% of the area of the planet requires good management and the integration of political, institutional, and governance aspects (Geldmann et al., 2019; Schleicher et al., 2019; Wauchope et al., 2022).
In addition, taking social aspects into account are of utmost relevance when expanding PA networks. The displacement of people from their original areas for the establishment of reserves involves ethical and social justice issues which by themselves should justify that actions like these are not promoted. The exclusion of local communities and Indigenous peoples from the natural areas they occupy can negatively impact biodiversity by creating conflicts between communities and natural areas (Dawson et al., 2021; Rechciński et al., 2019). Lastly, because there are large areas of unproductive pastures in the AF as in other tropical areas worldwide (Latawiec et al., 2015), there might be few trade-offs between increasing sustainable agricultural production and promoting biodiversity conservation in these regions. Actually, as other tropical forests, the AF shows several restoration opportunities to increase its amount of natural areas (Banks-Leite et al., 2014; Tonetti et al., 2022). Thus, our analyses can contribute to bird conservation and the functions they perform in a mega-biodiversity region by pointing out areas where resources could be better allocated.
Conflict of interestThere is no conflict of interest.
We thank all who share species occurrence data in public repositories, Professor Andrew Balmford for the review and suggestions, and the members of the Conservation Science Group, University of Cambridge, UK, by the helpful comments. VT and MAP were supported by the National Council for Scientific and Technological Development (CNPq; processes number 203045/2020-3 and 304742/2019-8 respectively). VT and MHV were founded by the São Paulo Research Foundation (FAPESP; 2018/20691-1 and 2022/01899-6 respectively).
The following is Supplementary data to this article:


