Colombia has experienced alarming rates of deforestation, posing a threat to forest biodiversity both inside and outside protected areas. Furthermore, a decline in ecological connectivity can potentially disrupt vital ecological processes such as pollination, gene flow, breeding, seed dispersal, among others. To address this issue at a national scale, it is crucial to identify and conserve a comprehensive network of ecological corridors.
In this study, we identified high priority potential ecological corridors linking protected areas in Colombia. We categorized a representative set of 16 threatened mammal species into four ecological profiles. Then, we used Least Cost Path (LCP) analysis to model potential corridors between protected areas as those that minimized resistance for forest species dispersal. To prioritize conservation efforts, we applied the decrease in the Probability of Connectivity index (dPC) to identify corridors with the highest priority.
Our findings emphasize the importance of preserving large forest patches within protected areas for species inhabiting lowland and sub-Andean forests. However, for species residing in Andean and high Andean forests, restoration measures (e.g., increasing forest cover) between protected areas are needed to enhance landscape permeability and facilitate their dispersal, thereby contributing to their conservation.
Our results have practical implications for decision-makers involved in conservation efforts. These findings can aid in identifying conservation priorities for existing protected areas and their surrounding forest habitats in Colombia. Additionally, we provided expert-based resistance values for different forest mammals that can be further used in other large scale connectivity analyses, including other countries where these species inhabit.

The declaration of protected areas (PAs) is a crucial tool for biodiversity management and conservation (UNEP-WCM et al., 2018). A widely used indicator for assessing the effectiveness of conservation plans and policies is the total area covered by PAs. However, these assessments often neglect other significant characteristics such as their ecological representativeness, or the role of these areas in promoting functional connectivity of populations (Castillo et al., 2020). Several studies have measured the connectedness of PAs worldwide yielding discouraging results. For instance, Santini et al. (2016) found that less than half of the world’s land covered by PAs is well-connected. Saura et al. (2017) obtained similar results, demonstrating that only 9.3% of the total coverage of PAs worldwide is well-connected.
Colombia is recognized as a global biodiversity hotspot that has been classified as a megadiverse country (Armenteras et al., 2003). Nevertheless, Colombia’s ecosystems are highly threatened, especially forest areas. Forests have experienced different deforestation and degradation dynamics explained by the expansion of illicit crops, agriculture, and cattle industry, as well as the increasing economic development (Armenteras et al., 2023). Forest loss also occurs within PAs, leading to a decline in taxonomic and functional biodiversity (Laurance et al., 2012) and undermining their overall effectiveness in achieving conservation objectives. In addition, changes in forest configuration affect landscape connectivity, as defined by Taylor et al. (1993) ‘‘the degree to which the landscape facilitates or impedes movement among resource patches’’, which in turn can have detrimental effects on ecological processes such as pollination, gene flow, breeding and seed dispersal, among others (Saura et al., 2011). Therefore, it is crucial to conserve forest habitats and maintain their connectivity, especially for species that are forest specialists or have a limited to moderate dispersal capabilities (de la Fuente et al., 2018; Zárrate-Charry et al., 2022). Forest changes and the loss of connectivity are evident both within and between PAs, as shown in a national report (DNP, 2010), which highlighted the need of implementing complementary actions to foster the connectivity of the National System of Protected Areas (SINAP). The country has several challenges in this regard, such as the lack of updated land-use plans and accurate information on biodiversity and ecosystem condition to make appropriate conservation decisions (Berrouet et al., 2021).
One approach to promoting functional connectivity is the implementation of ecological corridors (Beier et al., 2008; Rudnick et al., 2012; Sawyer et al., 2011). In terrestrial environments, ecological corridors may facilitate daily or migratory movements, as well as gene flow between populations, and may also support range shifts over time and through space (see Hilty et al., 2020). Empirical data on the dispersal movements of focal species is the most reliable approach of identifying ecological corridors. Yet, such data is often unavailable for a significant number of species. Therefore, the design and implementation of ecological corridors most often relies on proxy variables that indicate movement behavior, such as land cover, altitude, and proximity to roads, among others (Sawyer et al., 2011).
We aimed to model the connectivity of Colombia’s PAs network considering different species groups with a range of ecological requirements. Specifically, our goals were (i) to identify potential corridors constituting a comprehensive national network connecting PAs and (ii) to rank the corridors according to their importance for connectivity maintenance at the national level, therefore identifying those with the highest priority for forest species conservation. We further assessed the land cover composition of the high priority ranked ecological corridors and evaluated their anthropogenic degradation level (Human Footprint Index). Our approach intends to assist in managing the complexity of national-level forest conservation planning, acknowledging the diversity of forest habitats across various ecological conditions.
MethodsStudy areaColombia is located in the northwest part of South America with an area of 1.1 million km2. The country is divided into five main biogeographic regions: The Andean, Caribbean, Pacific, Colombian Amazon, and Orinoquia plains (Etter et al., 2006).
Due to its complex geologic history regarding the uplifting of the Andes Mountain range, and its tropical weather, Colombia has a high ecosystem diversity, including almost all biomes described for the planet (Etter, 1993). To protect and conserve its biodiversity, Colombia has created a National System of Protected Areas (SINAP) with around 1000 protected areas grouped into 14 protection categories; this represents around 16% of the terrestrial land of the territory (RUNAP, n.d.). Colombian forests cover 52% of the territory (IDEAM et al., 2021) and, despite their degree of protection, continue to be lost and degraded (even within PAs) due to their conversion to pastures for cattle ranching, the expansion of the agricultural frontier, as well as the cultivation of illegal crops (Armenteras et al., 2013; Etter et al., 2006).
Selection of species and creation of ecological profilesThe selection of species for large-scale connectivity analysis is a complex task. Given the national scale of our study, we adopted a multispecies perspective and therefore selected species that jointly represented or encompassed the ecological needs of many others at country level (sensu Lambeck, 1997). We further grouped species together to create “species ecological profiles” (de la Fuente et al., 2018; Gurrutxaga et al., 2010; Vos et al., 2001) based on three criteria: (1) preferred land cover, which constitutes the species residential habitat, (2) altitudinal distribution ranges of the species, and (3) dispersal distances.
Connectivity within and among PAs is threatened by forest changes and habitat loss. Therefore, our analysis included species with restricted distributions as well as those highly sensitive to habitat fragmentation (Henle et al., 2004). The initial step in species selection was the compilation of the list of threatened species of Colombia (Colombian Resolution 1912 of 2017). Mammals were selected from this list as our focal taxon. They are often used in connectivity studies because of their susceptibility to linear infrastructure and the potential for other species to use the corridors designed for them (Gurrutxaga et al., 2011).
From this initial list, we excluded species with wide distributions (i.e., generalists) from the analysis because our focus was on species with specific habitat selection (forest-dependent species). Additionally, we excluded species with small body mass because their dispersal capabilities are smaller than the grain and scale considered in this study (1 km2). The data on habitat selection and dispersal capabilities of the species were obtained from relevant scientific literature (see Appendix A Table A1). After applying these filters, we selected 16 threatened mammal species and grouped them into 4 ecological profiles (see Table 1). Individual home range values were averaged to obtain the mean home range by ecoprofile. Subsequently, this value was used to calculate the maximum dispersal distance (see Table 1).
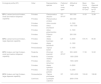
Ecological profiles (ecoprofiles (EP)) considered in this study, indicating the threatened mammal species (as in The Colombian Resolution 1912 of 2017) that fall within each profile. Values of preferred altitudinal ranges were sourced from the database Mamíferos de Colombia (Ramírez-Chaves et al., 2021) and mean home range (ha) were sourced from available literature and averaged across species within each EP (see Appendix A Table A1).
| Ecological profile (EP) | Order | Representative species | Preferred land cover typea | Altitudinal range | Mean Home range by EP (ha)b | Max. dispersal distance by EP (km)c |
|---|---|---|---|---|---|---|
| EP1: Lowland and sub-Andean, small and medium dispersal capability | Primates | Plecturocebus discolor | DF-RF-FF | 300−500 | 10.55 | 12.99 |
| Primates | Plecturocebus ornatus | 400−500 | ||||
| Primates | Aotus zonalis | 0−1500 | ||||
| Primates | Aotus brumbacki | 100−1500 | ||||
| Primates | Aotus griseimembra | 0−1500 | ||||
| Primates | Pithecia milleri | 200−500 | ||||
| EP2: Lowland and sub-Andean, large dispersal capability | Primates | Ateles fusciceps | DF | 0−2000 | 570.75 | 95.56 |
| Primates | Ateles belzebuth | 0−1300 | ||||
| Perissodactyla | Tapirus bairdii | 0−1000 | ||||
| EP3: Andean and high Andean, small and medium dispersal capability | Rodentia | Dinomys branickii | DF-RF-FF | 300−3400 | 17.06 | 16.52 |
| Rodentia | Coendou vestitus | 1300−2500 | ||||
| Primates | Aotus lemurinus | 1500−3200 | ||||
| Primates | Ateles hybridus | 0−2500 | ||||
| Primates | Alouatta palliata | 0−2300 | ||||
| EP4: Andean and high Andean, large dispersal capability | Perissodactyla | Tapirus pinchaque | DF | 1400−4000 | 740.60 | 108.86 |
| Carnivora | Lycalopex culpaeus | 2000−3700 |
Mean home range variation (ha): EP1 (min: 3.3, max: 23.4), EP2 (min: 205.0, max: 903.5), EP3 (min: 2.5, max: 30.7), EP4 (min: 650.0, max: 801.0).
Maximum dispersal distance=40* ( mean home range) (Bowman et al., 2002). Used as patch-to-patch distance corresponding to probability 0.0001 (see Box1 equation 2).
To assign the species to a specific ecological profile, we considered two factors: (1) the maximum altitude value they occupy as for their specific altitudinal range, and (2) the preferred land cover, following the classification by Rodríguez-Eraso et al. (2006) where Andean ecosystems are reviewed and described. The term “sub-Andean forest” was used by Cuatrecasas (1958) to define the humid forests between 1000 and 2400 m. Furthermore, Cuatrecasas (1939) described the limits of the Andean forests as being between 2400 and 3000 m, and the high Andean between 3000 and 3300 m. The resulting ecological profiles are presented in Table 1.
Definition of habitat patches and nodesHabitat patches are defined as adjacent areas that meet specific habitat requirements for a target species; they represent unique zones where species can reproduce, find prey supply, and shelter (Wade et al., 2015). We identified potential habitat patches for our connectivity analyses by selecting the patches of preferred land cover and the targeted altitudinal ranges for each ecological profile. The patches of preferred land cover were obtained from the national map of land cover types for Colombia (IDEAM, 2021) at a scale of 1:100,000. To facilitate the overall analysis, we reclassified the original 54 categories of land cover into 13 different classes. Elevation data was derived from satellite images obtained from the NASA Shuttle Radar Topography Mission (NASA JPL, 2013) with a resolution of 30 m. We reclassified the elevation data into 7 categories. Altitudinal ranges for each species were obtained from the database “Mamíferos de Colombia, version 1.12” (Ramírez-Chaves et al., 2021). Subsequently, we overlapped the resulting potential habitat patches with the National System of Protected Areas for Colombia (SINAP).
Finally, we defined nodes inside these habitat patches within PAs as the starting and ending points of potential movements of individuals of the target species. As a general rule, we placed one node in the centroid of each habitat patch. However, in the study area there are some protected areas and patches disproportionally big in relation to the others and placing just one node in their centroid could bias the spatial definition of the movement routes. Therefore, we created a grid with a cell size of 50 × 50 km and intersected it with the selected habitat patches. In these specific cases, we considered intrapatch connectivity in our analyses (sensu Saura and Rubio, 2010) by assuming each grid cell within the large forest patch to represent one independent node for subsequent analyses.
Creation of resistance surfacesFor the generation of resistance surfaces, we considered two environmental variables: land cover type and elevation. These layers were parameterized by assigning a cost or resistance value to each 1 × 1 km pixel across the study area, where low resistance represents ease of movement, and high values denote restriction to movement. Empirical data for the species, such as presence-absence points, capture pathways, or genetic data are lacking, therefore, a one-stage expert’s consultation approach was used, where the expert’s opinion is considered to derive the final resistance surface (Zeller et al., 2012).
A group of 22 experts on Colombian mammals was contacted to participate in the parameterization of resistance surfaces. To collect the expert’s opinion, we created a questionnaire with the categories of land cover type and altitudinal ranges. We asked species’ experts to assign resistance values to each combination of species-landcover and species-altitude categories. Resistance values ranged from 1 to 100, with 1 representing the habitat for the species and 100 the maximum resistance to movement; it was also possible to assign a value of 1000 to those categories that the experts considered insurmountable barriers to movement (e.g., the Andean range for lowland species). The results obtained from the questionnaires were averaged for land cover type and altitude categories within each ecological profile.
For this study, we assumed that species select residence habitat with the same criteria as dispersal habitat. Furthermore, it is important to notice that although resistance values were assessed individually for each species, these values are intended to represent resistance to movement for a group of species, in this case an ecological profile, and do not pretend to model the dispersal behavior of a single species.
Potential corridors and prioritizationTo model potential movement routes among habitat patches, we first applied a Least Cost Path (LCP) analysis using the Linkage Mapper toolbox (McRae and Kavanagh, 2011 ), and then assessed the priority of each resulting corridor within a conservation scenario by using the software Conefor 2.6 (Saura and Torné, 2009).
In the LCP analysis, adjacent nodes were identified based on both cost of movement (given only by the resistance layer of each ecoprofile) and shortest euclidean distance. If two nodes were not adjacent by cost-weighted distance, the shortest euclidean distance was considered. It is important to clarify that, for this step, we did not set a limit to the cost of movement or distance when we ran the analysis, because we wanted to construct a thorough network identifying all the potential corridors connecting adjacent habitat patches.
We refer to the LCPs as corridors, although we acknowledge that these lines would be more accurately regarded as the central axes of the swaths of land around which movements are more likely to occur. After identifying all the corridors between adjacent nodes, we assessed the priority of each within a conservation scenario. This assessment was based on their significance for maintaining habitat availability at the landscape scale, considering the study area as a whole. For this prioritization we applied the Probability of Connectivity index (PC) (Pascual-Hortal and Saura, 2006; Saura and Pascual-Hortal, 2007; Saura and Rubio, 2010). Each corridor was ranked within the corresponding ecoprofile according to the decrease of the PC index value after its removal (dPC) (see Box 1).
To parameterize the dispersal capability in the Conefor calculations, for each ecoprofile we took the maximum dispersal distance across all its species. This distance can be regarded as a dispersal event of exceedingly low probability and accordingly we set its probability to 0.0001 (see Box 1, equation 2). We estimated the dispersal distance of each ecoprofile using the equation proposed for mammals by Bowman et al. (2002). Subsequently, we transformed these distances into cost units by multiplying the mean cost value extracted from the corresponding resistance surface (see Cost Weighted Distance in Appendix A Table A3).
We selected as priority corridors for each EP the 30% of the LCPs with the highest dPC values, assuming these could potentially constitute the backbone for a national connectivity strategy. Then, we assessed the landscape context around these corridors. For that, we created a buffer of 2 km around all of them (following Beier, 2019), namely corridor swaths, and extracted data about the land cover types and potential human disturbances through the Human Footprint Index (HFI) (Correa Ayram et al., 2020) within these swaths.
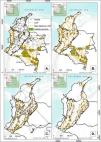
ResultsHabitat patches and nodesThe habitat patches identified for the lowland and sub-Andean ecological profiles (EP1 and EP2) were distributed across all five Colombian biogeographical regions, with larger habitat patches located in the Amazon (see Fig. 1A and B). The smallest mean habitat patch size was identified for Andean and high Andean small-medium dispersal ecoprofile EP3 (12,000 ha), for which we only identified a few isolated suitable habitat patches in regions other than the Andes (Fig. 1C). In the Andean region the EP4 habitat patches were mainly distributed along the eastern and western slopes of the mountain range, and the Caribbean nodes were inside the NNP Sierra Nevada de Santa Marta (Fig. 1D). The figures and summary tables for each ecoprofile can be found in Appendix A Figure A1 and Table A2.

Least Cost Paths (LCPs), calculated based on resistance layers for each ecoprofile, linking adjacent nodes (gray dots) of forest habitat patches (green polygons). Gray lines represent the LCPs that surpassed the maximum dispersal distance of the ecoprofile (see Appendix A Table A3) while yellow lines indicate those potential corridors where Cost Weighted Distance (CWD) and Euclidean distance do not exceed those maximum dispersal values. A. Ecoprofile 1: Lowland and sub-Andean small and medium dispersal capability; B. Ecoprofile 2: Lowland and sub-Andean large dispersal capability; C. Ecoprofile 3: Andean and high Andean small and medium dispersal capability; D. Ecoprofile 4: Andean and high Andean large dispersal capability.
The experts’ questionnaires had a return rate of 32% (7 experts out of 22). In general, for all ecoprofiles, experts predicted high resistance for urban areas, zones without vegetation, agiculture, agricultural mosaics and pastures (see values in Appendix B). Furthermore, the land cover plantations had high values especially for EP1 and EP3. Water land covers were all set with a value of 1000 as insurmountable barriers.
Other non-forest land covers, like grasslands and shrublands as well as secondary vegetation, were parameterized with values around 30 and 50, which allows for medium permeability in areas with these types of land covers. Evidently, EPs 1 and 2 had lower resistance for lowland areas and the opposite was true for EPs 3 and 4, as shown in Appendix A Figure A2.
Our results showed an extensive network of potential corridors between selected nodes for each ecoprofile, which had average lengths ranging from 70 to 100 km (see Fig. 1). A great number of potential corridors were identified inside large habitat patches, especially for lowland and sub-Andean ecoprofiles (1586 and 942 corridors, respectively; Fig. 1A and B). The ecoprofile EP2 showed the highest average length of corridors among all, with values around 100 km. Most corridors for EP3 (1332 in total) concentrated over the Andean region, however, our analysis also showed a few isolated potential corridors linking habitat patches from the Orinoquia region to the Andes (see Fig. 1C); these potential corridors are about 500 km long and it would be virtually impossible for the species of this ecoprofile to use them, since they have small and medium dispersal capabilities and there are not habitat patches that could act as stepping stones between the nodes that these corridors link. Lastly, the ecoprofile EP4 presented the lowest number of potential corridors (571 in total) with an average length of 79 km, these are located mainly in the western and eastern slopes of the Andean Mountain range (Fig. 1D).
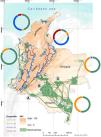
Priority corridor’s swathsWe identified a large proportion of priority corridors for EP1 (as ranked by dPC values) within the Amazon, Orinoquia and Pacific regions (53%, 55%, 83% of the region’s total priority corridors, respectively). Some of these corridors were concentrated inside large habitat patches, especially those located within PAs of the Amazon region, such as: National Natural Park (NNP) La Paya (A), NNP Serranía de Chiribiquete (B), NNP Sierra de la Macarena, Tinigua, Picachos (C), and Natural reserve Nukak (D) (see Fig. 2). Similar results were obtained for species grouped in EP2. The priority corridors of ecoprofile EP3 were mainly located in the Andean, Caribbean and Pacific regions, showing the lowest average length among all ecoprofiles (around 43 km). Lastly, we identified several priority corridors for ecoprofile EP4 connecting habitat patches within the Andean and Caribbean region. For the latter, the corridors were located especially inside NNP Sierra Nevada de Santa Marta and the eastern slope of the Andean region (see Northeast area Fig. 2).

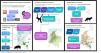
Priority corridors for conservation represented over the values of the Human Footprint Index (Correa Ayram et al., 2020). Colored lines represent the central axis of the potential priority corridors obtained from the prioritization analysis in Conefor (top 30% dPC values for each ecoprofile; see details in Box 1). The colored doughnuts show the percentage of the 2-km corridor’s swaths within each biogeographic region that corresponds to each ecological profile. Labels: A. National Natural Park (NNP) La Paya; B. NNP Serranía de Chiribiquete; C. NNP Picachos, NNP Tinigua, NNP Sierra de la Macarena; D. Natural reserve Nukak.
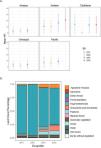
Overall, all priority corridors were located in areas with low HFI, showing mean values ranging from 1 to 20. The highest values of HFI were concentrated in the Andean region (see Fig. 3A), especially for Andean species with small, medium, and large dispersal capabilities (EP3 and EP4).

(A) Human Footprint Index (HFI) (Correa Ayram et al., 2020) values within the 2-km priority corridor's swaths identified to connect protected areas, detailed by ecoprofile (EP) and biogeographic region (mean values as circles and standard deviation as lines). (B) Percentage of Land Cover type (IDEAM, 2021) within 2-km corridor’s swaths by ecoprofile (EP).
The corridors within the Caribbean region also exhibited HFI values similar to the corridors located in the Andes, except for EP2 which showed a much lower value of HFI (see Fig. 2A). On the other hand, the corridors located in the Amazon and Orinoquia region traversed through areas with very low values of human pressure (mean HFI of 2–3).
The priority corridors swaths traversed mainly through dense forests, with percentages of area above 90 % for lowland and sub-Andean species (EP1 and EP2), and above 50 % for Andean and high Andean species (EP3 and EP4). For the latter, priority corridors traversed through other land cover types such as agriculture mosaics, grasslands, secondary vegetation, and pastures, with values around 20% of the total area (see Fig. 3B).
DiscussionOur results suggest that maintaining intra-patch connectivity within large PAs across the lowland and subandean zones is key to promote overall forest connectivity, as these areas greatly contribute to the provision of habitat availability at the national scale; this is especially evident for ecoprofiles 1 and 2 (see Fig. 2).
On the other hand, for the species inhabiting Andean and high Andean forests (EP3 and EP4), it seems more important to reduce the overall landscape resistance of the matrix (e.g., through forest restoration), especially in the Andean and Caribbean region (see Fig. 3A). Currently, the movement between habitat patches for these ecological profiles has significant cost, since the landscape is highly anthropized and dominated by land covers highly inhospitable for species dispersal (e.g., agricultural areas and grasslands). Our study provides a suitable parameterization of resistance surfaces based on expert knowledge and prioritization of potential corridors for a set of representative threatened mammals in Colombia, that could be further used in other countries where these species inhabit. Furthermore, by carrying out a LCP analysis we focused on single high-quality paths, which we consider as the more practical approach for implementing conservation strategies at the national scale.
Given the alarming deforestation rates experienced in recent years in the Amazon region (IDEAM & MINAMBIENTE, 2021), and its contribution to habitat availability of the national network of PAs, the conservation of well-connected large habitat patches becomes a matter of great importance. Deforestation has highly impacted the PA National Natural Park Serranía de Chiribiquete, with more than 6000 ha deforested since its expansion in the year 2018 (Finer and Mamani, 2022). It is worth noting that, our study identified a large proportion of priority corridors in this area (see Fig. 2). Other PAs for which we identified potential priority corridors were deforestation hotspots in the first trimester of 2022 (IDEAM & MINAMBIENTE, 2022). This is the case of Tinigua and La Paya NNP as well as the Natural Reserve Nukak (see Fig. 2). Furthermore, Murillo-Sandoval et al., 2022 found hotspots of connectivity loss in the Andes Amazon transition belt (AATB), and inside PAs such as NNP Tinigua. Our prioritization of corridors may support a strategy to enhance the connectivity of this region and select conservation areas that can ensure the dispersal of endangered species, such as the white-bellied spider monkey (Ateles belzebuth) and umbrella species like the mountain tapir (Tapirus pinchaque).
The Andean region is one of the most densely populated in Colombia, having recently experienced high rates of forest loss and fragmentation (Castillo et al., 2020). These changes to forested areas may explain why the average size of suitable habitat patches for EP3 and EP4 was smaller than for EP1 and EP2, and overall, the landscape resistance values across Andean zones was on average higher than across the Amazon or Pacific regions due to a higher prevalence of non-forest land covers (this is also evident for the mean values of HFI; see Fig. 3A). The loss and fragmentation of forest ecosystems in Andean landscapes resulting from agricultural expansion is particularly evident in the central Andean Mountain range. In addition to the absence of suitable habitat for species movement across the landscape, this area faces significant anthropogenic pressure, which has already led to human-wildlife conflicts involving species of high conservation concern, particularly carnivores like the jaguar and the Andean bear (Hohbein and Nibbelink, 2021; Zárrate-Charry et al., 2018). Species’ pressures in this area are projected to increase in the near future: climate change will force them to move across altitudinal belts to track their climatic niche at a larger speed than ecological and evolutionary processes allow, leading to an overall reduction of species ranges, environmental filtering and biodiversity loss in these areas (Báez et al., 2016; Galván-Cisneros et al., 2023; Tovar et al., 2022). The designation of corridors along with forest restoration programs will be key to facilitate species adaptation to climate change and potentially mitigate some of the projected impacts to Andean Forest biodiversity.
The limited number of corridors identified for the Caribbean region may be attributed to its high resistance to movement for different ecoprofiles. This region is known for having a minimal presence of PAs and limited connectivity with the tropical Andes ecoregion (Castillo et al., 2020). Furthermore, forests of this region are particularly threatened by cattle ranching and the expansion of agriculture (Zárrate-Charry et al., 2018). The scarcity of priority corridors in this area can be related to the prevalence of other land cover types that generate medium and high resistances, such as pastures, shrublands and grasslands. However, we have identified priority corridors within the NNP Sierra Nevada de Santa Marta. This PA plays a key role in conserving biodiversity for this region and has been recognized as one of the world’s most irreplaceable PAs for conservation of mammals, birds, and amphibians (Le Saout et al., 2013).
Our research might be understood as an initial national assessment and prioritization of potential corridors with a multispecies approach, and our results can be used to prioritize areas where more detailed studies for conservation actions are needed. We acknowledge that the preferred land covers and dispersal distances considered in our parameterization might not be representative of the ecological needs of all the species within a given ecological profile. Also, that further sensitivity analyses regarding the selection of habitat patches and nodes might be needed (e.g. minimum size, type of forest). Yet, the focal species approach used here has allowed us to identify a network of priority potential corridors between PAs for Colombian mammals, considering a set of representative species of conservation interest. Despite our analyses focused on forest patches inside PAs only (main target of current conservation efforts at the national level) here we call for the need to also consider the specifics of forested areas outside PAs when designing ecological corridors (here only considered through resistance values), as they could play as important nodes to maintain overall connectivity at the national level (especially for species inhabiting areas where PAs are scarce and forest is highly fragmented – i.e., Andean and high Andean forest species). We used the official and most recent land cover map for Colombia (IDEAM, 2021), and we believe that at the national scale this land cover data source is adequate to model the main potential corridors for conservation. However, for future studies, a higher resolution map could contribute to better identify barriers for movement at smaller scales, as well as identifying new nodes and habitat patches to refine the LCP analysis.
Our methodological approach could be used to revisit the designation of corridors in an adaptative way. Global warming's intensifying impacts present substantial risks for habitat displacement, critically affecting the conservation efforts in Colombia's forests. As temperatures rise and climatic conditions shift, we anticipate significant alterations in the distribution patterns of both species and ecological communities. Climate velocity can be defined as a proxy measure of the speed and direction a species would need to move to maintain its current climatic conditions (thermal preferences) under climate change (Brito-Morales et al., 2018). Consequences of increasing climate velocity are predicted to be more pronounced in lowlands (Amazonia and Orinoquia) where species might need to move larger distances to maintain their climatic niche (Suárez-Castro et al., 2020; Torres-Amaral et al., 2023; see supplementary material Appendix A Figure A3). Andean forests are susceptible to substantial area contraction under climate change scenarios and to biodiversity loss (Báez et al., 2016; Tovar et al., 2022). These changes may lead to potential mismatches between the currently designated protected areas, the hereby proposed network of priority corridors, and the emerging biodiversity hotspots. Therefore, it is imperative to modify conservation strategies swiftly and effectively. Conservation interventions should be dynamic, acknowledging the potential changes in species distributions and ecological zones. Corridors must be adaptable, designed to be periodically reassessed and modified in response to climatic shifts, land use changes, and other disturbances. An integrated strategy is required, one that addresses current biodiversity needs while remaining adaptable to the unpredictable, yet certain impacts of climate change on these essential habitats. Proactive planning is essential to maintain the resilience and long-term viability of the Colombian forests, which are not only crucial for biodiversity conservation but also for the sustainability of local human communities.
Author contribution statementSara Pineda-Zapata: Conceptualization, Methodology, Validation, Formal analysis, Investigation, Writing – original draft, Writing – review and editing, Visualization. Sergio González-Ávila: Conceptualization, Methodology, Formal analysis, Writing – review and editing, Project administration. Dolors Armenteras: Investigation, Writing – review and editing, Supervision. Tania Marisol González-Delgado: Investigation, Writing – review and editing, Supervision. Alejandra Morán-Ordoñez: Conceptualization, Methodology, Writing – review and editing, Project administration.
FundingSPZ was supported by MSc European Forestry programme under Erasmus Mundus Joint Master Degrees (EMJMD): Agreement number-2019-1483/001-001.
Declaration of competing interestThe authors declare that they have no known competing financial interests or personal relationships that could have appeared to influence the work reported in this paper.
BOX 1
The Probability of Connectivity (PC) index and dPC values to rank landscape elements.
PC is a landscape-level connectivity index that involves modelling the landscape using a weighted graph structure, where habitat patches are represented as nodes and functional connections between them (such as corridors) as edges. It is expressed as:
where ai and aj are the areas of the habitat patches i and j, pij* is the maximum product probability of successful dispersal between patches i and j, and AL is the total landscape area, including both habitat and non-habitat area. A path is regarded as comprising a sequence of steps involving direct movements between pairs of patches, with each patch being visited once. The product probability of a path is the product of all pij values associated with each step in that path (pij: probability of each step or direct dispersal between i and j without traversing any other intermediate habitat patch).
When data on the pij values are lacking, a common procedure is to measure interpatch distances (Euclidean or minimum cost) and convert them to probabilities using a decreasing exponential function:
where dij is the patch-to-patch distance and k is a constant dependent upon the dispersal capability of the organism considered. Therefore, this is a functional index that depends both on the configuration of habitat patches and the organism under consideration.
The formulation of PC incorporates the concept of habitat availability at the landscape scale. This entails viewing a patch as an area where complete connectivity exists, and subsequently integrating into a single measure the connected area within habitat patches (intrapatch connectivity, given by the terms where i = j and thus pij* = 1) with the area reachable through connections to other patches (interpatch connectivity, given by the terms where i≠j).
Furthermore, it can also be applied to operational analyses aimed at identifying those elements (patches or connections) whose absence would result in a more significant reduction in overall landscape connectivity (i.e., priority elements for maintaining the connectivity of the whole network in terms of habitat availability). The dPC values are the drop percentages of the PC index after removing a specific element, which reflects the conservation value or importance of that element. For the element k, dPCk is given by:
where PC is the value obtained when all the current landscape elements are present and PCremove,k is the PC value after the removal of the k element from the landscape.
We would like to thank the experts who provided estimates on landscape resistance for different forest species for their time and help: Sebastián O. Montilla, Ángela Alvis, José F. González-Maya, Thomas Defler, Johanna Alejandra Villota Mogollón, and Diego Lizcano. We also want to thank the research group ADAPTAFOR (University of Lleida, Spain) for facilitating the computational tools needed to carry out part of our analyses. We are also grateful for the comments provided by the editor and two anonymous reviewers which greatly helped us improve our manuscript.
The following are Supplementary data to this article: