


The small size, degree of isolation, and particular evolutionary processes occurring in islands make them highly diverse and an essential target for conservation. For the same characteristics, they are also extremely vulnerable to human-mediated disturbances. During the last centuries, nearly 80% of species extinctions have occurred on islands. While there is information on the human threats, level of protection, and conservation importance of islands, an integrative picture combining these aspects and aimed at determining conservation priorities to inform decision-making is still missing. Here, we jointly analyzed these three aspects producing a worldwide island conservation assessment based on terrestrial vertebrates. Considering the Aichi target of >17% of protection and all protected area categories, we found that 5397 islands, encompassing a quarter of the worldwide island area, face high human modification and have a low level of protection, with 33% of them showing extreme levels of human modification. Also, if we were to consider the new threshold of protected area coverage proposed to accurately protect the world’s biodiversity and ecosystems (Nature Needs Half initiative), 77% of the world’s islands would face this dramatic scenario. Furthermore, most large islands harboring the highest number of threatened vertebrates are found on this critical situation (low protection and high human modification). Based on the analysis of these conservation scenarios, we identified potential priority islands that provide opportunities to improve island conservation worldwide. The mbest opportunities are located in 58 islands with a low level of protection and human modification, which harbor more than 5 threatened vertebrates’ species and are located in different regions of the world.
The paramount importance of conserving island biodiversity is not novel (Myers et al., 2000). Island biodiversity results from unique evolutionary processes that have generated singular life forms, including several endemic species (Whittaker and Fernandez-Palacios, 2007). Islands have also been essential for science development, offering realistic scenarios for thinking, proposing, and testing ecological and evolutionary theories (Vitousek, 2002). However, the characteristics that make islands unique (i.e., small size, isolation, high biodiversity, singular evolutionary routes) also make them fragile and vulnerable to human-mediated disturbances.
During the Anthropocene, islands have undergone a dramatic process of continuous changes (Nogué et al., 2021). For instance, since the European expansion, 75% of the known extinctions have occurred on islands, which is also where almost half of the threatened terrestrial species are currently found (Fernández-Palacios et al., 2021; Ricketts et al., 2005). Recent estimations show that half of all species inhabiting islands are currently threatened with extinction due to multiple and synergistic human threats (Leclerc et al., 2018). Among the most important drivers of species extinctions and population declines in islands are biological invasions, wildlife exploitation, and agricultural expansion (Fernández-Palacios et al., 2021; Jones et al., 2016; Leclerc et al., 2018). Indeed, islands are now known as the Anthropocene’s "centers of defaunation" (Russell and Kueffer, 2019; Veron et al., 2019), with disrupted ecological interactions and altered ecosystem functioning, becoming the focus of significant conservation efforts worldwide (Jones et al., 2016; Veron et al., 2019).
Protected Areas (PAs) play a key role in the conservation and sustainable use of island biodiversity (Rees et al., 2018). Indeed, PAs are critical for maintaining wildlife populations at sustainable levels (Gray et al., 2016) and guaranteeing human well-being by providing many ecosystem services, such as water yield (Rasolofoson et al., 2017), as well as having a positive social impact on people (Díaz et al., 2019). PAs are also critical nature-based solutions for climate change adaptation (Prieto-Torres et al., 2021). Nevertheless, PAs still suffer from unplanned human modifications (Jones et al., 2018) and several management issues that hinder their effectiveness (Watson et al., 2014). Considering island PAs, worldwide island PA coverage has reached, on average, the Convention on Biological Diversity´s Aichi Target 11 (>17% of protection) (Mouillot et al., 2020). However, nearly half of the world's islands remain entirely unprotected (Mouillot et al., 2020).
A recent review study summarized the current scientific knowledge about the ongoing biodiversity loss on islands worldwide and suggested an extremely worrying forecast for island biodiversity (Fernández-Palacios et al., 2021). Several other studies on the conservation value, human threats, and level of protection in islands have also been recently conducted (e.g., Whittaker & Fernandez-Palacios 2007; Gray et al., 2016; Jones et al., 2016; Mouillot et al., 2020). However, a global assessment that jointly considers all this information and shows a complete picture of island conservation based on their current human modification, degree of protection, and conservation value while identifying unique opportunities to improve such picture is still lacking. Here, we present such an assessment by mapping and classifying the world’s islands relative to their combined human modification, and PA coverage level while considering their size and number of threatened terrestrial vertebrate species. In doing so, we go beyond confirming that islands are hotspots of biodiversity and threats by describing different scenarios of pressure and protection, which allowed us to define priority islands where conservation actions could be extremely helpful to halt island biodiversity loss.
MethodsIsland polygons were downloaded from the global island explorer project developed by the U.S. Geological Survey (USGS) in partnership with Esri (Sayre et al., 2019). This resource contains vectorial information of island characterization worldwide developed by analyzing a recent 30-m spatial resolution global shoreline vector derived from annual composites of 2014 Landsat satellite imagery (Sayre et al., 2019). We selected from the database only those islands in the ocean (i.e., we did not consider the continental mainland, thus excluded e.g. lake islands) with an area equal to or greater than 1 km2. We did not consider smaller islands given that the spatial resolution of some of the original data (e.g. Human Modification index) precluded us from obtaining accurate information at such finer resolutions (Watson et al., 2016). These smaller islands represented less than 0.4% of the world’s total island area. In addition, we removed other small islands, corresponding to 0.3% of the area covered by the islands equal/larger than 1 km2 and for which the Human Modification Index was not calculated or available. Our final dataset of islands encompassed 22,471 individual islands, corresponding to more than 99% of the world’s total island area (Sayre et al., 2019). We gathered the following information for each of these islands: area (km2), human footprint, number of threatened terrestrial vertebrates, and the percentage of PA coverage.
Human Modification Index. To estimate the degree of human modification on each island, we used the most recent and comprehensive global map of human modification on the environment from the last estimation of the global human modification index of terrestrial systems (HMI) (Kennedy et al., 2019). HMI provides a cumulative measure of human modification of terrestrial lands based on modeling 13 anthropogenic stressors and their estimated impacts using spatially-explicit global datasets at a resolution of 1 km2. The considered human stressors can be categorized as describing (a) human settlement (population density, built‐up areas), (b) agriculture (cropland, livestock), (c) transportation (major roads, minor roads, two tracks, railroads), (d) mining and energy production (mining, oil wells, wind turbines), and (e) electrical infrastructure (powerlines, nighttime lights). These human stressors are directly linked to constraints on and declines of biodiversity (Kennedy et al., 2019). Importantly, compared to previous indices of human modification (e.g. Human Footprint; Venter et al., 2016), HMI includes a greater coverage of transportation infrastructure that is known to trigger human encroachment and accelerate ecosystem degradation. The score of HMI ranges from 0 (no human modification) to 1 (high human modification) for each 1 km2 pixel. We overlapped the HMI map with the island's shapefile and calculated the average and standard deviation values of human modification for each island using the zonal statistic tool of QGIS (QGIS.org, 2021). To estimate a threshold indicating a high human modification, we followed Jones et al. (Kendall R Jones et al., 2018) and calculated the mean value of HMI on pasture lands as a reasonable threshold when land faces significant human activity and species are likely to be threatened by habitat conversion (Watson et al., 2016). Then, we divided islands into those with high human modification (>0.2) and those with extreme human modification (>0.4). The latter value represents the average HMI in the 10 grassland ecoregions with the highest average values for this index.
Protected Areas. Data on island protected areas were obtained from the 2020 World Database on PAs (IUCN and UNEP, 2020). Following similar global studies (e.g., Jones et al., 2018), we extracted PAs from the WDPA database by selecting those areas that have a status of "designated", "inscribed", or "established". Given the uncertainty associated with their existence and performance, we did not consider “adopted”, “non-reported” and “proposed” categories. We included only PAs with detailed geographic information, excluding those represented only as a point locality. Many PAs overlapped spatially, but contained different IUCN categories, thus we ‘dissolved’ overlapping PAs into a single polygon, assigning overlapping areas the strictest IUCN category of all PAs in that location. Considering that PAs have different management goals, we considered all PAs categories (categories I to VI), including those with strict and non-strict conservation goals, considering that non-strict management categories are fundamental to achieving effective conservation complementing the strict categories. We overlapped the final layers of PAs onto the map of the world's islands using the join attributes by location tool of QGIS. Then, we estimated (i) the percentage of each island covered by PAs; (ii) the average coverage of PAs of each island category (see details of categories bellow: Additional analyses section); (iii) the percentage and mean area of islands without PAs worldwide and on each island category. Based on the 17%-target of land protection proposed by the Convention on Biological Diversity (i.e., Aichi Target 11), we classified islands according to their level of protection as either "protected" (more than 17% covered by PAs) or "poorly protected" (less than 17%). We defined islands as poorly protected following the threshold imposed by Aichi Targets instead of the new threshold suggested by the OECD (2020) mainly because the latter was proposed as a goal to be reached by 2030, and our aim here was to define under-protected islands with our current baseline (which, in fact, should have already been achieved).
Threatened vertebrate species. We downloaded a complete list of species, including additional information such as their IUCN RedList category, for amphibians, mammals, reptiles, and birds. These taxa are arguably the best known, both in terms of data and conservation assessment, allowing us to provide an informative assessment of the world’s islands. Information on these taxa was obtained from different sources: the IUCN database (IUCN, 2021), Birdlife International Database (www.birdlife.org), and a recent global assessment on reptile distribution (Roll et al., 2017). Then, we selected those terrestrial vertebrate species in the following IUCN categories: vulnerable (VU), endangered (EN), and critically endangered (CR), totaling 5970 terrestrial vertebrates, 2099 amphibians, 1261 reptiles, 1438 birds, and 1172 mammals. After, using the shapefile of islands and the list of species, we obtained from the GBIF database all the individual occurrence records of threatened vertebrates present in our complete set of islands. To do so, we used the occ_data function from the rgbif R package (Chamberlain et al., 2021) that allows searching occurrence data given a polygon. For each island polygon and species name in the list, we downloaded all available records within that island. Using QGIS, we generated a shapefile of points containing the complete set of GBIF occurrences of threatened terrestrial vertebrates across islands. We then used the join attributes by location tool of QGIS (QGIS.org, 2021) to count the number of unique threatened species overlapping each island. (Ficetola et al., 2014)
Additional analyses. To illustrate the current panorama of species diversity, protection, and human modification across the world's islands, we classified islands into six different categories (Fig. 1): (1) islands with low protection (PAs coverage <17%) and low human modification (average HMI < 0.2; hereafter LPLM), (2) islands with low protection and high human modification (average HMI > 0.2; LPHM), (3) islands with low protection and extreme human modification (average human modification <0.4; hereafter LPEM), (4) islands with high protection (PAs coverage >17%) and low human modification (HMI < 0.2; HPLM), (5) islands with high protection (PAs coverage >17%) and high human modification (average HMI > 0.2; HPHM), and (6) islands with high protection and extreme human modification (average HMI > 0.4; HPEM). For each scenario, which can be seen as quadrats in Fig. 1, we computed the total number of islands, their summed and average area, and the mean and absolute number of threatened vertebrate species occurring on these islands. Note that while these scenarios were analyzed individually, to illustrate the observed patterns we combined the scenarios of high and extreme human modification in our figures but used different colors to depict each scenario.
 Low Protection (<17%) and High (HMI > 0.2) and Extreme Human Modification (HMI > 0.4); (2) High Protection and High and Extreme Human Modification; (3) Low Protection Low Human Modification; and (4): High Protection Low Human Modification. The size of the dots illustrates the area of each island. Percentages in the figure point out the relative area of islands belonging to each quadrant for each scenario (considering only strict PAs and all of them).")
Maps of the analyzed scenarios of island PA coverage and human modification.. Dots’ size represents the threatened species richness of each island. (1) Low Protection (<17%) and High (HMI > 0.2) and Extreme Human Modification (HMI > 0.4); (2) High Protection and High and Extreme Human Modification; (3) Low Protection Low Human Modification; and (4): High Protection Low Human Modification. The size of the dots illustrates the area of each island. Percentages in the figure point out the relative area of islands belonging to each quadrant for each scenario (considering only strict PAs and all of them).
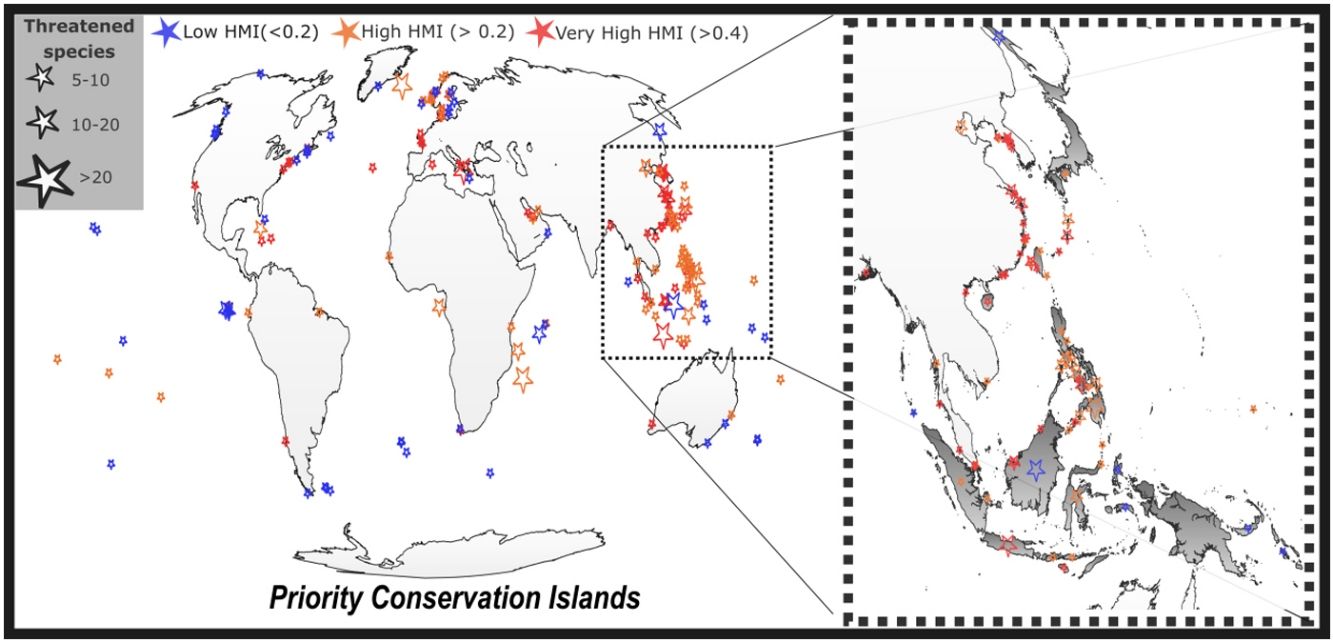
Finally, we identified priority conservation islands as those with a high richness of threatened vertebrate species and a low level of protection and where a potential increase in their PAs coverage (among other conservation policies) is urgent and would be useful to improve conservation picture across the world. To do this, we used QGIS to identify those low protected islands (<17%) harboring at least 5 confirmed threatened terrestrial vertebrates. We mapped these priority conservation islands, by grouping them based on their level of human modification (very high >0.4; high >0.2 and low <0.2). Then we ranked each group based on their number of threatened vertebrate species.
ResultsOur dataset included 22471 islands with a mean area of 449.81 km2 and an average human modification index of 0.15/island. We found that 6853 islands (30.5% of all islands analyzed) have a high human or extreme modification index (HMI > 0.2). Together, these islands with high human modification represented 32% of the total area covered by islands across the globe, from which 99% were included in our dataset. Of these highly threatened islands, 32% have an extreme human modification index (>0.4). 72% of our complete set of islands showed a low level of protection, considering PAs I-VI, lower than that suggested by Aichi Target 11. The total number of threatened vertebrate species occurring in the studied set of islands was 1039, ranging from zero to 75 species (Madagascar) in an individual island and an average of 17 threatened vertebrate species across islands (Table 1).
Details of the values calculated for each group of islands. LPHM: Low Protection (<17%) and High (>2); LPEM: Low Protection and Extreme Human Modification (>4) HPHM: High Protection and High and HPEM: High Protection and Extreme Human Modification; LPLM: Low Protection Low Human Modification (<2); and HPLM: High Protection Low Human Modification. Number: total number of islands; Percentage of islands: Percentage of the total number of islands; Total Area: Total Area covered by the islands; Mean Area: average area of the islands; Mean HMI: average value of Human Modification index; Mean Protection: average coverage of PAs; Without PAs: percentage of islands with complete absence of PAs; Mean area (Without PAs): average area of islands without PAs of each category. % area (Without Pas): Percentage of the area of each category covered by islands without PAs. Mean Threatened spp: average number of threatened terrestrial vertebrate species; Threatened spp: Total number of threatened species inhabiting each island category. HFP Change: average Change in the Human Modification Index of islands of each category.
| ALL | LPVHMI | LPHHMI | HPVHHMI | HPHHMI | LPLHMI | HPLHMI | |
|---|---|---|---|---|---|---|---|
| Number | 22471 | 1705 | 3692 | 466 | 990 | 10727 | 4323 |
| Percetage of island | 100% | 8% | 16% | 2% | 4% | 48% | 19% |
| Total area [km2] | 10107900 | 534354 | 1864790 | 635337 | 248692 | 3435610 | 3229250 |
| Mean Area | 449.81 | 313.00 | 505.00 | 1363.00 | 251.00 | 320.27 | 746.99 |
| Percentage Area | 100% | 5% | 18% | 6% | 2% | 34% | 32% |
| Mean HMI | 0.15 | 0.54 | 0.29 | 0.50 | 0.28 | 0.06 | 0.052 |
| Mean Protection | 23.00% | 0.95% | 0.39% | 72.00% | 82.00% | 1.50% | 90.00% |
| Without Pas | 70.28% | 86.28% | 94.37% | 0.00% | 0.00% | 96.91% | 0.00% |
| Mean area (Without PAs ) | 75 | 68.5 | 32.27 | 0 | 0 | 79.41 | 0 |
| % area (Without PAs ) | 12% | 19% | 6% | 0% | 0% | 24% | 0% |
| Threatened spp (mean) | 5.49 | 4.21 | 1.71 | 6.75 | 4.39 | 0.65 | 2.28 |
| Without threatened spp records | 88% | 70% | 86% | 57% | 71% | 94% | 0.875781 |
| Without threatened spp records (mean area) | 75 | 147 | 42.95 | 101 | 55.84 | 49.92 | 114 |
| Total number of threatened species | 1039 | 298 | 515 | 142 | 249 | 339 | 284 |
| 659 | 322 | ||||||
We found 3692 islands with low protection and high (LPHM), and 1705 a low protection and an extreme human modification. Together these categories represented 24% of our studied islands and 23% of the total area covered by islands worldwide. The average score of human modification index in these categories islands was 0.42 (SD = 3.1), when only islands with extreme human modification were considered the average HMI was 0.50. The average level of protection of LPHM islands was 0.39% and 0.95% in LPEM islands. Considering both categories, the 91.35% of these islands were small islands (average area 50.38 km2) with no PAs, which together represented 12% of the total surface covered by LPHM islands. These islands harbored 659 threatened vertebrate species, the highest number among our island categories, with 298 of the species in LPEM islands. Most of these islands, especially those harboring a high number of threatened vertebrate species, are concentrated in tropical areas, mostly in southeast Asia and Central America and east Africa, while others are surrounding Europe (Table 1, Figs. 1 and 2).

According to our findings, 990 islands presented high protection and high human modification (HPHM), and 466 islands showed high protection and extreme human modification (HPEM), comprising together 10% of our studied islands and 6% of the total area covered by islands worldwide. The average score of the human modification index in HPHM islands was 0.29 and 0.55 in HPEM islands. The average protection for these was 82% and 72%, respectively. The total number of threatened vertebrate species (with at least one confirmed occurrence record) in these categories of islands was 322, with 180 in HPHM and 142 in HPEM. Most of these islands, especially those with a high richness of threatened vertebrate species are located in Eastern Asia, Europe, and in a lesser extent in Central America (Table 1, Fig. 1 for details).
Islands with low protection and low human modification (LPLM) summed 10727 (the largest subset of islands in this study), comprising ∼48% of our studied islands and 34% of the total area of islands worldwide. LPLM average island area was 320.27 km2, with an average protection of 1.50%. Most importantly, 24% of the surface covered by these LPLM islands corresponded to islands without PAs and the 51% without PAs of strict conservation categories (i.e. I–IV). The mean Human modification index in these islands was very low 0.06. Although these islands encompassed the largest subset, they only hold a total of 339 threatened vertebrate species. LPLM islands are dispersed worldwide but show a concentration at the highest latitudes and in the north portion of Oceania (Table 1, Fig. 1).
Finally, we found 4323 islands with high protection and low human modification (HPLM), corresponding to ∼19% of our studied set of islands and 32% of the total area of islands worldwide, with a mean surface of 746.99 km2. The mean percentage of PA coverage on these islands was 90% and the mean Human modification index was 0.052. These HPLM islands harbored the lowest number of threatened vertebrate species (284). These islands are concentrated at high latitudes, those with the highest richness of threatened vertebrates are located in at south of Oceania (Table 1, Fig. 1).
We identified 196 priority conservation islands that could increase their PAs coverage. Of these, 58 showed a low HMI (<0.2), 71 a high HMI (>0.2), and 67 an extreme HMI (>0.4; Fig. 2). Priority islands with low HMI cover an area of 1021140 km2, showing a mean area of 17605 km2. The mean threatened vertebrate species richness on these priority islands of low HMI was 7.1, with eight of these islands having 10 or more threatened vertebrates. These priority islands with a low HMI are dispersed across the world. Priority islands of high HMI cover an area of 1597840 km2 with a mean area of 22504 km2. The mean threatened vertebrate species richness for these islands was 8.8, with 20 of them holding at least 10 threatened vertebrates. These islands are strongly concentrated in the southeast of Asia. Finally, priority islands of extreme HMI cover an area of 226384 km2, showing a mean area of 3378 km2. The mean threatened richness on these islands was 8.8, and 11 of them harbored at least 10 threatened vertebrates. These islands are concentrated in southeast of Asia and in a lesser extent surrounding Europe (Fig. 2).
DiscussionHere, we presented a global picture of the world's islands by jointly considering the current level of human modification, protection, and conservation value. The biotic changes triggered by human settlement on islands during the Anthropocene have been dramatic (Nogué et al., 2021), whereas our efforts to protect their biodiversity have been insufficient (Mouillot et al., 2020). We showed that more than 30% of the area covered by islands worldwide is characterized by a high human or extreme human modification and that almost 80% of these islands have low coverage of PAs, confirming a worrisome scenario for island biodiversity conservation (Fernández-Palacios et al., 2021). The PA coverage level in islands considering all PAs categories is acceptable (23%); however, it is important to note that almost half (46%) of the protected area corresponds to PAs of non-strict management categories. Notably, the largest tropical and subtropical islands, which harbor the highest number of threatened vertebrate species, fall within this scenario of low protection and high human modification. Overall, our findings identified four critical aspects that underline a pessimistic future for islands: (i) high variation in the level of protection among island regions, where the islands having high protection are those with the lowest richness of threatened vertebrates whereas most islands showed the opposite pattern (low protection and the highest richness of threatened vertebrates), supporting the hypothesis of high levels of protection in residual conservation areas and low levels in those potentially productive concerning economic activities (Devillers et al., 2015; Nori et al., 2017); (ii) while the total degree of protection of islands is acceptable under Aichi Target 11, almost half of the PA coverage corresponded to PAs that do not follow strict conservation goals; (iii) most large islands with high conservation value (important for threatened vertebrate species conservation) are under high or extreme human modification, and (iv) most islands with the highest richness of threatened vertebrate species are under the jurisdiction of poor or developing countries (sensu United Nations; World Economic Situation and Prospects (WESP) report).
Based on this complex conservation picture, we defined unique opportunities to improve island conservation. From our identified priority conservation islands (i.e. islands of low protection and high richness of threatened vertebrates), those showing low levels of human modification (58) are presumably the most important. This is because such islands harbor populations of threatened and endemic species, which are expected to be safe of the most important drivers of threat and so in better conditions. Also, given their low PAs coverage, conservation opportunities are greater for these priority islands than for those with higher levels of protection. Policies promoting designation of new PAs and sustainable managements, avoiding the most intensive/extractive human activities, could be a robust strategy to protect islands' biodiversity and prevent several extinctions. Conservation policies on these priority islands are imperative. Fortunately to some extent, these priority islands are dispersed around the world, which ensures the complementarity of threatened vertebrate species composition among them, ensuring opportunities to protect a major taxonomical and phylogenetic diversity in a reduced number of islands. While it is expected that this geographically disperse set of priority islands would cover a significant amount of phylogenetic diversity, mainly given its correlation with species richness, this may not be the case for functional diversity especially if we consider convergent evolutionary events as a frequent process among islands (Pascoal et al., 2014). In this context, future conservation assessments including evolutionary and functional information (e.g., Bolochio et al., 2020; Hidasi-Neto et al., 2019) could be useful to analyze additional relevant aspects concerning island conservation, and eventually improve policy-making.
The dark side of this is given by the fact that only four of them (see Fig. 2) are located in the most threatened region for island conservation, east and southeast of Asia, and so improving the conservation picture in this region should primarily focus on the identified priority islands of high (or extreme) human modification. The panorama for priority islands of high and extreme human modification is a bit different. The most important point is perhaps that the confirmed presence of a given threatened vertebrate species does not ensure that the species is still present or that its populations are still viable under such high and extreme human modification already present. In this regard, while these islands represent potentially important conservation opportunities given their potentially high richness of threatened vertebrate species, they should be strongly monitored before taking any conservation decision. Accordingly, we propose that these islands would represent priority research areas (see Refs. Nori et al., 2018, 2020), where actions aimed to improve the knowledge regarding threatened vertebrate species are imperative (e.g. confirm the presence of such species and gather knowledge on their current conservation status). Considering that major conservation efforts in the most threatened island region of the world (east and Southeast Asia) could be conducted in such highly modified islands, policy-making is urgently needed in this region.
Most islands highlighted as biodiversity hotspots (Myers et al., 2000) were immersed in the most vulnerable scenario: low protection and high (or extreme) human modification. The panorama is especially challenging in Southeast Asia, the largest tropical territory of islands and where most of the largest islands belonged to the LPHM scenario. This emblematic and unique group of islands, essential for nature conservation (Nori et al., 2020, Fernández-Palacios et al., 2021), belongs to developing countries and is exposed to intense and growing exploitation (ESA, 2020; Hughes, 2017). This direct exploitation, in synergy with many other human-mediated threats (Leclerc et al., 2018), suggests an imperative need to increase the PA network to reach (at least) the threshold indicated by the Aichi target. Note that while we considered the threshold imposed by Aichi targets, it has been subject to intense debate in recent years (Kennedy et al., 2019). Meanwhile, the Nature Needs Half (NNH) initiative suggests protecting 50% of terrestrial lands to accurately protect world’s biodiversity and ecosystems (Dinerstein et al., 2017), a perspective under which 77% of the islands worldwide would show a deficient coverage, even considering non-strict categories.
Human-mediated threats in islands (with alien species, agriculture, and wildlife exploitation highlighted as the most important) are many and synergistic, and so should be analyzed together (Leclerc et al., 2018). To account for a combination of human-mediated threats, we considered the Human modification index. While we used HMI as a single variable, it was specially developed to characterize the degree of human modification in a given region so that a direct association between this variable and the number and degree of human threats is expected (Kennedy et al., 2019). In addition, following the threshold suggested by Jones et al. (2018), our findings confirm that more than 30% of islands have undergone a high level of human modification showing an evident latitudinal geographic pattern with a concentration of islands with the highest human modification in tropical and subtropical regions. Considering that island species are particularly vulnerable to human impacts (Whittaker and Fernandez-Palacios, 2007), such a threshold applied to islands would determine that those islands with a value above it have a higher human impact than mainland regions with the same value. As such, our findings highlight the critical situation of LPHM islands as well as the great importance and urgent need of accurate managing PAs in HPHM islands. It is important to note that most of the PAs in LPHM islands correspond to non-strict conservation categories. Considering that this is the category of islands with the greatest levels of human modifications between 1993 and 2009, potential changes in management categories of most existing PAs across LPHM islands could improve this urgent situation by increasing their protection. There is an imperative need for future studies analyzing possibilities, with a high level of detail, to efficiently increase the level of protection of LPHM islands. For example, through the application of conservation planning protocols aimed at determining priority areas considering their complementarity and degree of human modification, among other relevant information.
Global climate change is a severe indirect human threat to biodiversity which cannot be omitted in this discussion. Looking at the climatic forecasts (IPCC, 2014) it seems logical to think that high-latitude islands, in which the highest increments in average temperatures are expected, would be the most affected by this phenomenon. In contrast, islands of more "stable" climatic regimens would be less affected. However, it has been suggested that global warming could lead to the highest losses of diversity in the most diverse tropical islands (Veron et al., 2019). Considering that most of these islands are characterized by high human modification (Fig. 1; Leclerc et al., 2018) and insufficient protection (Fig. 1; Mouillot et al., 2020), as confirmed here, the synergistic effect of these factors with the suggested strong impact of climate change (Veron et al., 2019) could be the cause of enormous losses of global biodiversity. In this context, future assessments aimed at detecting conservation opportunities on islands, considering hypothetical scenarios of global change (especially sea-level rise, land cover changes, and the effect of climate change on species distributions), would be useful for improving recommendations and decision-making.
By showing this global picture of island biodiversity threat and protection, we confirmed the sweeping global impact of humans' settlement on islands during the Anthropocene (Fernández-Palacios et al., 2021; Nogué et al., 2021). More importantly, our findings suggest that the future of islands' biodiversity, and its significant percentage of the known world diversity (Myers et al., 2000; Whittaker and Fernandez-Palacios, 2007), is disconcerting and uncertain. Even when considering all PAs´ categories, the percentage of islands reaching 17% of protection is low (26% of them), and the geographic pattern of coverage is highly unbalanced. On the other hand, a high percentage of the world's islands undergo a high level of human disturbances. Further, most of the largest and more species-rich tropical islands are among the islands suffering the synergy of both factors (LPHM). Considering this scenario, we believe that opportunities suggested in this paper to improve island conservation could be extremely helpful, at least to slightly improve this dramatic scenario.
Conflict of interestsThe authors declare that they have no known competing financial interests or personal relationships that could have appeared to influence the work reported in this paper.
Article statementA quarter of islands worldwide face a pessimistic scenario characterized by high human modification and a low level of protection.
Data availabilityData generated during this study are included in this published article (see Supplementary Information). Raw datasets used and/or analyzed during the current study available from the corresponding author on reasonable request
Javier Nori is a staff researcher of CONICET and Universidad Nacional de Córdoba, his research is funded by FONCYT (PICT 2017-2666) and SeCyT-UNC. FV is funded by INECOL and CONACYT, Mexico (Ciencia Básica A1-S-34563). CNPq funds RL’s research (grant #306694/2018-2). This paper is a contribution of the INCT in Ecology, Evolution and Biodiversity Conservation founded by MCTIC/CNPq (grant #465610/2014-5) and FAPEG (grant #201810267000023). LO-O is founded by PAPIIT-UNAM (project IA203922).
The following is Supplementary data to this article:

