Endemics–Area Relationships (EARs) are fundamental in theoretical and applied biogeography for understanding distribution patterns and promoting biodiversity conservation. However, calculating EARs for vascular plant species from existing data is problematic because of biased knowledge of endemic species distributions and differences between taxonomies. We aimed to overcome these challenges by developing a new standardized global dataset based on expert knowledge to produce a set of global EARs.
We developed a nested circle design, with grain sizes of 104, 105, 106, 107, and 108km2, respectively, and a global distribution of plots based on a stratified random scheme. The number of vascular plant species endemic to each circle was then estimated independently by five experts randomly chosen from a pool of 23, as both a minimum and a maximum value (lower and upper bounds of the estimation), taking into account the limitations of current knowledge and varied species concepts in existing taxonomies. This procedure resulted in a dataset of 3000 expert estimates.
Based on the data, we produced three global EARs for endemic species richness using minimum, maximum and average estimates. As a validation, we used all three models to extrapolate to the entire world, producing estimates of 284,493 (minimum), 398,364 (maximum) and 312,243 (average) vascular plant species. These figures conform to the range of taxonomists’ estimates. From the models, we calculated the average area needed to harbour a single endemic species as 12,875km2 (range 9675–20,529).
The global vascular plant EARs we calculated represent the first standardized, quantitative expectations of plant endemism at any given scale (sampling unit size). These EARs allow us to provide a clear answer to a long-standing but elusive biogeographical question: how to assess whether any area on the surface of the Earth is rich or poor in endemics relative to the average.

Taxa with restricted geographical distribution (here termed endemics when fully contained within a given sampling unit) are fundamental to biogeography and biodiversity conservation. They are used for delineating biodiversity hotspots and shaping international and national conservation policies (Myers et al., 2000; Mittermeier et al., 2005; Beierkuhnlein, 2006; Hobohm, 2014). Understanding the distribution patterns of endemic species is increasingly important for biodiversity conservation and its planning. However, baseline data on endemism in vascular plants are scarce, and very uneven in their quality and geographical distribution (Kier and Barthlott, 2001; Stohlgren, 2007; Kier et al., 2009; Storch et al., 2012; Guerin et al., 2015). Despite efforts to improve knowledge of plant biodiversity (e.g., Global Strategy for Plant Conservation https://www.cbd.int/gspc/strategy.shtml) and approximately 2000 new plant species described each year (RBG Kew, 2016), our knowledge of the world's plant species list is far from complete (the ‘LinnaeanShortfall’, Brown and Lomolino, 1998; Oliveira et al., 2016). Another major problem for understanding distribution patterns of endemics is that our knowledge of those plants’ geographical ranges is far from complete (the ‘WallaceanShortfall’, Lomolino and Heaney, 2004; Meyer et al., 2016; Oliveira et al., 2016).
Endemics-Area Relationships (EARs) are fundamental tools for understanding biodiversity and endemism patterns. They can provide reference values against which to compare observed numbers of endemics in any specified area, serving as a basis for analysing and interpreting patterns of plant endemism at different spatial scales. However, fitting such models requires comparable data across large areas, and is therefore hindered by a range of key problems, including: (1) insufficient data availability, (2) geographical variation in taxonomies and species concepts, (3) different shapes of the areas sampled in producing existing data, (4) different shapes of the regions into which data have been aggregated (often defined by political borders), and (5) inconsistency between what is included in such aggregation units. An example of (5) is that data for certain countries may include only mainland (e.g., Switzerland, Paraguay), sets of islands (e.g., Cabo Verde, Seychelles, Mauritius) or mainland plus islands (e.g., Spain, Greece, USA) (Barnosky et al., 2005; Pyšek et al., 2008; Trimble and van Aarde, 2012; Güler et al., 2016). Biases related to taxonomy and biogeography reduce the ability to make sound comparisons of diversity patterns, except when reliable grid data are available and the species concept is consistent (Storch et al., 2012; Hobohm, 2014).
Given these limitations and shortfalls, we aimed to model the global relationship between the number of endemic vascular plant species and area using a radically different approach to anything of which we are aware, starting by generating a new set of comparable data, based on standardized, spatially nested sampling units (Stohlgren, 2007; Storch, 2016). Since available data on vascular plant species’ distributions currently do not fit this purpose, we used expert knowledge to integrate information from available floras and distribution maps to estimate the number of species endemic to each sampling unit. Expert knowledge plays an important role in the analyses of ecological and evolutionary processes in space and time whenever empirical data are scarce or weak, or relating models are missing (McBride and Burgman, 2012). This is because the standardization and conceptual data harmonization is achieved by utilizing the knowledge and understanding of endemism patterns built up over their careers by experts.
Our main goal was to develop a set of models for the relationship between the number of endemic vascular plant species and area, using an approach to avoid or bypass the biases and difficulties resulting from different taxonomies and species concepts, geographical distribution of sea, mainland and islands, different shapes or sizes of sampling units and regions, and insufficient and biased existing data. We set out to produce a global EAR that is as accurate as possible, but also parallel EARs to give minimum and maximum values for each given sampling unit size, taking into account the range of species concepts used in different taxonomies and the deficiencies in our knowledge of species and their distributions.
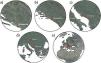
MethodsNested circle design (NCD)Our sampling design was based on 60 geographical points, randomly located on the Earth's surface using the following protocol. We divided the Earth's surface into 12 sectors, 6 in the Northern and 6 in the Southern hemisphere (see Appendix S1 in Supporting Information, for geographical details). Each sector was a slice of the Earth of 60° of longitude, stretching from the equator to the North or South Pole. We generated 5 random points in each sector, such that all parts of the surface, whether land or sea (hence radically different to existing approaches), had an equal chance of selection. Then, we constructed 5 nested circular plots, centred on each point, with areas (grain sizes) of 104, 105, 106, 107, and 108km2, respectively. This procedure corresponds to a stratified random sampling of nested plots with the same centre (Stohlgren, 2007). For reasons of comparison, we implemented the same number of plots for each grain size (n=60). As the largest plot size covers almost a fifth of the Earth (e.g., Fig. 1e), many of these plots overlap (Fig. 1e). The circular shape was chosen because all points on the edge have the same distance to the centre, minimizing the perimeter/area ratio. We considered this important given that a species’ range must be entirely contained within the sampling unit for that species to be endemic.
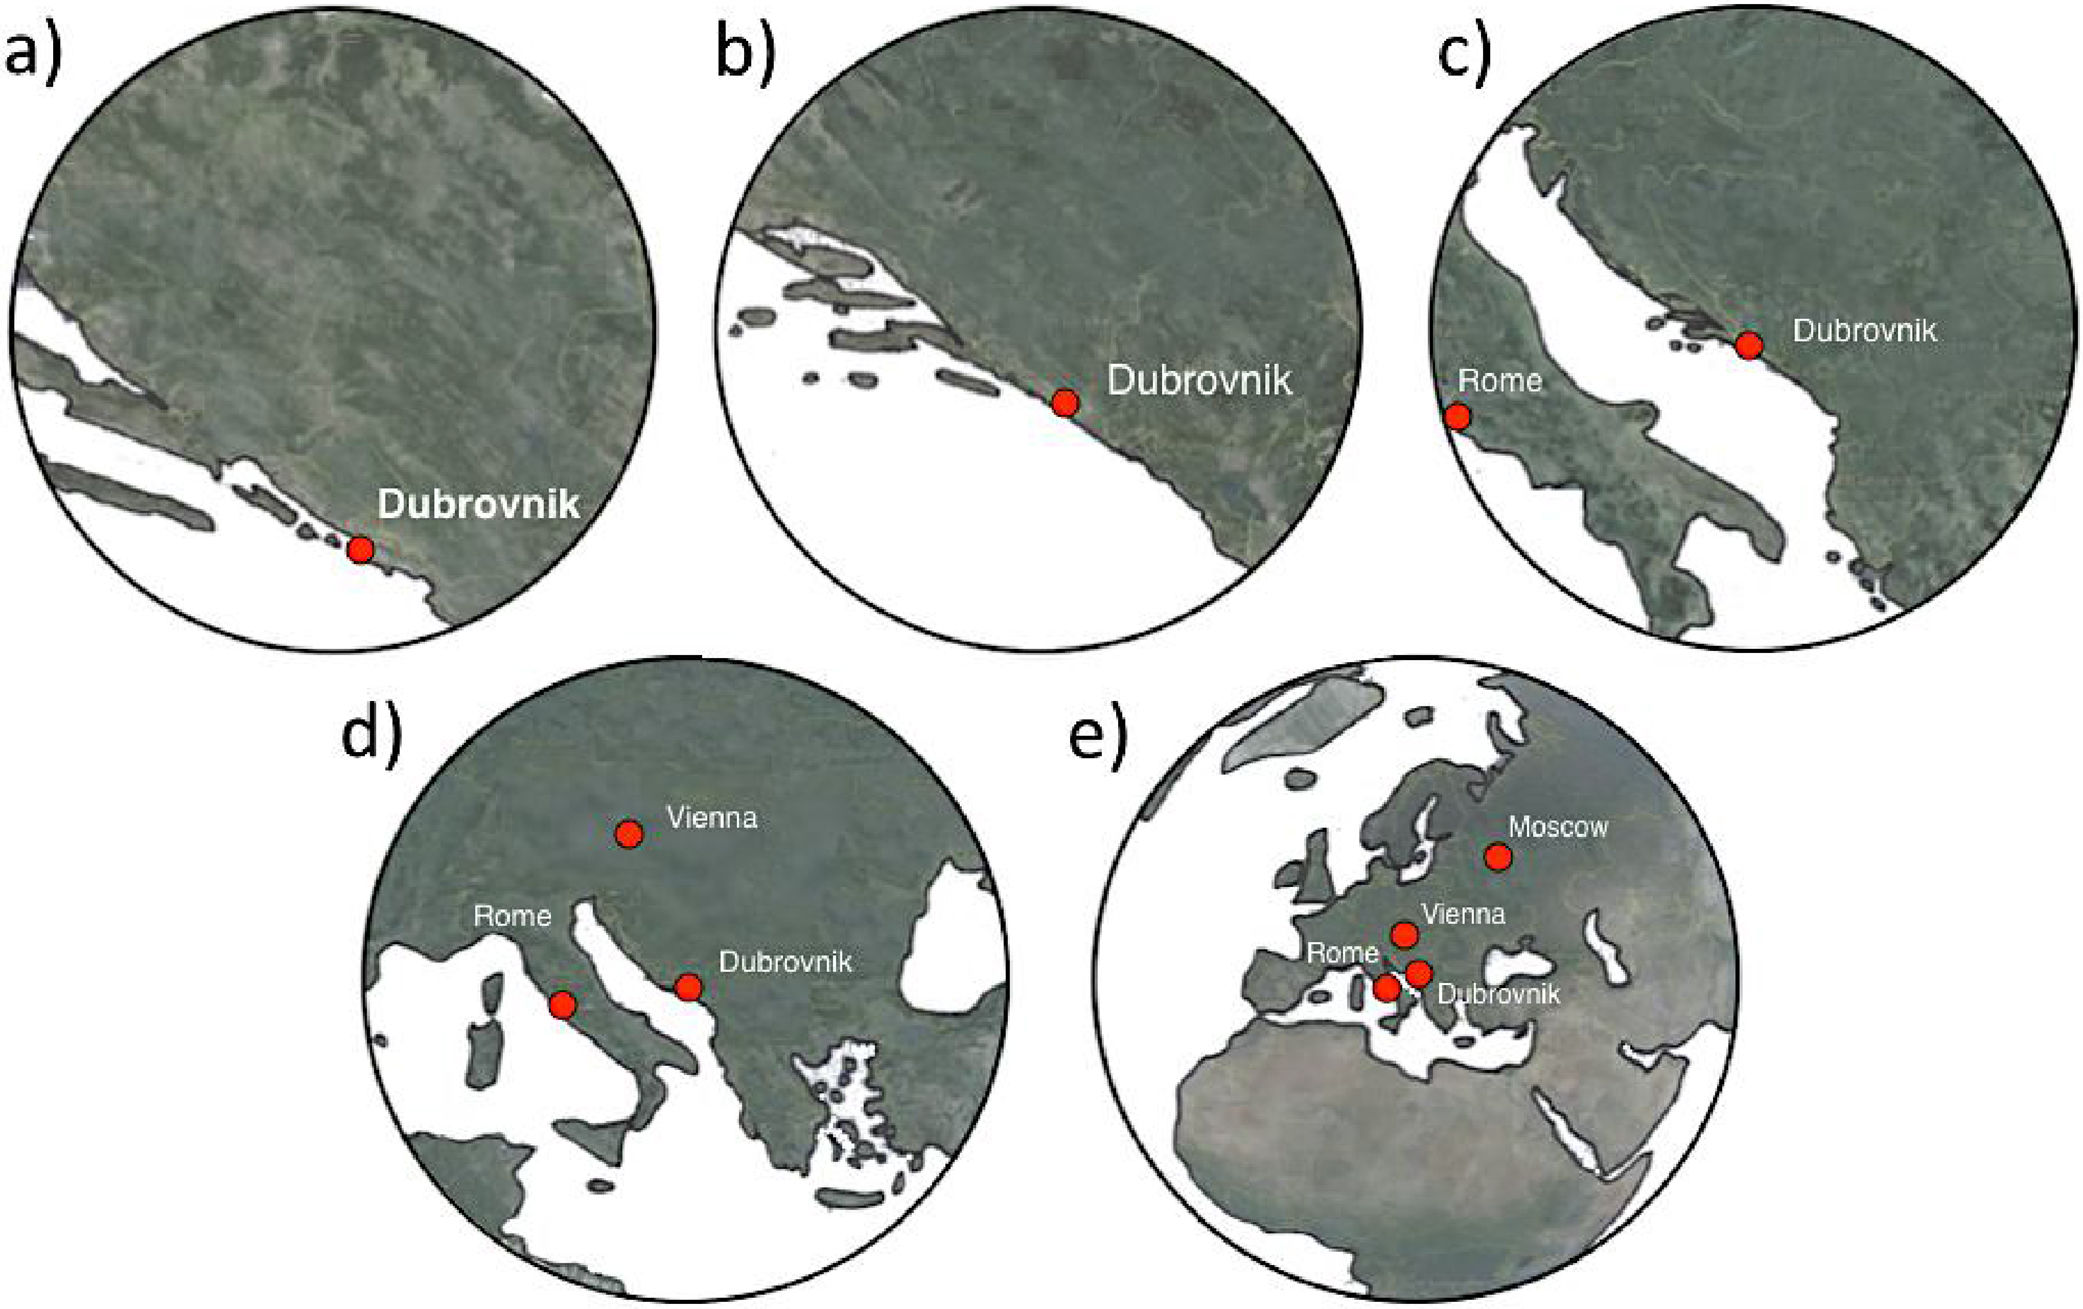
Example of the nested circle design (NCD). Grain sizes (a) 104km2, (b) 105km2, (c) 106km2, (d) 107km2, and (e) 108km2. All the circles are centred on the point 43 N, 18 E, which is near Dubrovnik. The smallest grain sizes cover parts of Bosnia and Herzegovina and the Croatian coast; the largest includes parts of NE America, Eurasia and Africa (see Appendix S1 in Supporting Information). Note that this illustration is schematic only, showing how the NCD was organized; high resolution maps were utilized for the estimates.
The NCD provides simple units for estimating the number of endemic plant species, unaffected by the distribution of land and sea, different shapes of sampling units, or biased distributions of plots. Conceptually, if a relatively small sampling unit is centred on the Canary Islands, or the tropical Andes, we conclude that the area has more endemic vascular plant species than is average across the whole planet's surface for a sampling unit of that size. By the same token, if the unit is in the middle of the Antarctic ice cap, or a part of the sea with few or no islands, and therefore contains no endemic vascular plant species, we conclude that this area has fewer endemic species than is average across the whole planet's surface. In both cases, the reasons are well known from biogeography. While these examples may be trivial, they illustrate that our concept of a global endemism reference, provided by the resulting EARs, applies anywhere on Earth.
Database compilationSince published distributional data of endemic vascular plants for a random sampling at global scales are not available, and in order to achieve the standardization and conceptual harmonization required of the data, we created a database using expert-estimation of the numbers of endemic plant species for each circular plot. Overall, 23 experts participated. For each randomly selected point, five of these experts independently estimated the minimum and maximum number of endemic species in each of the five plots centred on that point. Each expert was provided with the same set of information from existing floras and data, as a reference, but was asked to exercise his/her own judgement from experience of research in this field. The first experts to produce estimates were three of the authors (CH, AC and MJ), who also coordinated the process. Then, 20 other experts were invited to produce independent estimates of randomly allocated plots, without knowing what the other estimates were for those plots. Further, each expert was not aware of the identities of the other experts providing estimates for the same or other plots, ensuring that they did not communicate among themselves about their estimates or about their approach to calculating those estimates. Subsequently, all experts were invited to join the team for proceeding with analyses and writing, and all accepted (becoming co-authors). Part of the group then met in Flensburg, Germany, 2nd–6th February 2018, to plan the rest of the research. The overall procedure was designed to harness the advantages of using expert knowledge, while being aware of typical disadvantages (Araújo and New, 2007; McBride and Burgman, 2012), which we sought to minimize by determining the consensus of expert estimates for each plot.
The procedure resulted in 3000 records, each being an estimate of the number of endemic vascular plant species in a circular plot (i.e., 12 sectors×5 points×5 magnitudes×2min/max×5 experts). Although the dataset produced is not perfect, the estimates are based on the best and most up-to-date available data, and may be considered to represent the current state of knowledge – including the variability among the estimates. The numbers of endemics in many biogeographical analyses or conservation reports are often based on expert opinions that depend on different species concepts (cf. Myers et al., 2000; Mittermeier et al., 2005). Furthermore, many of the published numbers of endemic species within particular regions have recently been adjusted, and these improvements are ongoing. Therefore, we consider the data obtained by our approach to be comparable in quality to data used for other research on endemism at coarse spatial scales (Storch et al., 2012; cf. Tables 5.1–5.5 in Hobohm et al., 2014), with the major advantage of being comparable across the world.
Descriptive and inferential statisticsThe minimum and maximum number of endemic plant species in each circle of the NCD are here made available for future studies (see Appendix S1 in Supporting Information). For each circle, we used median values across the experts to eliminate the influence of outliers and improve the estimate (Bates and Granger, 1969). The variability among estimates by experts for the same circle was calculated by using standardized Analysis of Variance (Fox et al., 2015).
Endemics–area relationships (EARs) and extrapolation of plant species richness to the whole EarthTo model the number of endemic species as a function of area, we calculated linear, power and polynomial EARs (Storch et al., 2012). The Arrhenius (1921) power function, which is the most frequently used model in the context of SARs (species–area relationships) and EARs (Drakare et al., 2006), was the best fitting curve to the series of estimates presented here (see Results). Since the number of endemics in a large number of plots was estimated as zero, we used the non-logarithmic form of the Arrhenius equation:

where E is the number of endemic vascular plant species, A is the surface area of the circle, in km2, c and z are two fitted parameters representing the intercept (i.e. the number of endemic species per unit area) and the exponent (which is also the slope of the increase of the log (number of endemic species) per unit increase in log(area)), respectively. We fitted Equation (1) using three different data sets extracted by the ten estimates provided by the experts per each circle (5 experts×2 values): the first composed by the median values (n=300), the second composed by the minimum values (n=300) and the third composed by the maximum values (n=300). Model fitting was performed using the non-linear modelling procedure of the SSArrhenius function contained in the Vegan R package (Oksanen et al., 2016).
Global species–area relationships (SARs) and EARs can be validated to some extent by extrapolating from the dataset to the whole planet, and comparing the results with those derived from other ways of estimating the total number of vascular plant species on Earth, as done by Storch et al. (2012) for vertebrates. For the entire Earth, the number of endemic species (E) equals the total number of species (S). We used our models to calculate the number of endemic vascular plant species for the Earth, by extrapolating to A=510,000,000km2. We also used the models to calculate the average area harbouring one single endemic species. We compared the results with published estimates of the total number of vascular plant species.
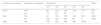
ResultsEstimated number of endemic vascular plant speciesOf the 3000 estimates of the number of endemic species in a circular plot in our dataset, about 40% were zero. Most of these zero estimates were for plots of the finer grain sizes and centred on points in the sea (Table 1). Overall, about 51% of the estimates in plots centred in the sea and about 83% of those in plots centred on land include endemics (Table 1). As expected from the wide range of biogeographical and ecological features of different regions on Earth, the estimates of numbers of endemic plant species in plots of the same size differ considerably (Fig. 2, Table 2; also see Appendix S1 in Supporting Information). The highest coefficient of variation, with a value of 2.236 (223.6%), resulted when four of the five estimates for a certain plot and magnitude were zero endemics and the other estimate was one or more endemics. Despite the high coefficient of variation, these frequent cases represent small absolute differences in estimates. Despite the high variance within each grain size and the uncertainty inherent to the estimates, values estimated by different experts are in general surprisingly similar, as shown by the mean of the coefficients of variation calculated on the values provided by the five experts for each circle (Table 2).
Number of estimates with or without vascular plant endemics in the circular plots, according to the location of their centre (land or sea) and the plot size.
| Location of the centre | Presence of endemics | Area (km2) | Total | ||||
|---|---|---|---|---|---|---|---|
| 104 | 105 | 106 | 107 | 108 | |||
| Land | Yes | 98 | 126 | 150 | 163 | 170 | 707 |
| No | 72 | 44 | 20 | 7 | 0 | 143 | |
| Sea | Yes | 40 | 106 | 180 | 342 | 430 | 1098 |
| No | 390 | 324 | 250 | 88 | 0 | 1052 | |
| Total | 600 | 600 | 600 | 600 | 600 | 3000 | |
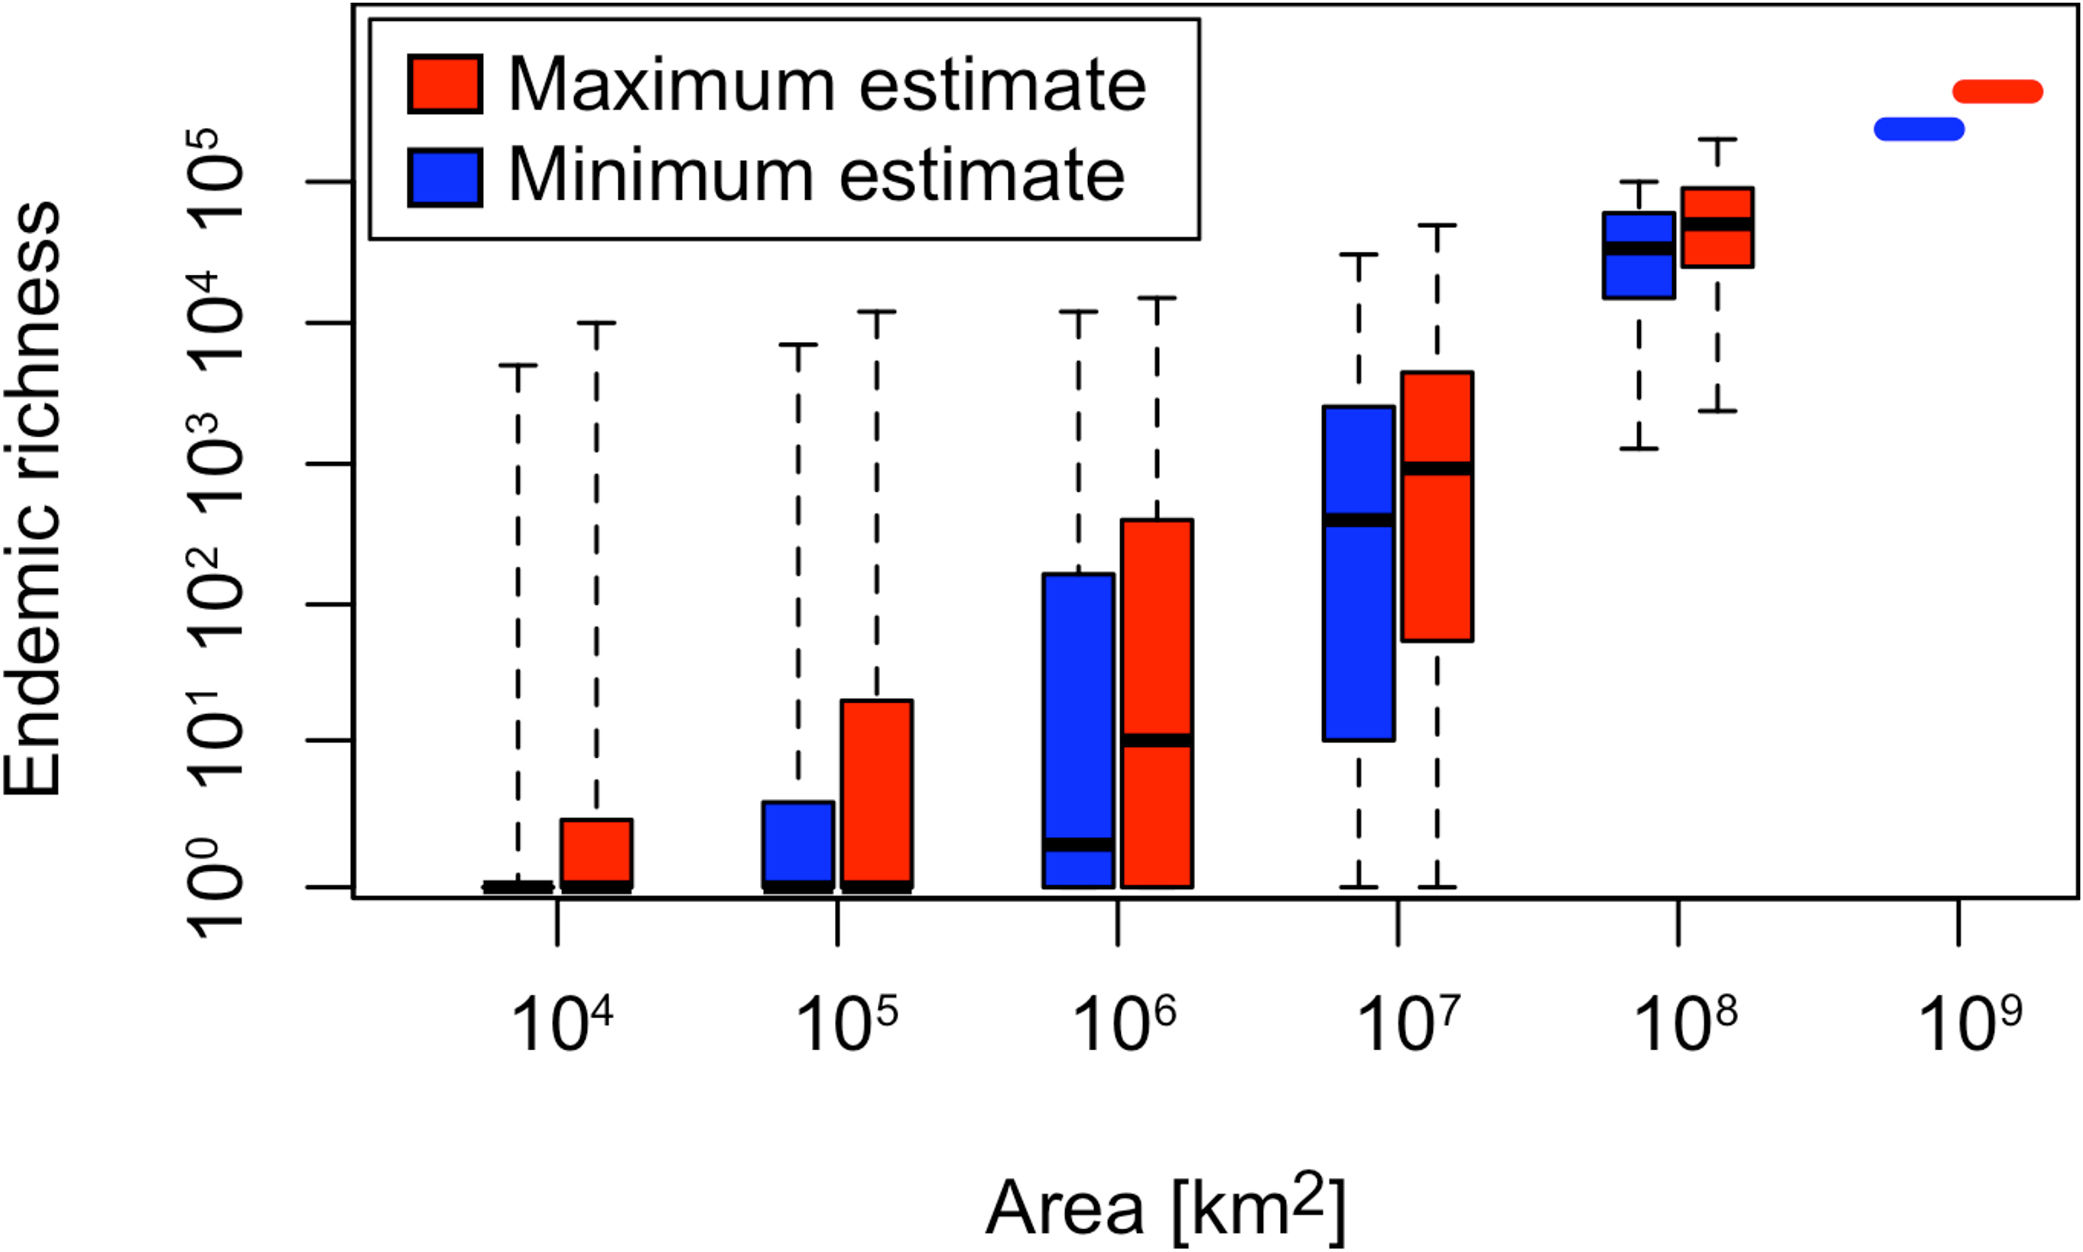
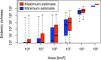
Minimum and maximum estimates (median estimate for each plot) of the number of endemic vascular plant species for the various plot sizes based on the estimates provided by the experts. The largest plot size represents values for the whole Earth (see text). Boxes indicate inter-quartile ranges while whiskers indicate the ranges. Richness values have been added to 1 to allow plotting on a log scale.
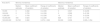
Estimated minima and maxima (median estimate for each plot) and coefficients of variation (mean and range). When all five estimates of the number of endemic vascular plant species related to a specific circular plot were zero, the coefficient of variation was defined as zero as well.
| Area (km2) | Minima of endemics | Maxima of endemics | ||||
|---|---|---|---|---|---|---|
| Median estimate | Mean coefficient of variation | Range of coefficients of variation | Median estimate | Mean coefficient of variation | Range of coefficients of variation | |
| 10,000 | 0 | 0.492 | 0–2.236 | 0 | 0.537 | 0–2.236 |
| 100,000 | 0 | 0.755 | 0–2.236 | 0 | 0.598 | 0–2.186 |
| 1,000,000 | 1 | 0.759 | 0–2.236 | 10 | 0.742 | 0–2.236 |
| 10,000,000 | 400 | 0.924 | 0–2.236 | 928 | 0.741 | 0–1.705 |
| 100,000,000 | 33,700 | 0.360 | 0.075–1.038 | 50,000 | 0.358 | 0.095–1.054 |
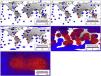
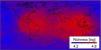
Fig. 3 illustrates the variation of endemic species richness in space and across grain sizes. One notable feature is how the spatial patterns in the richness of endemics change with the grain size.
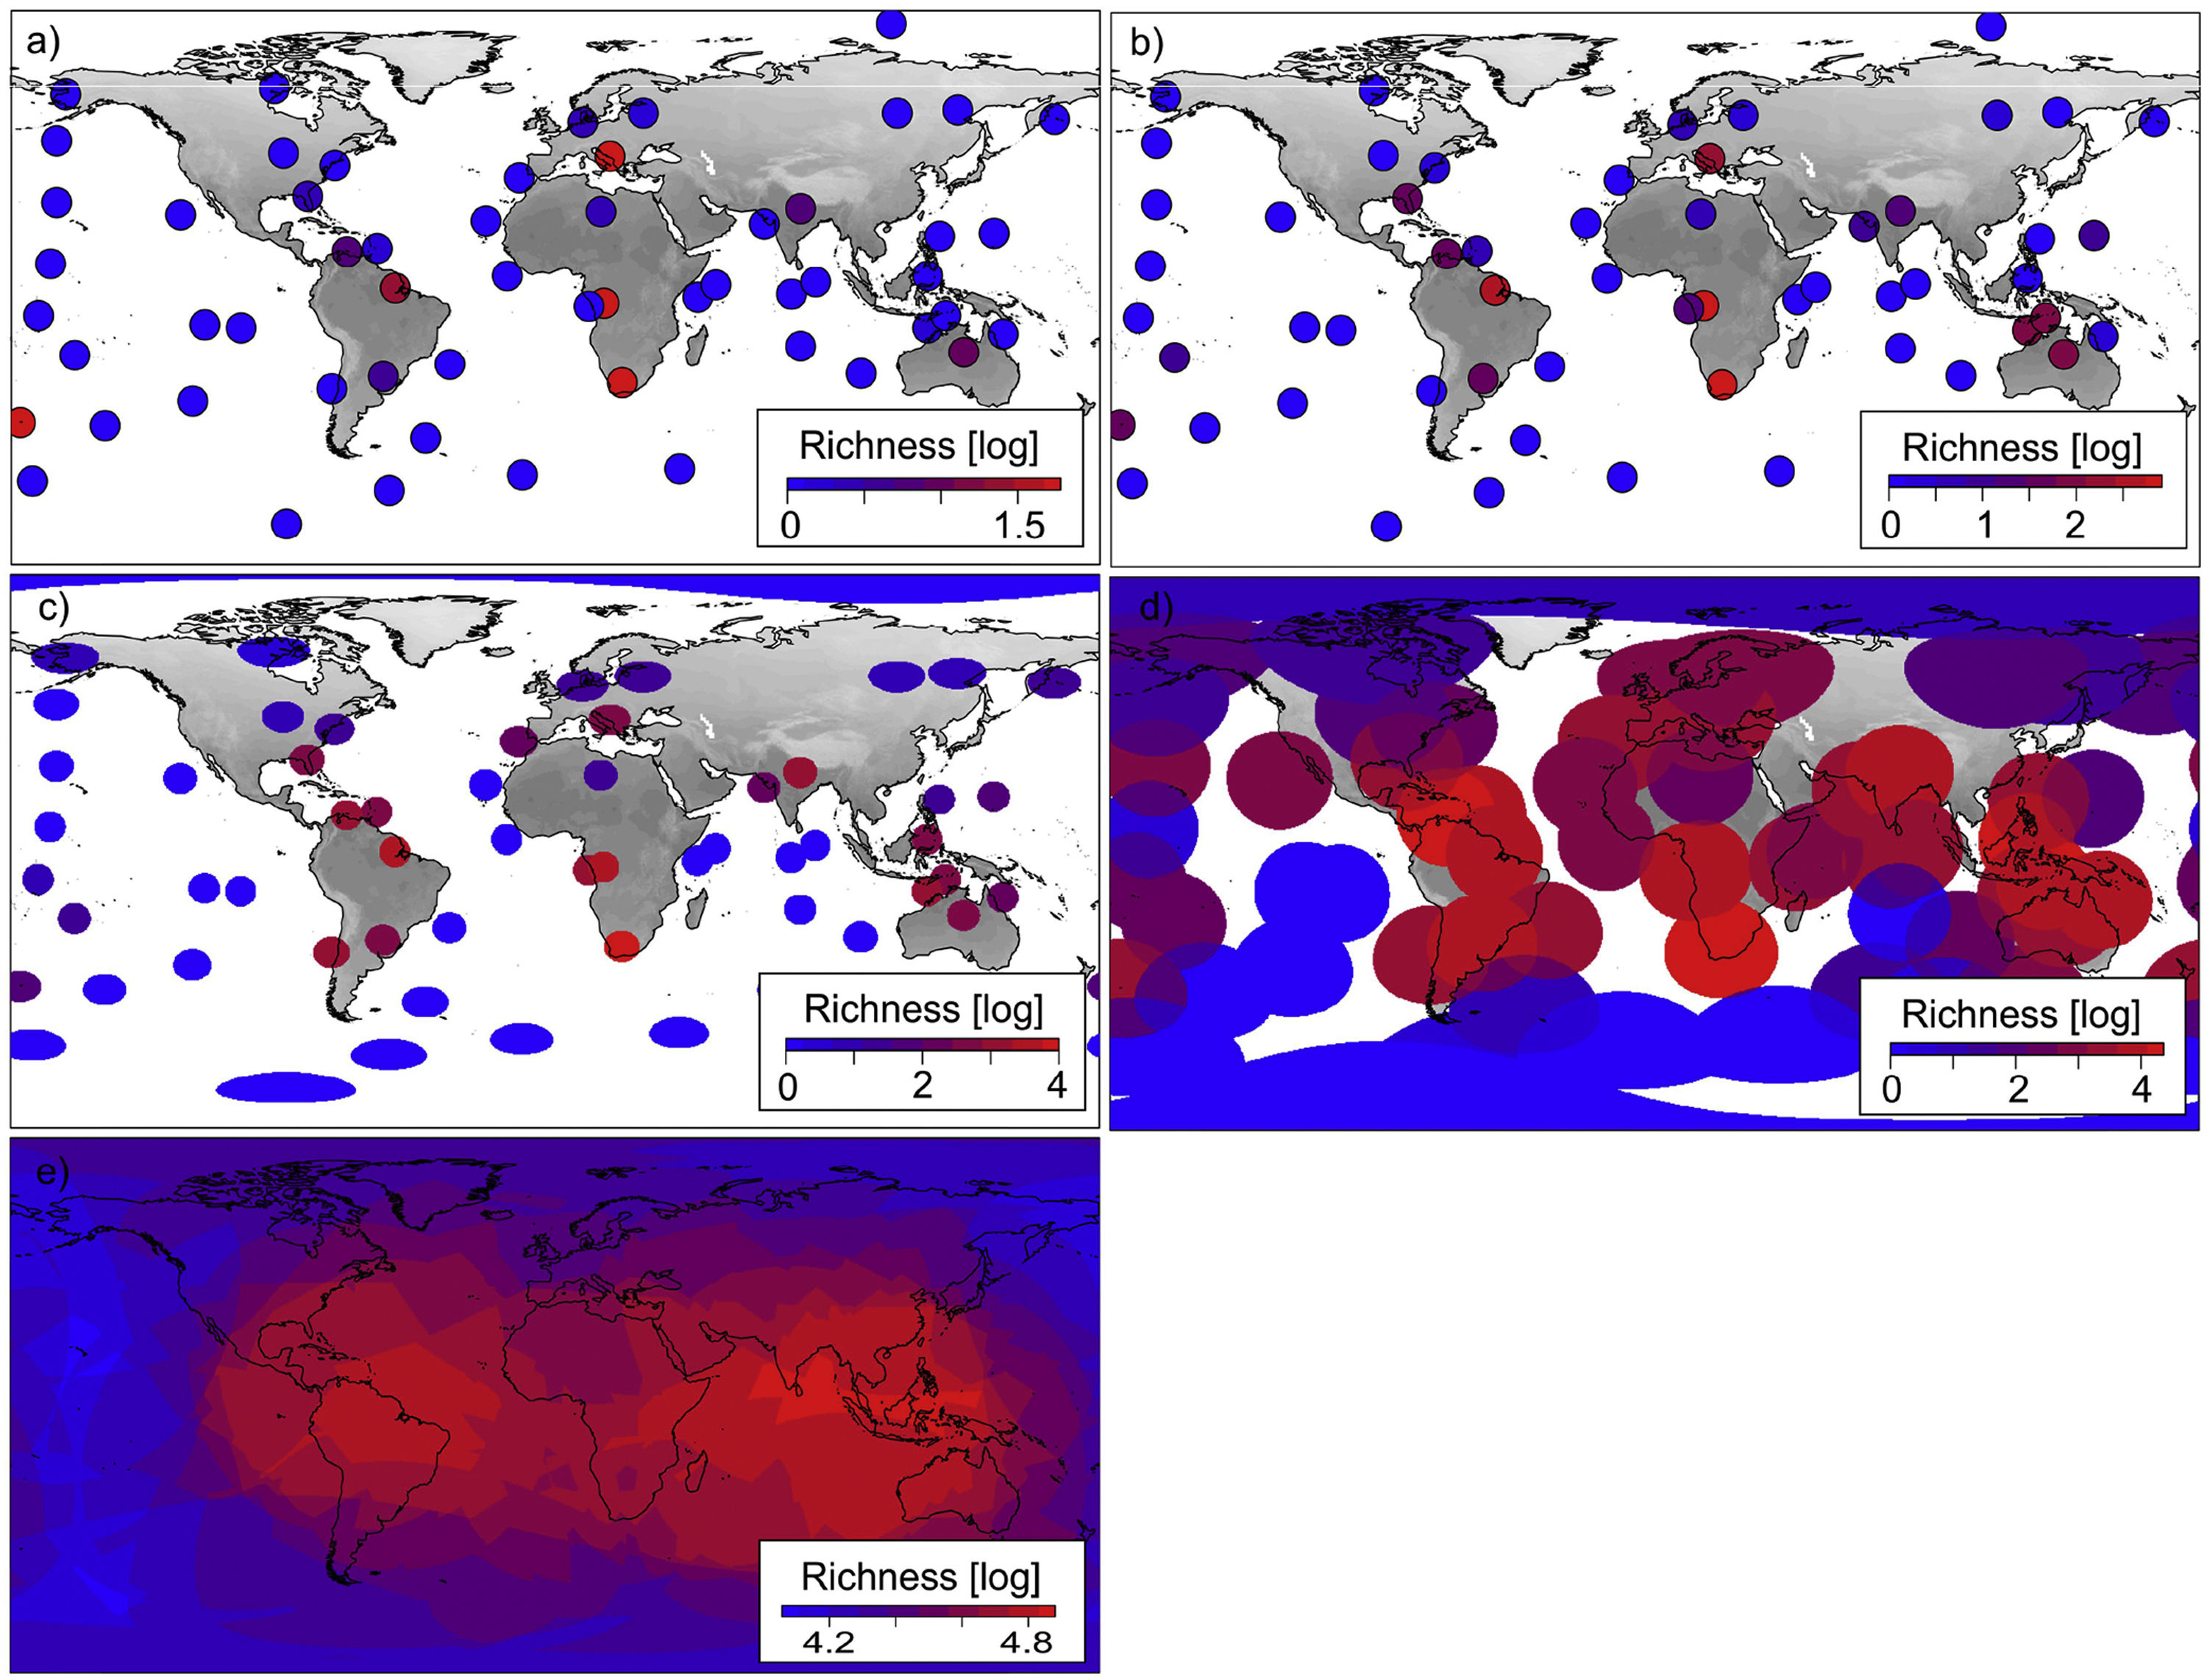
a-e Maps showing the position of the circular plots and estimates of the diversity of endemic vascular plants (medians, as log (e+1)) in circular plots of 104 (a) to 108km2 (e). Sizes of small circles in (a) and (b) are exaggerated to aid interpretation and, in each panel, one point centre is covered by the legend. Colours reflect the amount of endemism; blue indicating low and red high numbers. The distortion of the circular plots towards ellipses in high latitudes is an artefact of the cartographic reference we used, hat based on geographic co-ordinates provided by WorldClim (WGS84 Datum)..
Fitting the Arrhenius power function (Table 3) to the data set comprising the median values of all estimates produce an R2 values of 0.68. Fitting the function to the minimum and maximum expert estimates gave R2 values of 0.65 and 0.67, respectively. The c value, i.e. the number of endemic species per unit of area (here 1km2), is extremely small, as expected. Also as expected, the z values are always a little larger than 1. The best-fitting EAR (for all median values) is described by the formula E=0.00001227·A1.195.
Model fitting of the Endemics–Area Relationships (EARs) based on the Arrhenius power function, extrapolation to the total number of vascular plant species on Earth (that is the total species richness of the Earth) and extrapolation of the average area with one endemic species (based on median values of all estimates, of minima and maxima, respectively).
| Median values | R2 | c | z | Estimated number of vascular plants on Earth | Area with one endemic plant species (km2) |
|---|---|---|---|---|---|
| All estimates (n=300) | 0.68 | 0.00001227 | 1.195 | 312,243 | 12,875 |
| Minima (n=300) | 0.65 | 0.00000445 | 1.241 | 284,493 | 20,529 |
| Maxima (n=300) | 0.67 | 0.00001875 | 1.186 | 398,364 | 9675 |
Extrapolating to the surface area of the Earth, the model estimates 312,243 vascular plant species. Using the model for the medians of the minimum estimates gives a total of 284,493 species, while using the model for the medians of the maxima the estimate gives a total of 398,364 species. The associated average area to find a single endemic species (Table 3) is estimated as 12,875km2, ranging from 9675 to 20,529km2 (median values for maxima and minima, respectively).
DiscussionAccuracy of data and expert knowledgeAt biogeographical scales, numbers of species are typically counted, estimated and assembled by many researchers using heterogeneous sources, and as a result they can be heterogeneous and variable in quality (Chiarucci et al., 2011). For many regions on Earth, it is still impossible to get accurate data on the number of endemic vascular plant species, and even where reasonable data exist, differences in methodology and species concepts cause large variation in estimates or counts for the same region (Hobohm, 2014).
Most of the published data on the number of endemic species are related to political units, such as countries or provinces. Very often, when numbers do refer to natural biogeographical units, they refer specifically to islands, archipelagos or mountain ranges (cf. Hobohm, 2014). Many large countries at high latitudes or in arid regions are relatively poor in endemics, while many islands in tropical and subtropical regions are extraordinarily rich in endemics (Groombridge and Jenkins, 2002; Kier et al., 2009). Using these data, which are strongly biased in spatial representativeness, does not guarantee a model reflecting the real and highly uneven distribution of endemic plants on Earth.
The sequences count – estimate – guess and fact – hypothesis – speculation are often considered to indicate an order from scientific certainty to weak conjecture (Franklin, 2009; Burgman et al., 2011). Expert knowledge is sometimes associated with the weaker side of science, though species’ range maps are often based in large part on such knowledge. Nobody knows the exact number of endemic species in a circular plot constituting 20% of the Earth's surface and including parts of different continents and many islands. However, in the absence of ideal data (exacerbated by the recent, widespread reduction in support for systematics, taxonomy and other areas of basic science), the use of expert knowledge is increasingly important, especially in nature conservation science and practice (Maddock and Samways, 2000; Drescher et al., 2013; Grêt-Regamey et al., 2013). This is for at least two reasons. First, nature conservation practice cannot wait until all individuals and species of all taxonomic groups in a region are counted or identified; nature conservation management often has to act on the basis of imperfect data, or despite a lack of knowledge. We used expert knowledge simply because of the lack of a dataset appropriate for calculating global plant EARs for areas of standardized grain and shape. As we outline in the Introduction, the counts that do exist cannot be compared or combined and analysed without biased results. Our first global vascular plant EAR can certainly be improved in the future, but for now addresses the lack of such a tool with a reasonable model. Second, measures of uncertainty can be built into the use of expert knowledge, as herein. When this is done, expert knowledge does not necessarily result in weaker conclusions than models based on incomplete or biased occurrence data (cf. Yamada et al., 2003; Perera et al., 2012; Tara et al., 2012; Reside et al., 2019).
We therefore consider that harnessing expert knowledge is the best approach to overcoming the lack of accurate empirical data and biased results. We accounted for uncertainties associated with data deficiencies and varying species concepts by estimating minimum and maximum values for the number of endemics in each plot. Further, our combination of estimates by five randomly selected experts per plot reduces errors associated with the subjective part of this process (McBride and Burgman, 2012). In our data, the highest variability among experts’ estimates was observed at plot sizes in the range 100,000–10,000,000km2, for both the minimum and maximum values of endemic species richness. Because the plots of the smallest size (10,000km2) often represent areas without vegetation, or with minimal vegetation, many estimates were zero at this scale. At intermediate plot sizes (100,000–10,000,000km2), many of the circles had zero and non-zero estimates, resulting in relatively high proportional variation between estimates. For many islands and countries, official estimates of numbers of endemic species have had to be adjusted in recent decades because of better knowledge and changing taxonomies (Hobohm, 2014). The largest circles in our analysis, on the other hand, usually contain entire endemic-rich floristic regions, no zero-endemic estimates, and thus, the variation between them was relatively low.
Sampling designIn comparison to ‘strictly nested quadrat’ (SNQ) and ‘continental shape’ (CS) designs (Storch et al., 2012; Storch, 2016), the NCD has no plot large enough to include the whole or almost the whole surface of the Earth. However, the number of NCD sampling units per grain size is kept constant (n=60 in this application), whereas the number of sampling units declines with increasing grain size both in the SNQ and CS designs. Having the same number of sampling units per grain size, NCD allows more spatially representative estimates.
There are currently few published EAR models for vascular plants (Cowling and Samways, 1995; Hobohm, 2003; Georghiou and Delipetrou, 2010; Hobohm and Tucker, 2014). Curves for the Greek mainland and island regions were relatively steep, with z-values of 1.49 and 1.15, respectively (Georghiou and Delipetrou, 2010). The curve for a combination of mainland and archipelagos (Georghiou and Delipetrou, 2010), in contrast, was shallow (z-value of 0.42). This example shows how the sampling of geographical units can strongly affect the resulting EAR, when checklists are combined. Our z-values are slightly higher than 1, as expected for EARs at this scale (Storch et al., 2012). Our method, coupled with the use of ensembles of expert-derived estimates to generate the data, is intended to provide a standardized estimate of endemic species richness per unit area that is unbiased and directly comparable in terms of grain size and shape, thus reducing relating problems of inconsistency. The results of the variance analysis, the comparison with theoretical expectations (Kier et al., 2009; Storch et al., 2012; Storch, 2016; Hobohm and Tucker, 2014), and the results produced by extrapolating to the total number of vascular plant species on Earth, indicate that our model is reasonable, and has potential for further applications.
Because of the new sampling design, the results of the models we present are not directly comparable to formerly published models. Recently published curves (Storch et al., 2012; Storch, 2016) show a slightly ascending EAR to the right hand side in log–log space at global. This can be explained by the lesser representation of regions at the edges of continents, which are often more rich in endemics than the more inland regions (David Storch, pers. comm., 2016). The NCD does not show such an effect because the number of units for every plot size is the same (n=60), and probably also because the circle design incorporates these geographical gradients, as discussed in the next section.
Distribution of land and sea, and representation of samples with zero endemicsIt might not seem useful or appropriate to include areas without terrestrial vegetation in our analysis. However, should plots with no endemic plant species, such as regions of the ocean without islands, be excluded from sampling or analyses? If yes, then what about other water bodies within countries, some of which do not contain endemic vascular plants, that are not usually excluded from calculations or estimates? Or what about ice caps, bare rock or unvegetated desert? Further, seagrasses show that vascular plants can live in the oceans. However, almost all seagrass-beds are species-poor and dominated by widespread species, giving very low numbers of endemics in any local marine area. This is part of the global pattern of vascular plant endemism. Our approach therefore highlights that the areas covered by seas are not qualitatively very different from areas covered by lakes, ice caps, or sandy deserts, from the point of view of plant species diversity and endemism.
While it may seem trivial that most plots containing no habitable land have no endemic vascular plants, the isolation created by these regions that are inhospitable to vascular plants is key to why many islands in the ocean have so many endemics. The same applies, to a lesser extent, around coastlines. Our approach does not exclude those influences, thus bringing the physical geography of the Earth into our modelling and into the resulting reference values for the numbers of endemics. The distribution of endemics is a pattern that develops over long time-periods, of which the present-day is a snapshot, and is affected by evolutionary processes related to continental drift and changing ecological conditions, by isolation and dispersal, and thus, by the distribution patterns of land and sea (e.g. Huston, 1994; Gaston, 1996). To produce a global reference and to help in understanding the patterns, it is appropriate to include all these areas in the models. Our approach therefore has strengths not shared by others, including overcoming some of the biases affecting other approaches, such as the continental-edge bias identified by David Storch (pers. comm., 2016).
Eliminating zero-endemic plots, especially at the smallest size, would increase the average number of endemics of the smaller sizes and flatten the curve (cf. Cowling and Samways, 1995; Williams, 1996). We consider it inappropriate because the sampling design must have priority and should be independent of the result; the distribution of plots with and without endemics is the result. Moreover, previous SARs and EARs have used samples with zero vascular plant species or zero endemic plant species, respectively (Green and Ostling, 2003; Werner and Buszko, 2005; Dengler and Boch, 2008; Duarte et al., 2008; Georghiou and Delipetrou, 2010; Storch et al., 2012; Polyakova et al., 2016). Since we were developing a global EAR, we wanted to represent the overall global pattern of endemics, including regions with many or few endemics, as well as arid or cold regions, glaciers or ocean, where we did not expect to find any endemic plants.
For all these reasons, we consider that there is no biogeographical argument to exclude zero-endemic plots from our sampling or analyses. Further, we suggest that the resulting models reflect the total number of vascular plant species well (see next section) in part because we did not exclude zero-endemic plots from sampling.
Model extrapolations and total number of vascular plant species on EarthAt present, the total number of vascular plant species estimated on Earth varies a lot between published estimates, depending on the data sources and the associated taxonomic or other biases. The number of seed plants has been estimated as 223,300 (Govaerts, 2001), 352,000 (Scotland and Wortley, 2003) and 422,127 (Paton et al., 2008), for example. Estimates of 308,312 (Christenhusz and Byng, 2016), 315,903 (Kier et al., 2009) and 383,671 (Nic Lughadha et al., 2016) were calculated for the total number of vascular plant species, and 298,000 (Mora et al., 2011) and 320,000 (Groombridge and Jenkins, 2002) for all plants. Clearly, present knowledge is very incomplete and needs further data gathering and integration. Furthermore, it is difficult to calculate potential overestimation and underestimation resulting from taxonomic or nomenclatural artefacts, and potential underestimation reflecting the likelihood of ongoing exploration and discovery (Ungricht, 2004). Bearing these limitations in mind, and assuming that pteridophytes comprise c. 13,000–14,000 species (Nic Lughadha et al., 2016), estimates for all vascular plant species on Earth thus range between c. 236,000 and c. 436,000. The values we estimated here fit squarely within that range of published numbers, giving us some confidence in the quality of our assembled data and models.
Extrapolating in the other direction, our models give values ranging from 9675 (medians of maxima) to 20,529km2 (medians of minima) for the reference area to include only one endemic species (Table 3). These values represent the average expectations of our models for the whole surface of the Earth, including marine and terrestrial regions. According to the formula in Georghiou and Delipetrou (2010) for mainland Greece (a Mediterranean region known for being rich in endemics), one endemic plant species can typically be expected in an area of 1374km2. Appropriately, according to our models, that area is endemic-rich. From theoretical assumptions, Hobohm and Tucker (2014) found that the terrestrial regions (island or mainland) harbouring a single endemic plant species should be larger than 493km2. Again, these estimates can be improved with further research.
In general, SARs and EARs, such as those we produced, can be used to identify areas that are significantly richer or poorer in species or endemic species than average. As Lomolino (1982) has shown, the regression residuals give the possibility to quantify the diversity of endemics in a region as log-distance to the regression line for every size of area (see also Hobohm, 2003; Duarte et al., 2008). Thus, the models presented here can be considered as average theoretical expectations, or reference values, for comparing and analysing the distribution patterns of vascular plant endemism on Earth in areas of standardized circular area. As an example, the area of Hawaii (Big Island) is slightly larger than 10,000km2 and hosts 82 endemic plant species (Price, 2004), thus having c. 81 more endemic species than expected for a circular area of 10,000km2 and between 65 and 74 endemic species more than expected for a circular area of 100,000km2. From this, we infer that there is a strong concentration of endemism in this island – in line with received wisdom, and demonstrating our approach. On the other hand, many regions on Earth, such as parts of the oceans, cold or even temperate regions such as many lowland regions in Europe (Hendrych, 1982), have very few or even no endemic vascular plant species in relatively large areas.
ConclusionsOur models provide the first global reference against which observed numbers of endemic vascular plants can be compared, for each region (>10,000km2) on Earth, either on terrestrial land or in marine ecosystems. The ultimate aim is to enhance our current understanding of spatial patterns of plant endemism with respect to evolution, environment and ecology (Ferriere and Legendre, 2013). By developing a novel standardized design (the nested circle design, NCD) and harnessing expert knowledge, we have started the process of deriving reference values that overcome or bypass the current geographical, taxonomic and methodological problems. The Endemics–Area Relationships (EARs) here calculated resulted in intercept and slope values that are consistent with theoretical considerations, and show a remarkably good extrapolation of the total number of vascular plant species on Earth, giving confidence in the methodology we adopted (cf. Cowling and Samways, 1995; Hobohm, 2003; Hobohm and Tucker, 2014). As a significant result, we estimated the total vascular plant species richness on Earth between 284,493 and 398,364 species, with an expected value of 312,243 species, and we provided reference values of endemics for circular area ranging in grain from 104km2 to 108km2.
Finally, we wish to stress that basic science still is vital to understanding Earth's biodiversity, and deserves considerably more credit and investment than it is currently afforded. Despite the very incomplete basic knowledge for vascular plants, we produced biodiversity models of endemism that appear to be realistic, but these had to be based on expert estimates. For many taxa with great diversity and limited taxonomic knowledge, the knowledge gap is so large that it would not be possible to model endemism, even using expert estimates. Traditional descriptive scientific disciplines, such as taxonomy, systematics and biogeography, improve our knowledge of spatial patterns of plant diversity at global scales (e.g., Barthlott et al., 2007), and allow research on regional plant diversity changes at centennial time scales (e.g., Chiarucci et al., 2017). However, a complete understanding of global patterns and processes is still almost impossible because of the lack of available reference data. In this paper, we provide a methodological frame for estimating plant diversity in areas of standardized shape and grain. In conjunction with a common effort, the NCD developed here could be adopted to produce standardized estimates of a range of biodiversity measures across the Earth.
Competing interestsThe authors declare no competing financial interests.
V.O. thanks governmental contract of MSU # 01201157316 for financial support. A.F. receives grant from CNPq (303988/2018-5). V.R.C. contributed to this paper during a National Research Foundation Scarce Skills Post-doctoral Fellowship (Rhodes University, 2014–2016).
The authors have the following ORCID ID information:
Manuel Steinbauer: https://orcid.org/0000-0002-7142-9272
Richard Field: https://orcid.org/0000-0003-2613-2688
Carl Beierkuhnlein: https://orcid.org/0000-0002-6456-4628
John-Arvid Grytnes: https://orcid.org/0000-0002-6365-9676
Ole Reidar Vetaas: https://orcid.org/0000-0002-0185-1128
Alessandro Chiarucci: https://orcid.org/0000-0003-1160-235X
The following are the supplementary data to this article: