
The neotropical rattlesnake Crotalus durissus occurs in South America, where it is generally associated to open areas in the dry diagonal of the continent, composed of xeric and savanna biomes. Since the 1950’s, however, the species started to be recorded in rainforest biomes. Land-use change, especially the conversion of forests to pasture, remains a widely believed but still untested hypothesis to explain this range expansion. An equally untested alternative hypothesis is ongoing climate change as a driver of this observed expansion. Here we modeled the current distribution of C. durissus using occurrence records prior to 1950 for model calibration. Model predictions were then evaluated using occurrence records post-1950. The sets of models considered (i) only bioclimatic predictors, (ii) only land-use land-cover predictors, and (iii) a combination of both. Our results indicated that since 1950’s the geographic range of C. durissus is expanding primarily due increase in pasture areas, and, secondarily due to ongoing changes in climate (changes in isothermality and precipitation). This range expansion encompasses the Argentinian Chaco and the arc of deforestation in the Amazon, which were unsuitable before the 1950’s. The ongoing range expansion of the neotropical rattlesnake can become a public health issue, given that it is a venomous snake of medical importance. The expansion of the neotropical rattlesnake range can be controlled through public policies aimed at restraining deforestation (especially in the Amazon and the Gran Chaco) and encouraging reforestation (especially in the Brazilian Atlantic Forest).
The neotropical rattlesnake, Crotalus durissus Linnaeus, 1758, is the only representative of its genus in South America, with a widespread, although discontinuous, distribution in the continent (Fig. 1 - Wüster et al., 2005; Benício, 2018). This taxon is generally associated with tropical, subtropical, and temperate open vegetation, inhabiting a wide range of habitats, from rocky areas with sparse vegetation to savannas and pastures (Campbell and Lamar, 2004; Sawaya et al., 2008; Benício, 2018). Its distribution has a close correlation with the ‘dry diagonal’, a diverse and biogeographically important region, composed by Caatinga, Cerrado and Chaco (Fig. 1 – Vanzolini, 1963; Prado and Gibbs, 1993; Mayle, 2006).
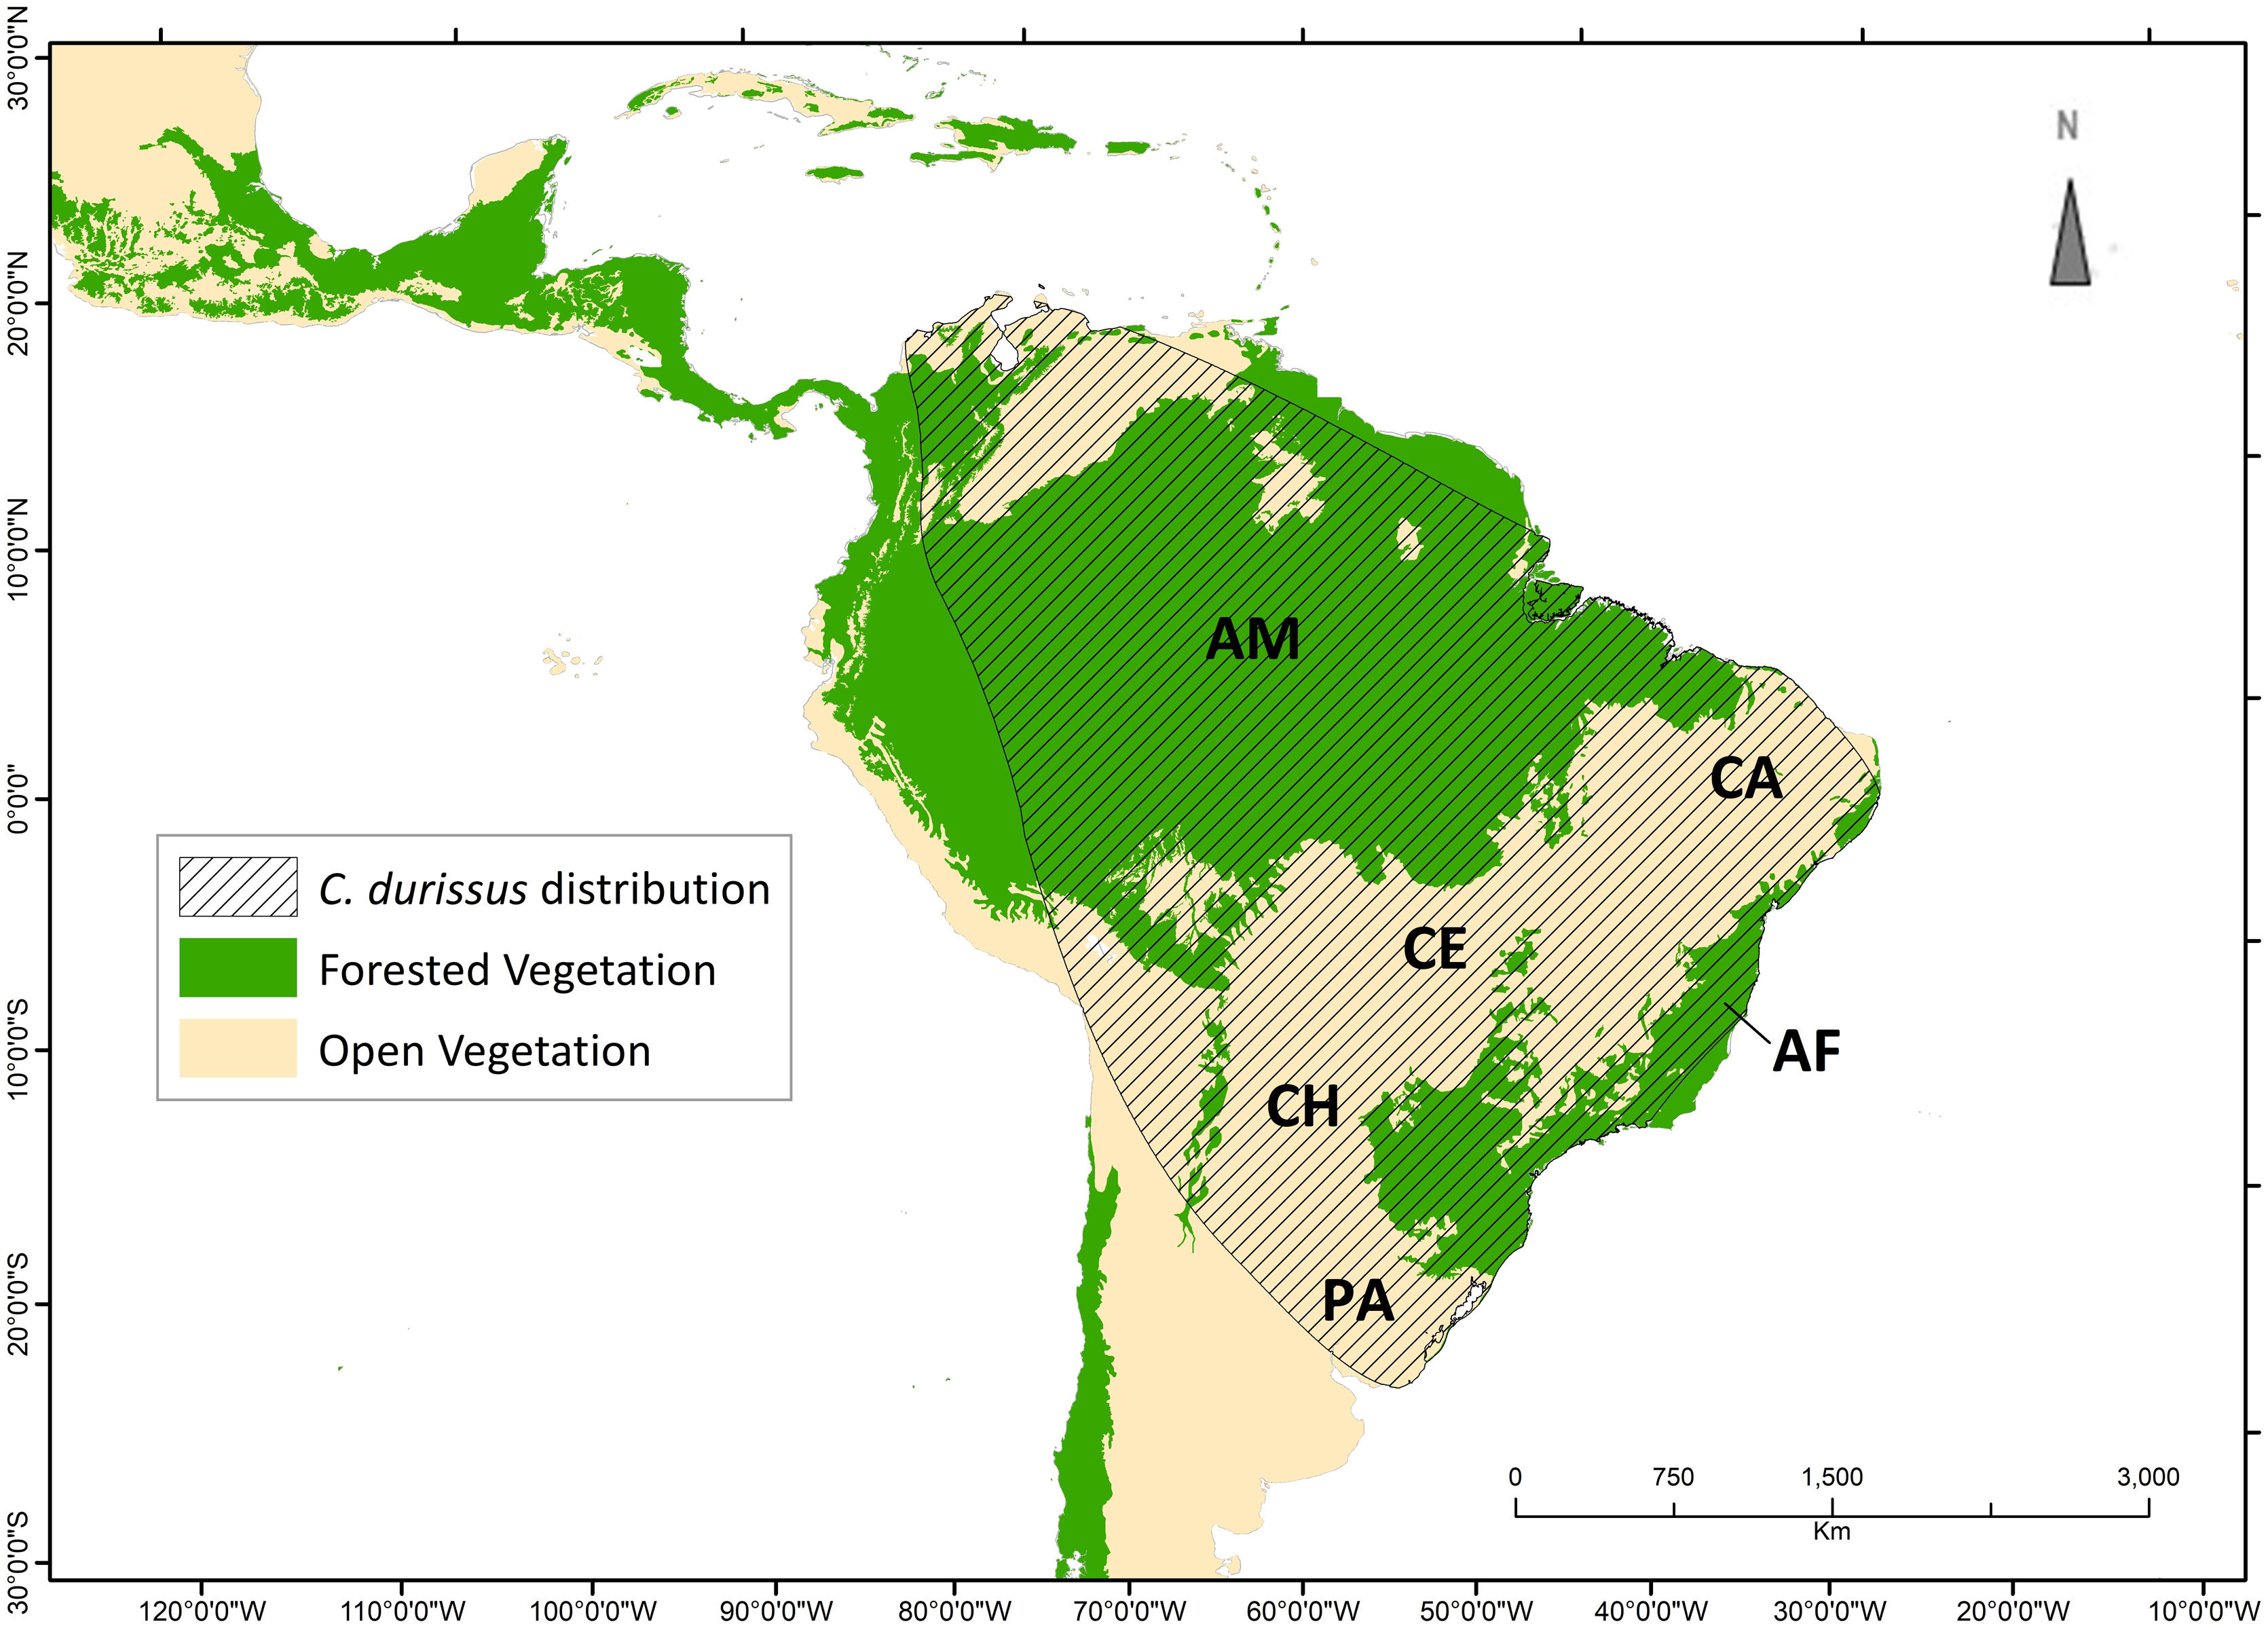
Known distribution of Crotalus durissus. Distribution modified from the International Union for Conservation for Nature (Martins and Lamar, 2010). Vegetation map following Olson et al. (2001) ecoregions, showing “major habitat types” that correspond to open vegetation (savanna and flooded/non-flooded grasslands) and Forested Vegetation (tropical and temperate dry or humid forests). Within the C. durissus distribution, major open vegetation corresponds to South America’s “dry diagonal”, represented by the Caatinga (CA), Cerrado (CE), Chaco (CH) and Pampa (PA), and major forested vegetation are represented by the Brazilian Atlantic Forest (AF) and the Amazon (AM).
Starting in the 1950's, the planet has witnessed drastic global changes known as "the great acceleration of the Anthropocene” (Steffen et al., 2015). The same process happened in Brazil, with an intensification of land-use land-cover change in the Amazon, Cerrado and the Brazilian Atlantic Forest, due to excessive wood exploitation, monoculture expansion, cattle raising, and urbanization (Puorto, 2012; Carlucci et al., 2021). A number of authors have suggested that land-use change, especially the conversion of forest to pasture, may have enabled the opening of dispersion corridors for C. durissus from Cerrado and Caatinga to areas originally forested, leading to the expansion of the species’ range (Sazima, 1992; Melgarejo, 2003; Bastos et al., 2005; Puorto, 2012). In the state of Rio de Janeiro, in the Atlantic Forest, for instance, there were no records of the species until the 1950’s, and specimens deposited in herpetological collections have only increased since then (Bastos et al., 2005; Bochner and Machado, 2012). Land-use change fragments the landscape into smaller forested patches immersed in an open pasture matrix, bringing the boundaries between Atlantic Forest and Cerrado domains further east (Bastos et al., 2005; Bochner and Machado, 2012; Benício, 2018; Fiorillo et al., 2020).
An expansion of C. durissus’ range towards deforested, and therefore densely inhabited areas, is a cause for concern as it is a venomous species of medical importance in several countries in South America (Nori et al., 2014; Chippaux, 2017), with a high lethality rate in Brazil, Bolivia, Venezuela, Colombia, and French Guiana (Sazima, 1992; FUNASA, 2001; Bastos et al., 2005; Chippaux, 2017). An expansion of the species’ range in response to land-use change, however, remains a widely believed but still untested hypothesis. It is concurrent, for example, with an equally untested hypothesis of changes in distribution due to global warming, as the climate is also changing due to anthropogenic emissions of greenhouse gases. Since the 1950’s, many of the observed changes are unprecedented over decades to millennia, and we have already recorded an average global warming of 1 °C in comparison to pre-industrial times (IPCC, 2021), with many species already showing changes in distribution in response to recent warming (e.g., Parmesan and Yohe, 2003).
Here, we used an ecological niche modeling framework to model C. durissus current distribution based on occurrence records pre-1950, using three sets of models to investigate whether changes in species distribution over this period have been caused by climate change, land-use change, or both. This is the first test of the role of land-use and climate change on the observed range expansion of C. durissus.
Materials and methodsOccurrence recordsCrotalus durissus is easily identifiable by the presence of a caudal creptacle (Melgarejo, 2003; Campbell and Lamar, 2004). Given that this is the only species of this genus in South America, misidentification is a non-issue. We gathered the occurrence records of C. durissus from 50 herpetological collections in Brazil, Argentina and Paraguay, and the following digital open-access databases: American Museum of Natural History (AMNH), Field Museum of Natural History (FMNH), Global Biodiversity Information Facility (GBIF, https://www.gibf.org/), Smithsonian Institution National Museum of Natural History (NMNH), the SpeciesLink project (http://splink.cria.org.br/), and VertNet (http://vertnet.org/). All records were evaluated, manually removing duplicates, specimens born in captivity, and records with ill-defined geographic location. For records with location name but no latitude/longitude information, we gathered geographic coordinates from the following databases considering the most specific locality available: Instituto Brasileiro de Geografia e Estatística 4.1. 2010 (http://geoftp.ibge.gov.br/organizacao_do_territorio/estrutura_territorial/localidades), Global Gazetteer 2.3. 1949 (http://www.fallingrain.com/world/index.html), and Google Earth 7.1.7. 2016 (https://www.google.com.br/intl/pt-BR/earth/). For analytical purposes, occurrence records were separated into two sets: records made before 1950 (called “pre-1950”, hereafter), and records made in and after 1950 (called “post-1950”, hereafter). A total of 332 occurrence records were retained after the spatial thinning: 82 pre-1950 and 250 post-1950 (Appendix A).
Bioclimatic and land-use land-cover predictorsWe gathered bioclimatic and land-use land-cover variables from ecoClimate (https://www.ecoclimate.org) database at 0.5º resolution for two time periods: 1900-1949 (pre-1950) and 1950-1999 (post-1950). This is an open database that uses processed, multi-temporal climatic simulations produced by the Coupled Modeling Intercomparison Projects (CMIP6) and the Land-Use Harmonization Project (LUH2) across past, present, and future (Lima-Ribeiro et al., 2015; Vale et al., 2021). The two time periods were chosen based on the first records of C. durissus in the Atlantic Forest, combined with the start of the great acceleration in the 1950s (Steffen et al., 2004; Fiorillo et al., 2020). As there are no available averages for the land-use land-cover data, we considered data from the last year of each period: 1949 (for the period pre-1950) and 1999 (for the period post-1950). The LUH2 dataset is stored annually, and therefore, we used only the years that represented the end of the two time periods used for the bioclimatic variables.
We selected six land-use land-cover variables among the 12 available based on the species’ biology (Araújo et al., 2019): forested primary land, non-forested primary land, potentially forested secondary land, potentially non-forested secondary land, managed pasture and rangeland. The “forested” and “non- forested” categories take into account the aboveground standing stock of natural cover; ‘primary’ means lands that were not disturbed by human activities previously, and ‘secondary’ include lands that are in recovering or in the process of recovering from human activities to their original states (see Hurtt et al., 2006, 2011; Hurtt, 2020 for more details).
We cropped all variables to the neotropical region, where C. durissus was present, using Olson et al. (2001) ecoregions dataset. Due to different resolutions between bioclimatic and LUH2 variables, we resampled the land-use land-cover data to 0.5º resolution using the nearest neighbor method within the ‘raster’ package v.3-1.5 in R (Hijmans, 2020). To avoid multicollinearity and correlation problems, we used the Variance Inflation Factor (VIF) test to select only variables with VIF <3 and correlation <0.7 (Zuur et al., 2010) via a stepwise procedure using ‘vifcor’ function at ‘usdm’ v1.1 - 18 package (Naimi et al., 2014), retaining 7 bioclimatic and 5 land-use land-cover variables (max VIF = 2.3, linear correlation coefficients ranged from 0.001 to 0.49) (Table S1, supplementary material): mean diurnal range, isothermality, mean temperature of wettest quarter, precipitation of driest month, precipitation of wettest quarter, precipitation of warmest quarter, precipitation of coldest quarter, non-forested primary land, potentially forested secondary land, potentially non-forested secondary land, managed pasture and rangeland.
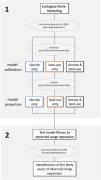
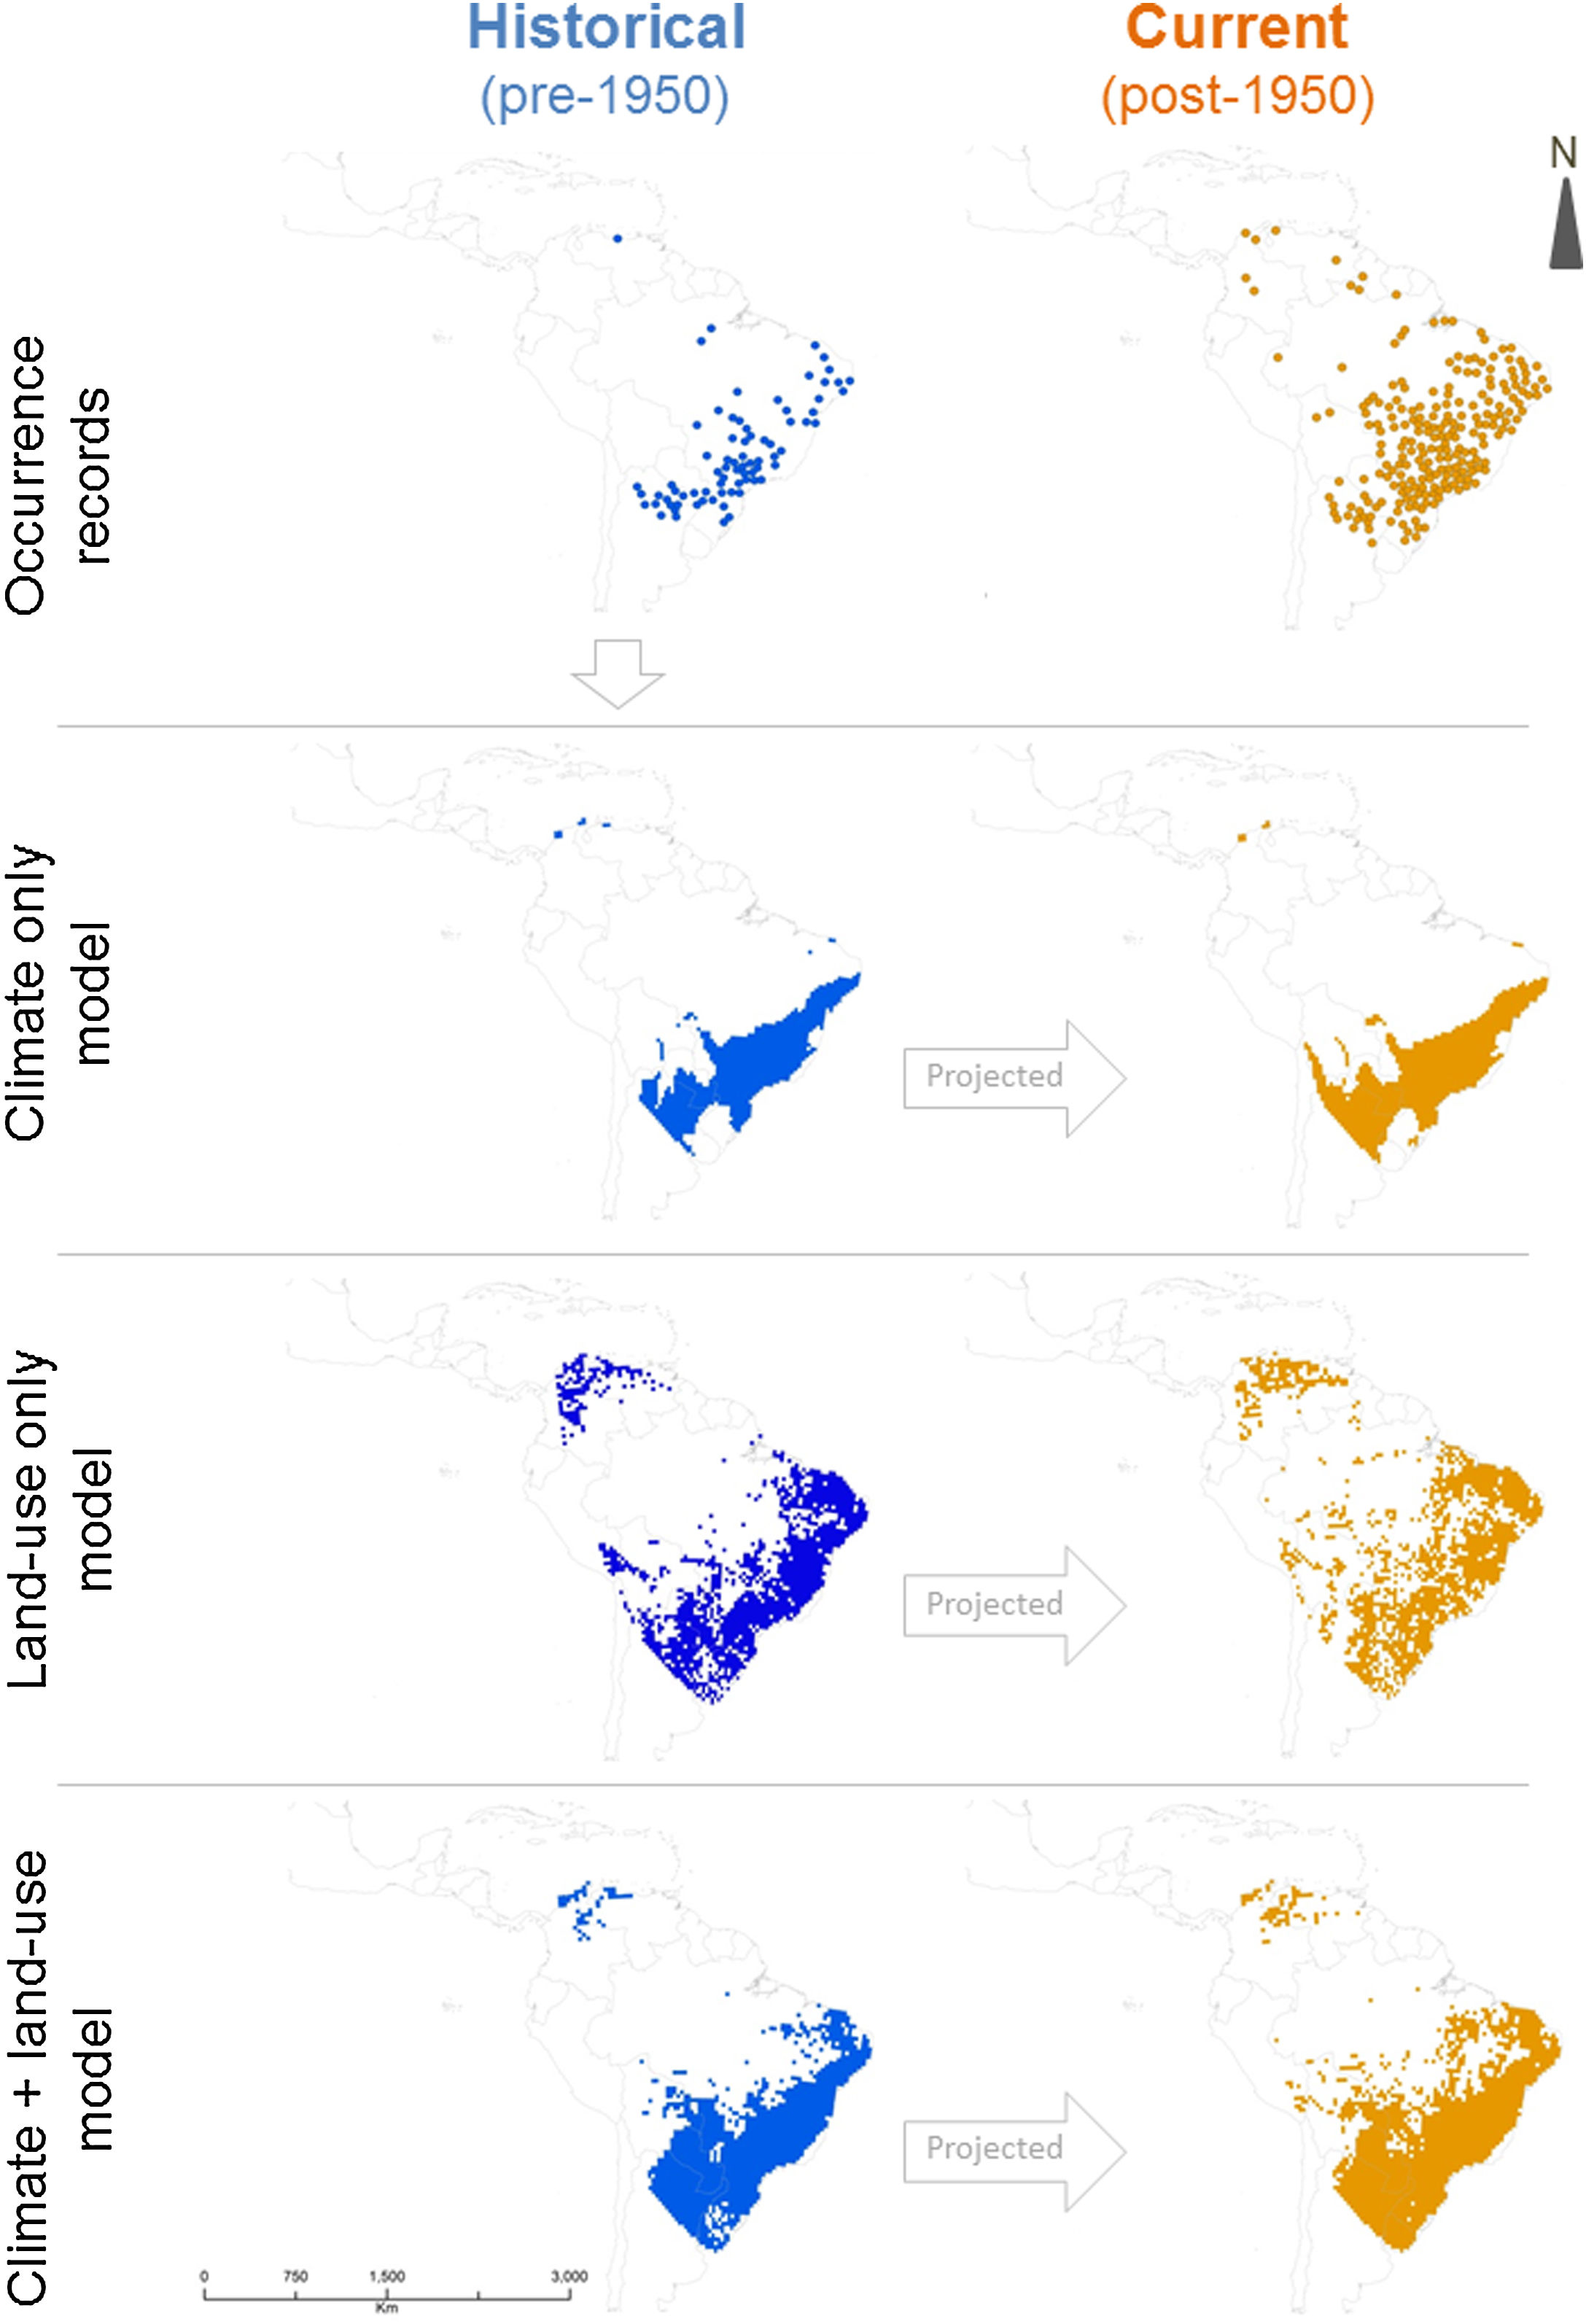
Ecological niche modelingWe constructed three sets of ecological niche models (ENM): (i) using only bioclimatic predictors (called “climate-only”, hereafter), (ii) only land-use land-cover predictors (called “land-use-only”), and (iii) both bioclimatic and land-use land-cover predictors (called “climate + land-use”). All modelling procedures described below were conducted for all sets separately using pre-1950’s occurrence records (Fig. 2). The model was then projected to pre-1950’s environmental conditions, reproducing the “historical” distribution of C. durissus, and to the post-1950’s conditions, representing the “current” distribution of the species under the assumption of species-environment non-equilibrium reflected in an expanding range (e.g., Araújo et al., 2005; Wilson et al., 2007). We used the Biomod2 package v. 3.4.6. in R studio v. 1.3.959 platform for all analyses (Thuiller et al., 2020). Occurrence records post-1950 were not used to calibrate or test model performance, but to test model’s prediction under post-1950’s conditions, as explained later.
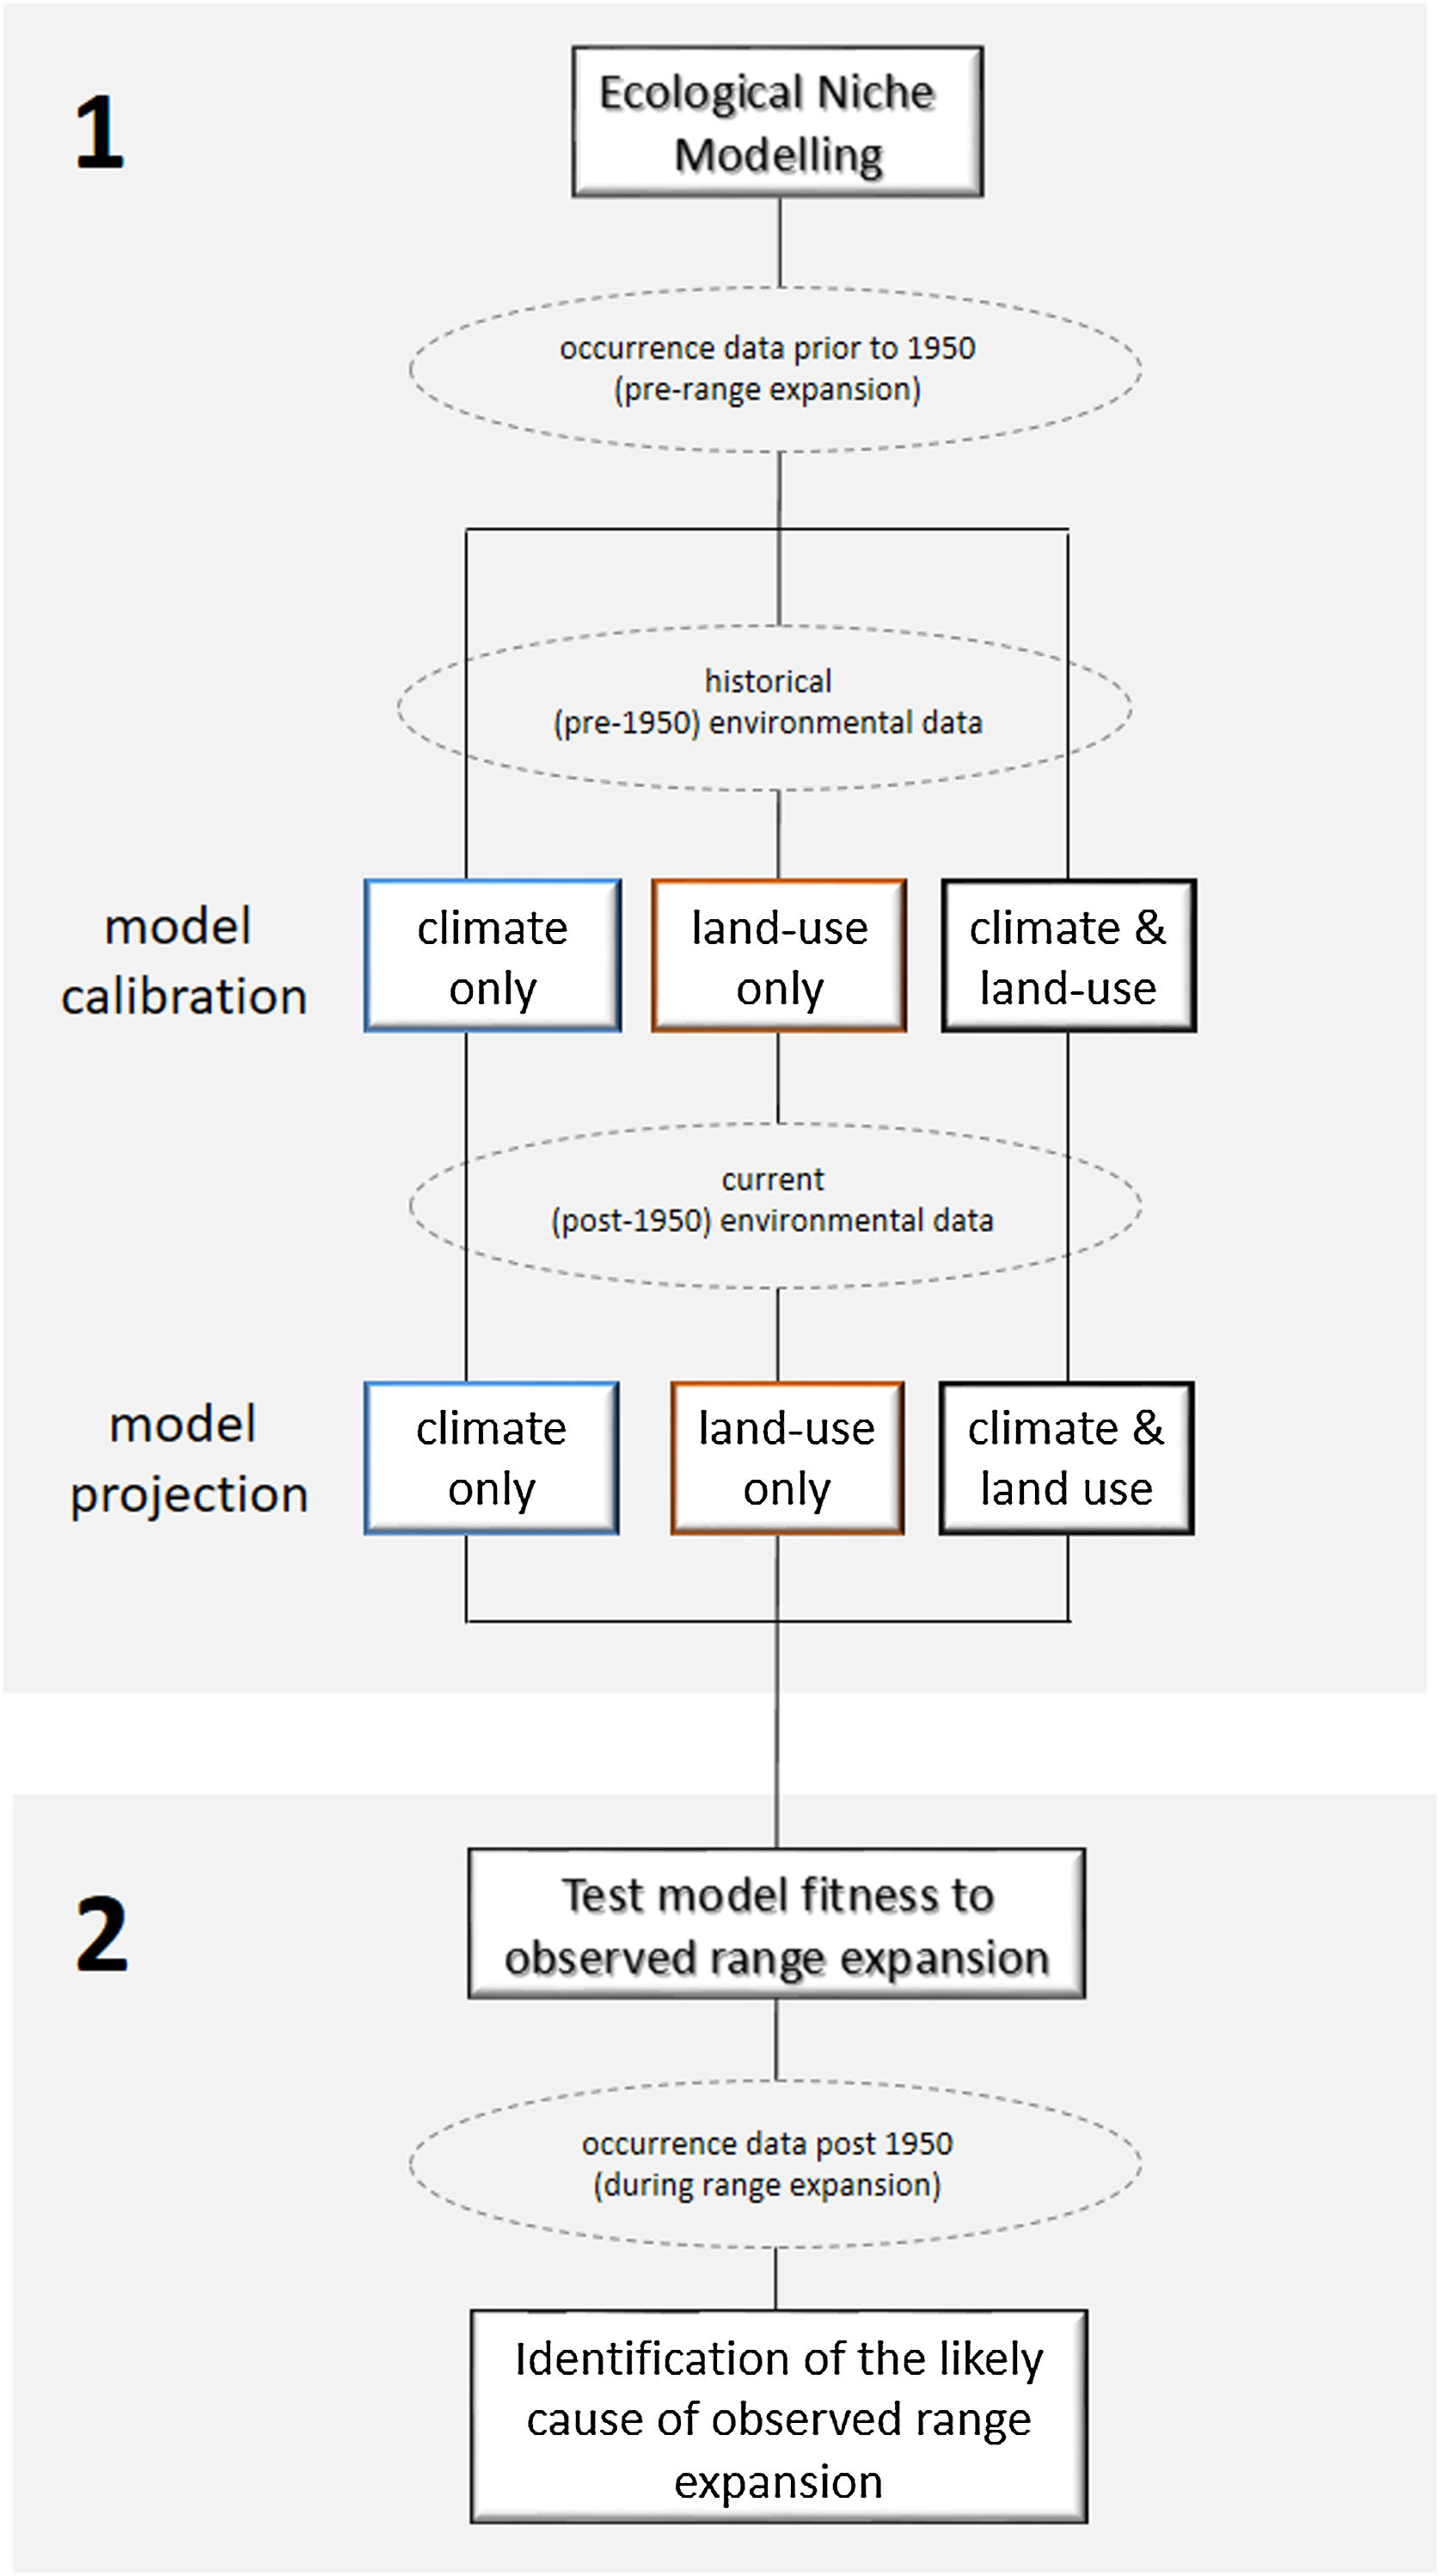
Workflow to identify the likely cause of Crotalus durrisus’ range expansion. The analysis was carried in two main steps. (1) We calibrated the ecological niche modeling using the historical conditions (pre-1950 occurrence records and environmental data), for three sets of data: climate only, land-use only and both. The procedure generated three distribution models that were then projected into current conditions (post-1950 environmental data). (2) The fitness of each model to the observed range expansion was evaluated using only post-1950 occurrence records, pointing to the likely cause of Crotalus durrisus’ range expansion: climate, land-use change, or both. Rectangles show analyses and dashed ellipses show datasets.
We used six algorithms for two types of data requirements: Presence-absence models using regression (Generalized Linear Models (GLM) and Generalized Additive Models (GAM)), boosting ((Random Forest (RF) and Generalized Boosting Model (GBM)) and discrimination techniques (Flexible Discriminant Analysis (FDA)); and Presence-background models using Maximum Entropy models (MaxEnt). From these algorithms, we produced a final ensemble model (Araújo and New, 2006; Thuiller et al., 2019). We generated 3 sets of 1,000 random pseudo-absences points with a minimum distance of 100 km from occurrence records (Barbet Massin et al., 2012). To avoid potential sampling bias in models’ outputs, we used a buffer of 100 km to filter our occurrence records using the ‘thin’ function in the ‘SpThin’ package v0.2.0. This function uses a randomization algorithm that thins occurrence records at a distance specified by the user (Aiello-Lammens et al., 2015).
We calibrated the models using 80% of records from the pre-1950 period for training and 20% for testing (Fig. 2) using the cross-validation technique at a constant prevalence at 0.5 (Guisan et al., 2017). We conducted 10 replicates for each algorithm and tested the importance of each variable running 10 permutations using the ‘get_variables_importance’ function (Thuiller et al., 2020). This test shuffles a variable in the dataset n times and compares, via a Pearson correlation, the predictions of the reference model and the shuffled model. The higher the index, the more influence the variable has on the model (Thuiller et al., 2020).
We evaluated model performances using the area under the curve of the receiver-operating characteristic (AUC or ROC) technique (Fielding and Bell, 1997). All replicates with AUC > 0.7 were selected and aggregated for a final ensemble model using weighted-by-AUC mean. Then, continuous predicted probabilities of occurrence were binarized using a threshold value that maximized AUC and also evaluated by weighted-by-AUC mean (pAUC) (Guisan et al., 2017). We projected the final model for each set of models (climate-only, land-use-only and climate + land-use) into geographic space under pre-1950’s and extrapolated to post-1950’s environmental conditions (Fig. 2). The extrapolation was limited to the current range of the species distribution, since the areas outside the current range may include non-analogous environmental conditions.
Because uncertainty can also arise in model output projection and it is a fundamental step for ENMs (Zurell et al., 2020), we created an uncertainty map, from binary ensemble models, using pre-1950’s occurrence records. This map indicates how different models converge or diverge in their average predictions of species presence or absence. When the average of binary suitability prediction is close to 0 or 1, it indicates that most models agree to predict presence (value close to 1) or absence (value close to 0). Values close to 0.5 indicates that models diverge in their prediction (Thuiller et al., 2020).
To evaluate which set of models (climate-only, land-use-only, climate + land-use) best mirrors the current distribution of C. durissus, we calculated the model's sensitivity using the occurrence records post-1950’s on models projected onto post-1950’s condition. It is important to remember that those models were created using the pre-1950’s occurrence records, and then projected under post-1950’s conditions. Because we know the distribution of the species under the projected conditions, we can evaluate the model's predictions. Finally, we calculated the extent of the predicted distribution for the three sets of models under the two time periods (pre and post-1950), in order to detect predicted range expansions or contractions under the different modeling combinations (Fig. 2).
ResultsWe successfully ran all 540 models (3 sets of models x 6 algorithms x 3 sets of pseudo absences x 10 runs), 180 for each one of the three model sets. Only those with pAUC >0.7, however, were retained to compute the weighted (mean) final ensemble model: 178 models for the climate-only set, 171 for the land-use-only set and 173 for the climate + land-use set. The weighted mean ensemble model for the three sets of models had high pAUC scores (climate + land-use = 0.89, climate-only = 0.93, land-use-only = 0.90), with a particularly high percentage of presences correctly predicted (sensitivity = 93.5) for the climate + land-use ensemble model (Table S2, supplementary material).
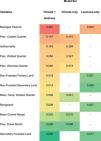
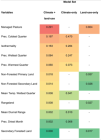
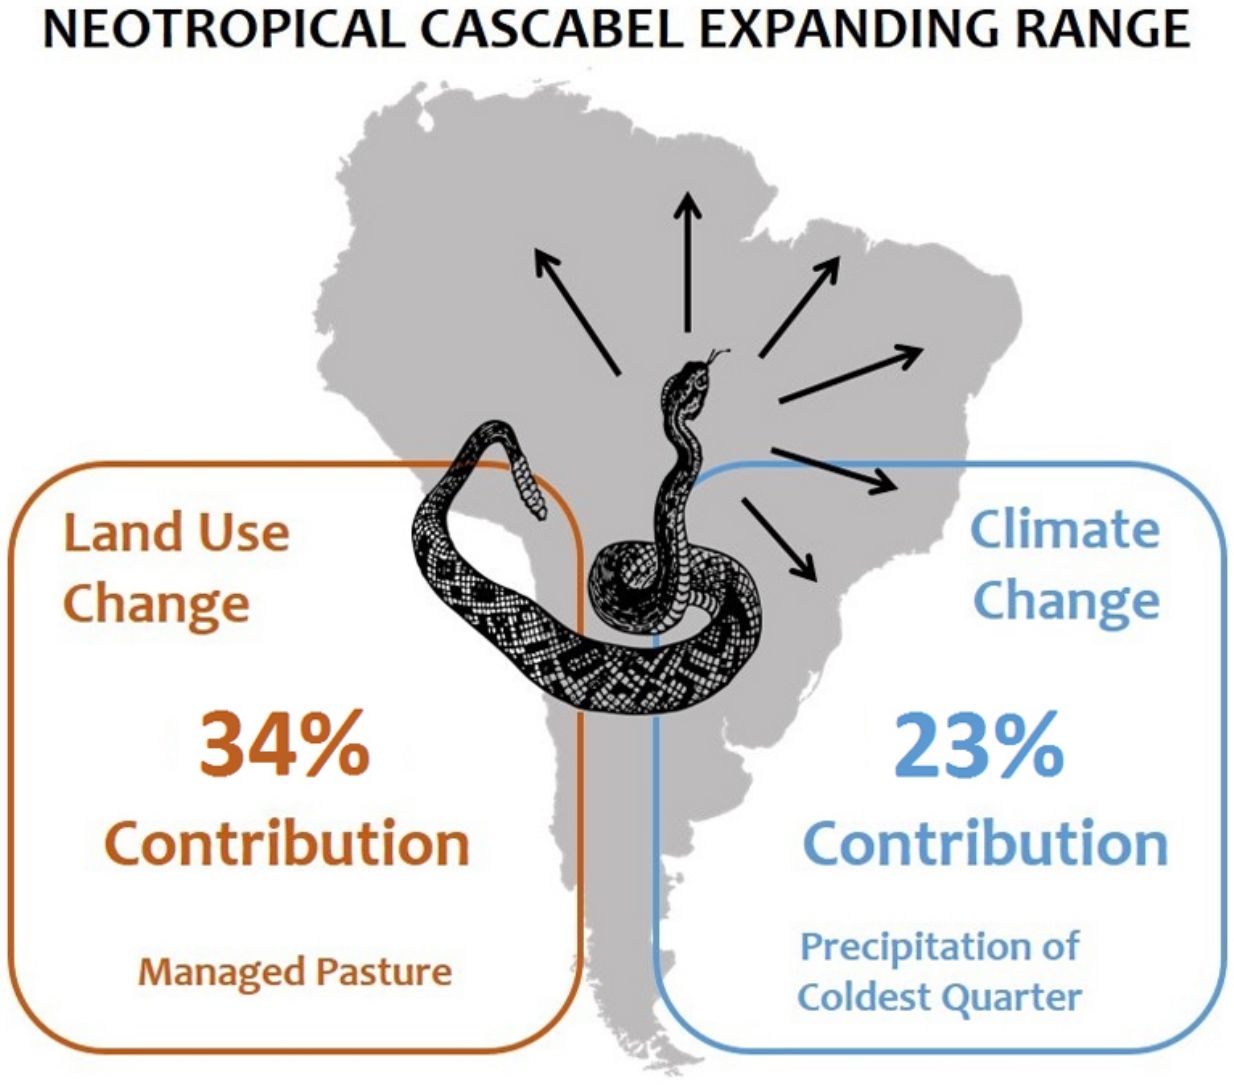
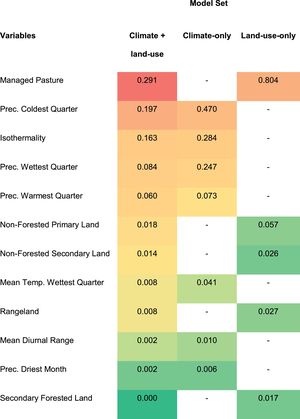
The ‘precipitation of coldest quarter’ (mean = 0.33) and ‘isothermality’ (mean = 0.22) were the most important variables in models including climate, whereas ‘managed pasture’ (mean = 0.54) was the one that most contributed to models including land-use land-cover data (Table 1). In general, the predicted probability of occurrence of C. durissus showed a negative relationship with ‘precipitation of coldest quarter’ and ‘isothermality’ and a non-linear positive relationship with ‘managed pasture’, in which occurrence decreased after large values of managed pasture (Fig. S1, supplementary material).
Variables’ contribution to ecological niche models of Crotalus durissus. Contribution of climatic and land-use land-cover variables for the three sets of models used. The color gradient visually indicates how much each variable contributed to the models. The highest values are represented by red and the lowest, by shades of green.
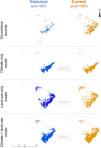
In the geographic space, models that included land-use land-cover variables predicted a surface with several discontinuities compared to the climate-only model (Fig. 3). A comparison among model sets for C. durissus shows that the ensemble model that combined climate and land-use projected, proportionally, the largest post-1950 range, accounting for almost 15% of range expansion in comparison with the other two ensemble models (Table 2). The climate + land-use model was also the one with the best fit to the observed post-1950 occurrence records, pointing to a major role of land-cover and climate in the current observed expansion of C. durissus range (Table 2). This indicates that both land-cover and the climate are becoming more suitable for C. durissus through time.
Predicted Crotalus durissus post-1950 range. Sensitivity refers to presences correctly predicted using observed post-1950 occurrence records.
| Model set | |||
|---|---|---|---|
| Climate-only | Land-use only | Climate + land-use | |
| Projected range post-1950 (km2) | 2,720,000 | 3,725,000 | 3,456,789 |
| Range expansion between pre and post-1950 (%) | 11.8% | 4.8% | 14.3% |
| Sensitivity (%) | 53.6% | 62.9% | 75.9% |
When projected, it was possible to observe that the modeled uncertainties (pre and post-1950) occupied a small area and it was, mainly, concentrated along patches in Caatinga and Chaco regions (Figs. S2–S7, supplementary material).
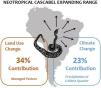
DiscussionOur results show that C. durissus is indeed expanding its geographic range since1950’s, and that this expansion is influenced both by land-use and climate changes. Models based on bioclimatic or land-use land-cover data only attained similar general trends, but the combination of both models shows that climate alone cannot explain this geographic expansion, which is clearly strengthened by the increase in pasture areas. Indeed, managed pasture was the land use variable most important to explain C. durissus’ probability of occurrence (Table 1), with a sharp positive relation for low and medium pasture values, that either levels off or becomes a negative relationship for very high pasture values (Fig. S1, supplementary material). Comparing the models pre- and post-1950 one can notice that post-1950 there was a significant expansion of C. durissus to more inland areas of Brazil, including the arc of deforestation in the Amazon (Fig. 3), an area that endured about 50% of global deforestation of tropical humid forests (Hansen et al., 2008; Colli et al., 2015). In the mid-1950s, Brazil began a period of successive technological revolutions and mechanization of agriculture (Steffen et al., 2004; Steffen et al., 2015; Silva and Arbilla, 2018), accelerating the deforestation and expansion of monocultures and cattle ranching (Steffen et al., 2004; Steffen et al., 2015; Vieira, 2019). Since this period, human occupation in the Amazon has continually moved northwards, expanding the arc of deforestation (Armenteras et al., 2013a, b; Colli et al., 2015; Vieira, 2019).
Similar processes also occurred in the southern portion of C. durissus distribution. In northwestern Argentina during the second half of 20th century, the Gran Chaco has suffered a severe reduction in area due to deforestation mostly for soybean plantation, but also livestock (Zak et al., 2004; Boletta et al., 2006; Grau et al., 2005; Volante et al., 2012). This enabled the geographic expansion of C. durissus as shown here (Fig. 3).
Although land-use change, particularly the expansion of pastures, seems to be the main factor behind C. durissus’ geographic expansion since the 1950's, our study shows that it operates together with climatic change. We found that precipitation of coldest quarter and isothermality - the last representing the ratio of mean diurnal range to the annual temperature range - had the second and third greatest contribution to C. durissus’ ecological niche models, respectively (Table 1). Precipitation of the coldest quarter indicates the amount of rain during winter and our models predicted higher probabilities of occurrence of C. durissus during drier periods in the winter. The isothermality indicates how severe the variation of temperature in a month is when compared to annual variation in temperature. In our case, our models predicted that C. durissus was more likely to occur when the variation of temperature in a month was less abrupt when compared to the variation of temperature over a year (Fig. S1, supplementary material).
Despite the lack of studies associating the behavior of Crotalus species to precipitation patterns, we here suggest some interpretations of the response curves for this variable. The model for the period pre-1950 predicted a distribution of C. durissus covering distinct Brazilian areas, except the north region where the Amazon forest is located, showing the highest pluviometric averages in the country (Nimer, 1989). Although this warm climate is suitable, since C. durissus inhabits open and dry areas and remains active throughout the year (Campbell and Lamar, 2004; Tozetti and Martins, 2013), the dense vegetation cover coupled with the high and constant pluviometric index of this region ( = wetter habitats), may act as a natural barrier to its dispersal.
With the exception of the southern Brazil, which has a well-distributed pluviometric index throughout the year (although much lower than that of Amazon) and a temperate climate phytophysiognomy, the remaining of the country is characterized by greater pluviometric seasonality, showing a heterogeneous distribution of rainfall throughout the year and, consequently, a well-marked dry seasons (Nimer, 1989; Pereira et al., 2013). According to the response curves of the precipitation of the coldest quarter (Fig. S1, supplementary material), high values of this variable could represent a slightly greater climatic homogeneity throughout the year, at least in terms of humidity, leading to a potential decrease in pluviometric seasonality, which could reduce the fitness of C. durissus, and precludes its dispersion. In other words, it is important that the dry and wet periods are well-marked. If the dry period starts to have more rain (Precipitation of Coldest Quarter), this seasonality decreases and, consequently, reduces the probability of C. durissus occurrence.
Tozetti and Martins (2008) showed that C. durissus controls body temperature to avoid overheating during the day and also selects microhabitats based on substrate temperature. These are attributes typical of a generalist species, which may possibly explain its distribution in such diverse microclimates, corroborating studies that suggest a great adaptive potential for the taxon (Bastos et al., 2005; Sawaya et al., 2008; Tozetti and Martins, 2008; Hartmann et al., 2009; Nori et al., 2014; Benício, 2018; Fiorillo et al., 2020). However, our results show that high values of isothermality affects the probability of occurrence of this taxon, meaning that despite its physiological plasticity, C. durissus is sensitive to large temperature oscillations within a month relative to a year. Putman and Clark (2017) investigated the thermal tolerance of a congener (C. oreganus), showing that hunting activity and movements in and out of refugee varies according to body and mean daily air temperatures, which indicates some level of correlation between the species’ fitness and environmental temperature oscillations. This is also indicated here by the effect of isothermality in C. durissus, although this issue still requires empirical investigation.
The geographic expansion of C. durissus post-1950 may also be related to trophic interactions that are changing due to a global warming intensification, a hypothesis not tested here. Whitford et al. (2021) propose that faster defensive attacks due to higher temperatures means that Crotalus spp. may experience reduced risks of predation by endothermic animals. According to the authors, the absence of ontogenetic variation in the diet of C. durissus can favor the recruitment of juveniles to newly colonized areas as long as there are available food resources, and rodents are a type of prey abundant in anthropized areas (Tozetti and Martins, 2008). In other words, contrary to what occurs in other snake taxa, C. durissus does not have a specific diet when young and feeds preferentially on small mammals throughout its life. As rats are closely associated with anthropized environments, it is natural to move to these areas due to its greater availability of food. On the other hand, a potential increase of the pluviometric index in southern Atlantic Forest and Pampa as predicted by some studies (IPCC, 2021; Vale et al., 2021), could impair the fitness of C. durissus at least in these regions, precluding its dispersion.
It is important to acknowledge, however, that the projected range expansion could be potentially different if some biotic, demographic and/or dispersal attributes would be considered (Anderson, 2013). The inclusion of potential prey, predators and/or competitors as an explanatory variable, for example, would, potentially, yield a different geographic occupation of the area (biotic noise assumption). However, these data are often hard to find and strict co-occurrence does not necessarily mean predation or competition. Also, we are assuming that random fluctuations in birth and death rates are small compared to the overall population size (demographic noise assumption) and dispersal movements are stochastic processes where the probability of a species colonizing a new location is a function of its suitability and the dispersal distance (dispersal noise assumption). Nevertheless, the range expansion of C. durissus is empirically observed and as we showed here a function of climate and land-use changes.
Given that C. durissus is a venomous snake, its expanding range has major public health implications in developing countries (Gutiérrez et al., 2017). Matos and Ignotti (2020) pointed out that accidents with Crotalus were unique in showing an increasing trend in Brazil during the period between 2003 and 2012, mainly for the Cerrado and Pampa biomes, where pasture areas and monocultures are expanding. This tendency towards an increase in accidents may characterize an amplified risk of death in relation to snakebite accidents in general (Matos and Ignotti, 2020). Snakebites must be viewed as a dynamic problem (Nori et al., 2014), considering the effects of climate changes, anthropic actions, and shifts in land use and land cover over time on the distribution of venomous snakes. As we have shown here, the expansion of C. durissus is strongly associated with the conversion of forest into open habitats through deforestation. The process is potentialized by climate change, that cannot be reverted in the short or medium term (IPCC, 2021). Therefore, the most efficient management strategy is to reduce the conversion of forest habitats into open habitats and revert the situation when the conversion has already happened to avoid potential accidents in the future. That means, specifically, to control deforestation in the Amazon region, where more than 80% of the forest still stands (SPA, 2021), and to promote reforestation of Atlantic Forest, where less than 30% of the forest remains (Rezende et al., 2018). These actions would not only be beneficial in the specific case of C. durissus’ range expansion, but have countless co-benefits for biodiversity and humans alike, including climate change mitigation, climate regulation, soil preservation, and water and food security (Griscom et al., 2017; Bustamante et al., 2019; Griscom et al., 2020; Mackey et al., 2020).
Author statementsGFCG, DSF and MMV conceived the ideas and designed methodology; GFCG and MMV gathered the data; RT did data analysis; GFCG, MMV and RT produced maps and figures; all authors led the writing of the manuscript. All authors contributed critically to the drafts and gave final approval for publication.
Compliance with ethical standardsThe authors declare that they have no known competing financial interests or personal relationships that could have appeared to influence the work reported in this paper.
Declaration of interestsGabriela Ferreira Campos Guerra reports financial support was provided by National Council for Scientific and Technological Development. Gabriela Ferreira Campos Guerra reports financial support was provided by Brazilian Coordination for the Improvement of Higher Education Personnel. Mariana Moncassim Vale reports financial support was provided by National Council for Scientific and Technological Development. Mariana Moncassim Vale reports financial support was provided by Chagas Filho Foundation for Research Support of the State of Rio de Janeiro. Rodrigo Tardin reports financial support was provided by Brazilian Coordination for the Improvement of Higher Education Personnel. Daniel Silva Fernandes reports financial support was provided by National Council for Scientific and Technological Development. Daniel Silva Fernandes reports financial support was provided by Brazilian Coordination for the Improvement of Higher Education Personnel. Daniel Silva Fernandes reports financial support was provided by Chagas Filho Foundation for Research Support of the State of Rio de Janeiro.
MMV received support from the National Council for Scientific and Technological Development (CNPq Grant no. 304309/2018-4, 304908/2021-5) and the Chagas Filho Foundation for Research Support of the State of Rio de Janeiro (FAPERJ Grant no. E-26/202.647/2019). GFCG and RT received MSc and post-doc fellowship, respectively, from the National Council for Scientific and Technological Development (CNPq Grant no. 131867/2015-6) and the Brazilian Coordination for the Improvement of Higher Education Personnel (CAPES Grant no. 001). GFCG receives PhD fellowship from the Brazilian Coordination for the Improvement of Higher Education Personnel (CAPES Grant no. 88887.614469/2021-00). DSF thanks National Council for Scientific and Technological Development (CNPq Grant no. 308567/2019-6), Brazilian Coordination for the Improvement of Higher Education Personnel (CAPES Grant no. 88887.159161/2017-00), and Chagas Filho Foundation for Research Support of the State of Rio de Janeiro (FAPERJ Grant no. E-26/211.154/2019), for financial support. This study was developed in the context of the National Institute for Science and Technology in Ecology, Evolution and Conservation of Biodiversity (INCT EECBio, CNPq Grant no. 465610|2014-5, FAPEG 201810267000023) and the Brazilian Network on Global Climate Change Research (Rede CLIMA) (FINEP Grant no. 01.13.0353-00).
The following is Supplementary data to this article: