


Gaps in geographic, genetic, and ecological data persist for many plant species, particularly those with restricted populations that are often rare and endangered. This lack of data hampers conservation efforts, especially in regions facing rapid habitat degradation and limited research investment. Additionally, technological, methodological, financial, and governmental challenges further hinder data collection. To address this issue, we developed the Multi-Scale Habitat and Population Rapid Assessment (MHPR) methodology, integrating widely tested, low-cost, and rapid-application technologies to assess distribution, demography, and population decline risks in species with restricted populations. We applied this approach to Butia pubispatha, a critically endangered dwarf palm endemic to the southern Brazilian grasslands, known from a single recorded population. In the first phase, we used Landsat satellite imagery and the Normalized Difference Vegetation Index (NDVI) to analyze habitat degradation between 2013 and 2021. Using landscape ecology principles, we identified the focal habitat patch with the highest potential to support the species. In the second phase, we conducted systematic transects and distance sampling within this area, mapping the population and identifying less degraded sectors. The highest-density sector was censused. In the third phase, we analyzed spatial patterns using Morisita’s Index and Ripley’s K function. Our method proved highly effective and replicable. NDVI successfully detected habitat changes over time, revealing an 86.7% reduction in the focal habitat patch from 2013 to 2021, underscoring the species’ critical threat due to habitat degradation. We recorded 1,615 individuals, with an estimated density of 81.2 in/ha and a dispersal range of 145 m. A second population was identified in this study. Our findings provide key insights for phenological studies, seedling production, genetic research, and public policies aimed at establishing protected areas and translocating individuals for the conservation of Butia pubispatha.

The fragmentation and reduction of natural habitats are accelerating the global biodiversity decline. Currently, c. 58% of the Earth’s surface is under significant human pressure, with only 25% classified as wilderness and 0.4% remaining intact (Strassburg et al., 2020; Almond et al., 2020). This alarming trend is exacerbated by significant knowledge gaps concerning numerous species, particularly rare and threatened plants, including their geographic, genetic, and ecological data (Cornwell et al., 2019). Nearly half of plant species lack detailed distribution data, and 90% have not yet been assessed for extinction risk (Pelletier et al., 2018; Bachman et al., 2019). Among the species evaluated by the International Red List, 22% are threatened, predominantly in tropical regions, which experience the highest rates of habitat loss (Brummitt et al., 2015; Almond et al., 2020). This highlights the urgent need to prioritize research on understudied species in areas experiencing rapid habitat degradation (Umaña et al., 2017).
Brazil is one of the countries with the highest demand for ecological research, hosting one of the world’s richest biological diversities, with 46,097 vascular plant species, of which 43% are endemic and 7% are threatened (Brazil, MMA, 2022). However, the biodiversity metadata of Brazil, as in many developing tropical countries, is poorly documented, with a predominant focus on vertebrates and limited attention on plants. Consequently, most field data remain inaccessible to a significant portion of researchers (Guimaraes et al., 2024). For rare species with few records, conducting research is even more challenging because they tend to go unnoticed and receive limited scientific attention (Feeley, 2015; Støa et al., 2019; Trindade and Marques, 2024).
Research on rare and threatened species primarily relies on distribution data (Tienes et al., 2010). However, the primary methods for investigating species distribution, such as Remote Sensing (RS) and Species Distribution Models (SDMs) (Randin et al., 2020), face significant challenges for geographically restricted species with few occurrences. Although these tools are crucial for accelerating the understanding of species distribution (Franklin, 2023; Cerrejón et al., 2021), their application is often limited to species with sparse records (e.g., species with restricted populations) because of the lack of detailed information on suitable habitats and specific localities (Pearson et al., 2007; Wisz et al., 2008; Chen and Lei, 2012). The geographic distribution of many species remains largely unknown, particularly in tropical regions, where information gaps are most pronounced (Hortal et al., 2014; Hughes et al., 2021). Alarmingly, it is estimated that 74% of plant species in South America have < 20 records, and 10% lack records entirely because of data loss or the absence of digitization (Feeley, 2015; Trindade and Marques, 2024). This situation persists despite increased access to digitized biodiversity data (Sousa-Baena et al., 2014).
Beyond distribution knowledge, demographic understanding is essential for conservation decision-making and reintroduction of rare species, typically with restricted populations. (Tienes et al., 2010). Demographic insights enhance the predictive capacity for estimating population viability (Tienes et al., 2010) and play a crucial role in identifying trends in population decline or expansion (Peres et al., 2003; Wright, 2003). Furthermore, the spatial demographic pattern of a population often serves as a starting point for formulating hypotheses about various ecological behaviors (Dale, 1999) and provides answers about intra and interspecific interactions (Palmiotto et al., 2004; Stoll and Bergius, 2005; Rodrigues et al., 2007). This information supports the design of management and conservation strategies for species of interest (Anjos et al., 1998).
Generally, demographic data collection techniques include censuses, random walk counts, and standardized searches (Tienes et al., 2010). In addition, they incorporate biometric data collection (Stears et al., 2022) and increasingly employ remote sensing to become more efficient in less time (Fadeev et al., 2019). However, these methods are costly and time-consuming and do not facilitate planning efforts to save species on the brink of extinction. This requires adaptation to make them more agile and economically viable, especially in countries with low investment in scientific research (Tienes et al., 2010).
In this context, our study aimed to develop a methodology that leverages agile and cost-effective tools to identify individuals and assess demographic patterns of species with restricted populations. Our method integrates remote sensing techniques, habitat analysis based on landscape ecology principles, and population sampling using linear transects, and provides rapid answers regarding: (1) habitat characterization and degradation dynamics, (2) population extent, (3) spatial demographic patterns, (4) evidence of population decline, and (5) the existence of additional populations. We emphasize that our methodology aims to strategically combine well-established tools and techniques to streamline a process that is typically costly and time-consuming.
Our method was tested on Butia pubispatha Noblick and Lorenzi, a small palm species that is difficult to detect both in satellite imagery and in the field, facing a critical conservation status similar to that of many tropical species. This species is endemic to the native grasslands from Southern Brazil, has only a single known population, which is under significant threat due to agricultural and silvicultural expansion (Sociedade Chauá, 2022).
MethodsOur novel method, referred to as Multi-Scale Habitat and Population Rapid Assessment (MHPR), integrates well-established, accessible, and efficient techniques and is structured into three main phases (Fig. 1).
 method.")
The first phase involves remote sensing analysis of the region in which the restricted population of the focal species is concentrated. This allows the identification of key areas for study by analyzing satellite imagery and the Normalized Difference Vegetation Index (NDVI) to detect landscape transformations, dispersal barriers, and potential habitats. Similar approaches have been widely used in landscape ecology, habitat characterization, and species detection (e.g., Bonthoux et al., 2018; Germain et al., 2019; Pesaresi et al., 2020; Rapinel et al., 2020; Minatti et al., 2023; Hambardzumyan, 2024; Araujo and Ribeiro, 2024).
The second stage uses the results from the first phase to design and conduct field surveys. Distance sampling techniques (Buckland et al., 2001; Miller et al., 2016) are applied to estimate the extent of the focal species’ population and to explore the presence of new populations in surrounding areas. This phase is critical, as many species with restricted populations have only isolated occurrence records with limited information on population size or conditions (Trindade and Marques, 2024). To improve accuracy, we propose a two-step approach: a rapid assessment of the entire population’s extent, followed by a detailed analysis in a less disturbed sector. This strategy can be adapted based on species and environmental conditions. The methodology incorporates techniques optimized for rapid sampling, drawing from studies such as Drummer and McDonald (1987); Elzinga and Salzer (1998); Martorell and Peters (2005); Buckland et al. (2007); García and Chacoff (2007); Kissa and Sheil (2012); Flesch et al. (2019); Knights et al. (2020), and Marcenó et al. (2022).
The third step consists on processing the collected data to identify spatial and demographic patterns within the population. Distance-based estimators and the Morisita Index and Ripley’s K function are applied for population density calculations. These methods follow widely applied ecological approaches (e.g., Haase, 1995; Bunyavejchewin et al., 2003; Buckland et al., 2007; García and Chacoff, 2007; Law et al., 2009; Kissa and Sheil, 2012; Amaral et al., 2015; Flesch et al., 2019; Knights et al., 2020; Souza et al., 2021; Hai et al., 2021; Wang et al., 2022; Marcenó et al., 2022; Khadka et al., 2024). The results are expected to potentially support conservation and management strategies for species with restricted populations.
The following sections provide a detailed overview of the target species (case study), the study area, and each phase of the methodology.
Target speciesButia pubispatha is a very short palm, reaching c. 35 cm in height and 4.5–20 cm in diameter. Its leaves are spirally arranged and range from 5 to 18 cm in length (Lorenzi, 2010). This species thrives under high solar exposure and is found in natural grasslands (Corrêa et al., 2009). It is a rare species (Eslabão, 2017) and has been categorized as “Critically Endangered” (CR) by the National Center for Flora Conservation (CNCFlora) (Sociedade Chauá, 2022). Furthermore, it is classified as one of the most fragile gap species, i.e. those CR species that are not inside any protected areas, in Paraná (Sampaio et al., 2023).
Study areaThe site of interest encompasses the only known location where the species has been recorded (24°12'38.47" S and 49°39'4.78" W) and its surroundings (Fig. 2), in the municipality of Jaguariaíva, Paraná, Brazil, within the Rio das Mortes watershed, at an average altitude of 789 m.

According to the Köppen classification, the climate is humid subtropical (Cfb), characterized by cool summers, severe frosts, and no dry season, with average temperatures below 22 °C in the warmest month and below 18 °C in the coldest month (Maack, 2012; Alvares et al., 2013). Annual relative humidity ranges between 80.1% and 85%, and precipitation varies from 1,300 to 1,500 mm (IAPAR, 2023).
The area is located on the Second Plateau of Paraná, with fragile, low-fertility, sandy, shallow soils that are highly prone to erosion (Maack, 2012). Vegetation in the region includes both forested and grassland physiognomies (Von Linsingen et al., 2006), but the species of interest is found exclusively in homogenous natural grasslands, often associated with rocky outcrops characterized by shallow, nutrient-poor soils, herbaceous vegetation, and woody shrubs. Notably, Southern Brazilian grasslands are among the most degraded ecosystems in the country (Overbeck et al., 2022, 2023), originally covering c. 15% of Paraná State (Maack, 2012) but now reduced to just 0.1% of their original extent (Fundação and Instituto Nacional de Pesquisas Espaciais, 2019). Indeed, many of the species occurrence areas have been altered by the establishment of Pinus sp. plantations (initiated in 2018) and the invasion of Urochloa sp. (Sociedade Chauá, 2022).
Phase 1- remote sensing analysisThis phase was designed to understand the species’ habitat and its degradation dynamics over time, followed by an assessment to guide field surveys and demographic studies. This process began with the definition of the study area (Fig. 2), which was established as the region surrounding the species’ occurrence point. This area was determined based on its high probability of species occurrence, characterized by a greater proportion of habitat patches with potential connectivity over a historical period. To achieve this, we used Google Earth images, which provide adequate temporal resolution and sufficient detail to evaluate changes over time. High-resolution images from 1985 and 2001–2018 enabled the analysis of historical habitat modifications and the identification of dispersal barriers such as roads, agricultural areas, and forest plantations ultimately delineating the study area.
Within the study area, the Normalized Difference Vegetation Index (NDVI) was used to better locate habitat patches and characterize degradation dynamics. The NDVI, which directly correlates with plant biomass, is widely applied for vegetation categorization and the assessment of ecological variations (Liu, 2007). NDVI calculations were performed using Landsat 8/OLI satellite images from orbit 221, path 77, with 30 m spatial resolution and 11 spectral bands obtained from the U.S. Geological Survey. Images were selected from periods with significant habitat variation and minimal cloud cover. The optimal dates for the historical period of interest were July 13, 2013, July 27, 2018, and July 3, 2021. The definition of the focal habitat boundaries was based on images from 2013 and 2018. Subsequently, a 2021 image was included to further investigate the historical landscape transformation dynamics. The NDVI was processed in ArcGIS 10.6.1, with atmospheric corrections based on standardized methods (Ariza, 2013; Krizek and Santos, 2021).
NDVI validation was performed considering land-use presence/absence data from 25 control points per image. Field validation was conducted in 2018 and 2021, while 2013 control points were identified using high-resolution Google Earth imagery (Appendix S1). Confusion matrices were used to compare land-use classifications from satellite analyses with field observations, enabling accuracy calculations (Giannini, 2011; Passo, 2017). Overall Accuracy measures the proportion of correctly classified map areas relative to reference data (Story and Congalton, 1986). Producer Accuracy (PA) assesses the probability of correctly identifying a land-use class, while User Accuracy (UA) evaluates how often a class matched field observations (Congalton, 1999; Mastella and Vieira, 2018). The Kappa index (K) quantifies classification accuracy beyond random chance, following Cohen’s formula (1960).
Kappa index results were compared to quality thresholds described by Landis and Koch (1977). Statistical significance and accuracy were evaluated using the Z-statistic (Brites et al., 1996). For each land-use class matrix, the Z values were calculated by assuming a normal distribution. The Z-statistic and associated p-values were computed using Biostat 5.3 software (Congalton and Green, 2009). A classification is considered significantly better than random when Z ≥ Zα/2, where α/2 represents the confidence level of the Z-test, assuming infinite degrees of freedom (Rudorff et al., 2007).
Based on the results of Google Earth image analyses, NDVI assessments, and in situ landscape recognition up to 2018, we identified the areas within the study site most likely to host the population. This process followed key principles of landscape and population ecology:
- •
Habitat quality and extent are critical for the survival and distribution of species (Saunders et al., 1991; Fahrig, 2003; Martinelli and Moraes, 2013).
- •
The size of a habitat patch positively influences the probability of species occurrence (Forman et al., 1976; Saunders et al., 1991; Metzger, 1999; Primack and Rodrigues, 2001).
- •
The degree of isolation of a habitat patch affects the dispersal of fauna and flora, with isolation generally reducing immigration rates and species richness (Metzger, 1999).
Considering the assessed history of habitat degradation, the methodology assumes that the largest habitat fragment associated with the species’ occurrence point has the highest ecological quality and the greatest likelihood of hosting the majority of the Butia pubispatha population, referred to as the focal habitat patch.
Phase 2 - sampling, delimitation, and population demographyFocusing on the designated focal habitat patch determined in the previous phase, we established a sampling design to determine the extent of the population’s occurrence and, more importantly, to identify areas with the highest specimens’ density. The sampling was designed to provide rapid results and optimize fieldwork efficiency. To determine the best sampling approach, we analyzed the condition of the focal habitat patch using Google Earth images and property maps provided by the landowners. This allowed us to refine the areas of suitable habitat, excluding regions identified by the NDVI as unsuitable, such as wetlands or steep slopes, ultimately defining 74.00 ha as the search area for the survey.
We implemented a combination of survey techniques to simultaneously determine the population boundaries and quantify population density, assuming that the population was distributed throughout the focal habitat patch (142.65 ha). To achieve this, we established linear transects within the search areas following the principles of distance sampling. This technique involves measuring the perpendicular distances of individuals from a sampling line or point and using these distances to estimate population density and abundance (Buckland et al., 2001; Miller et al., 2016).
The transects were positioned based on the spacing between the Pinus plantation rows, which currently cover a significant portion of the focal habitat patch. The observation width was set to match the plantation spacing (average spacing of 2.5 × 2.5 m), with transect lengths varying according to the traversed slope. Starting from the first transect, located at the edge of the patch near the species’ occurrence point, subsequent parallel transects were established every five plantation rows, resulting in a distance of c.12.5 m between transects. Field surveys along these transects were conducted on horseback, with support from rural roads surrounding the search areas. A total of 191 transects were required to cover the search sectors, sampling an area of 23.67 ha. Each species individual was georeferenced using a Garmin Etrex 22x GPS. Data were collected between August–December 2020.
Using ArcGIS 10.6.1 and its Kernel Density tool, we assessed the population’s extent of occurrence and identified the area with the highest individuals density. In this high-density sector, covering 18.2 ha, we conducted a census by intensifying transect sampling, surveying all plantation rows (2.5 m wide and variable length) to obtain more precise analyses of the species’ distribution patterns.
Phase 3 - demographic data analysisDemographic analyses were conducted considering both the sampling and census sectors. Spatial pattern analyses were based on census data.
We used the R package Windows Distance 7.5 (R Core Team, 2019) to build a model of detection probability for individuals based on their perpendicular distances from the transects (Buckland et al., 2005; Buckland et al., 2010). This model was used to produce density estimates, including calculations of the coefficient of variation and sampling error (Miller et al., 2016) (Appendix S2). To assess the species’ spatial distribution pattern, we used the Morisita Dispersion Index (Id) (Smith-Gill, 1975; Brower et al., 1984). Additionally, Ripley’s K-function was applied, as it uses the geographic coordinates of individuals, providing cumulative distance-based measurements to indicate variations in spatial patterns across scales (Ripley, 1981; Rahbek, 2005).
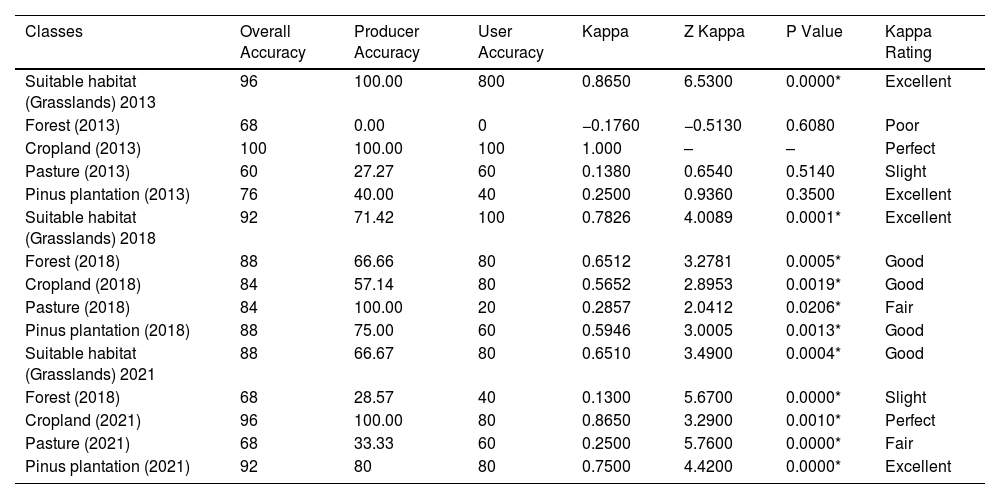
ResultsThe first phase of the methodology aimed to characterize the habitat and the degradation dynamics, which were achieved through the results of satellite image analyses. The NDVI proved highly effective in detecting the suitable habitat (natural grasslands), with a high Kappa throughout the historical series and strong statistical significance (Table 1). This finding confirms the reliability of the method for analyzing habitat transformations, which is the central objective of this phase. NDVI values were subdivided into recognizable classes within the study area for 2013, 2018, and 2021 (Fig. 3) (Appendix S3). The results were also satisfactory for cropland and Pinus plantations but problematic for forest and pasture. In some cases, distinguishing between native and planted forests, or pastures and the species’ habitat resulted in low Kappa or inconsistencies.
Performance of the methodology for land-use classes of interest in the study area.
| Classes | Overall Accuracy | Producer Accuracy | User Accuracy | Kappa | Z Kappa | P Value | Kappa Rating |
|---|---|---|---|---|---|---|---|
| Suitable habitat (Grasslands) 2013 | 96 | 100.00 | 800 | 0.8650 | 6.5300 | 0.0000* | Excellent |
| Forest (2013) | 68 | 0.00 | 0 | −0.1760 | −0.5130 | 0.6080 | Poor |
| Cropland (2013) | 100 | 100.00 | 100 | 1.000 | – | – | Perfect |
| Pasture (2013) | 60 | 27.27 | 60 | 0.1380 | 0.6540 | 0.5140 | Slight |
| Pinus plantation (2013) | 76 | 40.00 | 40 | 0.2500 | 0.9360 | 0.3500 | Excellent |
| Suitable habitat (Grasslands) 2018 | 92 | 71.42 | 100 | 0.7826 | 4.0089 | 0.0001* | Excellent |
| Forest (2018) | 88 | 66.66 | 80 | 0.6512 | 3.2781 | 0.0005* | Good |
| Cropland (2018) | 84 | 57.14 | 80 | 0.5652 | 2.8953 | 0.0019* | Good |
| Pasture (2018) | 84 | 100.00 | 20 | 0.2857 | 2.0412 | 0.0206* | Fair |
| Pinus plantation (2018) | 88 | 75.00 | 60 | 0.5946 | 3.0005 | 0.0013* | Good |
| Suitable habitat (Grasslands) 2021 | 88 | 66.67 | 80 | 0.6510 | 3.4900 | 0.0004* | Good |
| Forest (2018) | 68 | 28.57 | 40 | 0.1300 | 5.6700 | 0.0000* | Slight |
| Cropland (2021) | 96 | 100.00 | 80 | 0.8650 | 3.2900 | 0.0010* | Perfect |
| Pasture (2021) | 68 | 33.33 | 60 | 0.2500 | 5.7600 | 0.0000* | Fair |
| Pinus plantation (2021) | 92 | 80 | 80 | 0.7500 | 4.4200 | 0.0000* | Excellent |

The focal habitat patch declined by 32.4 % from 2013 to 2018 (142.65 ha to 96.37 ha), primarily replaced by Pinus plantations and exposed soil. By 2021, habitat loss reached 86.7%, with Pinus plantations replacing most of the remaining area. Only 19.01 ha of the original habitat remained within the focal patch by 2021.
The focal habitat patch for Butia pubispatha originally covered 142.65 ha, as delineated using the 2013 imagery, in a restricted area along both banks of the Das Mortes river.
In the second phase of the methodology, which aimed to assess the extent of the target species’ population, we performed a population sampling within the focal habitat patch. Sampling was conducted across 191 transects covered 23.67 ha of this sector, where 228 individuals were identified. In the census sector (the region with the highest detected density), covering 18.2 ha, 1,477 individuals were recorded, equivalent to an absolute density of 81.2 in.ividuals/ha (Fig. 4) (Appendix S4). We inferred that this density most closely represents the species’ typical distribution pattern.
 and in the census sector, which was restricted to the area with the highest density of individuals.")
The third phase was conducted to complete the demographic and spatial calculations for the target species. We recorded a Morisita Dispersion Index of 1.896, indicating a clumped spatial distribution of the population. Ripley’s K-function further supported this finding, showing aggregation of up to 145 m (Appendix S5). Beyond this distance, there was a trend toward a random distribution, although this pattern did not fully emerge.
The analysis process was quick, with results ready 8 days after data collection and key conclusions reached in 15 days. Based on these results, we attempted to identify evidence of population decline and the existence of additional populations. The maximum distance between individuals at the edges of the focal habitat patch was 1,802 m, suggesting a potential dispersal range. Historical analysis of 1985 Google Earth images revealed that the area surrounding the focal habitat patch at that time consisted entirely of suitable habitat. Based on this information, we hypothesized that habitat patches within a radius of 1,800 m from the central region of the high-density sector might harbor additional individuals. Surveying the remaining habitat patches within this defined radius, we successfully identified a new population (registered deposit in the Curitiba Forestry School Herbarium – EFC, number 24581).
DiscussionPhase 1In this stage, we applied well-established techniques to analyze the effect of habitat degradation in Butia pubispatha, a species with a restricted population, using historical satellite imagery and NDVI time series. NDVI-based temporal analyses are particularly valuable for such studies, as they allow for tracking landscape changes over time and identifying potential dispersal barriers - key factors for the conservation of isolated populations (Germain et al., 2019). Additionally, by integrating spatial and temporal variability, this approach provides a comprehensive understanding of habitat dynamics, making it a powerful tool for planning conservation and management strategies (Hambardzumyan, 2024).
NDVI and Remote Sensing (RS) have been widely used to map vegetation associations and habitats (Pesaresi et al., 2020), monitor spatiotemporal changes in areas occupied by rare species (Hambardzumyan, 2024), and predict species diversity based on vegetation cover (Bonthoux et al., 2018). Multitemporal studies have also successfully mapped functional dimensions of vegetation in Mediterranean regions using MODIS data (Rapinel et al., 2020).
In Brazil, similar approaches have been used to analyze vegetation cover changes in protected areas (Minatti et al., 2023) and to investigate vegetation dynamics in the Araripe-Apodi National Forest (Araujo and Ribeiro, 2024), reinforcing the effectiveness of these methods in understanding landscape transformation. Although these techniques are widely applied in ecological studies, they are not effectively used for rare plant species in the Southern Hemisphere (Cerrejón et al., 2021), underscoring the significance of our study.
Our satellite image classifications demonstrated high accuracy in identifying grassland/savanna habitats (focal habitata) and other land cover classes, effectively delineating areas for population assessments, and identifying a new population. However, NDVI showed limitations in dense vegetation, such as tropical forests, due to the structural and phenological complexity of these ecosystems (Kou et al., 2017; Guzmán et al., 2019; Berveglieri et al., 2021). Additionally, its correlation with heterogeneous regenerating vegetation is restricted, particularly in mountainous terrains (Sader et al., 1989).
Due to its affordability and efficiency, NDVI time series should be more widely applied to monitor restricted populations, particularly in grasslands and savannas requiring urgent conservation efforts. In tropical regions, accessible and efficient complementary techniques include red-edge indices (Liu et al., 2024), multispectral and SAR imagery (Erinjery et al., 2018), texture analysis (Ferreira et al., 2019), and decision tree classifiers (Simard et al., 2000).
By analyzing other studies that utilized RS to estimate the extent of occurrence and identify habitat patches for rare plants, we confirmed that sensor spatial resolution must be tailored to the habitat’s size, especially for plants associated with small patches (de Queiroz et al., 2012; Luoto et al., 2002). Furthermore, habitat specificity significantly influences detection accuracy (Buechling and Tobalske, 2011; Parviainen et al., 2013). Similar to Cerrejón et al. (2021), our findings indicate that a detailed understanding of habitat is critical for achieving reliable RS-based results for rare plants with specific habitats and limited occurrences.
Several studies, including ours, have demonstrated the practical utility of predictive models built entirely from medium-resolution RS imagery to discover previously unknown populations of rare plants (Hernández-Lambraño et al., 2020; Lauver and Whistler, 1993; de Queiroz et al., 2012; Zimmermann et al., 2007). We observed that these studies varied in their knowledge of the species and the availability of distribution data, with these factors being the most influential in determining predictive success. In general, models that combine RS-based predictors with non-RS data, particularly Species Distribution Models (SDMs), tend to perform better in predicting occurrences (Buechling and Tobalske, 2011; Guillera-Arroita et al., 2015). For instance, suitable habitats for Adinandra griffithii were predicted with high accuracy (AUC = 0.99) using SDMs combined with EVI time-series data (Adhikari et al., 2018). Similarly, for Antirrhinum lopesianum in the Iberian Peninsula, SDMs integrated with topographic, vegetation, surface temperature, and moisture index data have yielded strong results (Hernández-Lambraño et al., 2020). However, in our study, as is common for critically endangered species, integrating SDMs was not feasible because of the lack of distribution records for Butia pubispatha. At least three records from distinct locations are required for such models (Pearson et al., 2007). This limitation highlights the importance of advancing research that improves techniques relying solely on RS data.
Phase 2We used line transects and distance sampling to estimate the extent of the B. pubispatha population within the focal habitat patch identified in Phase 1. This approach was chosen because of its efficiency in locating individuals and providing data for rapid demographic and spatial analyses.
The importance of these techniques has been well-documented. Biases in line-transect sampling have been discussed extensively, with key insights provided by Drummer and McDonald (1987), while essential guidelines for monitoring plant populations were established by Elzinga and Salzer (1998). Subsequent studies refined their application; Martorell and Peters (2005) and García and Chacoff (2007) highlighted their value in assessing habitat fragmentation and chronic disturbances in threatened populations. The methodology was advanced by Buckland et al. (2007) through the introduction of statistical models for estimating plant populations, while Kissa and Sheil (2012) demonstrated the effectiveness of visual detection combined with distance sampling for estimating rare tree densities in complex terrain. These techniques have since been applied to rare species in various biomes. Flesch et al. (2019) used them to assess abundance and habitat relationships of a rare cactus in the Sonoran Desert, while Marcenó et al. (2022) developed a multifaceted approach to managing highly restricted endemic vascular plant species, integrating enhanced field sampling strategies.
In our study, we incorporated these well-established methods with standard adaptations to optimize the data collection. The results confirmed their effectiveness in estimating population extent and identifying areas with varying densities across the habitat patch. This allowed us to pinpoint a less degraded sector that is best suited for an in-depth census survey.
Regarding the target species, we found that the population density of B. pubispatha (81 individuals/ha) was lower than that reported for other similar species within the Butia genus. For example, B. purpurascens exhibited densities ranging from 127 to 301 individuals/ha in savannas with varying disturbance levels in Goiás State, Central region of Brazil (Guilherme and Oliveira, 2010). Meanwhile, B. catarinensis exhibited densities of 1,365 individuals/ha in mid-successional restingas (sandy coastal plain vegetation) and 419.43 individuals/ha in restingas altered by Eucalyptus plantations in Santa Catarina state, Southern Brazil (Zanoni, 2022). These differences suggest that the observed density of B. pubispatha reflects prolonged habitat degradation, potentially resulting in a population decline. Comparative studies with other populations of B. pubispatha or similar species distinguishing between ontogenetic stages are necessary to draw more precise conclusions.
Phase 3In this final step, we applied the most widely used indices in the literature to analyze the spatial structure of the target species. Result interpretation varies by species but is crucial for understanding its ecology and informing conservation decisions. Additionally, we integrated data from all phases to search for new populations, detect signs of decline, and assess habitat and landscape conditions for species survival.
Our results indicate that the studied population displays a clumped spatial pattern, a common characteristic among palm species across various habitats, including tropical forests (Boll et al., 2005; Monteiro and Fish, 2005; Souza and Martins, 2002; Svenning, 2001), savannas (Guilherme and Oliveira, 2010; Almeida and Galetti, 2007; Lima et al., 2003), and restingas (Schrickte, 2019). This pattern likely reflects limitations in seed dispersal, which is a frequent phenomenon among zoochorous or autochorous (barochory) plant species. These limitations seem plausible for B. pubispatha because of its short fruiting periods, low seed production, reliance on autochory, and potential animal-mediated dispersal (Hoffmann, 2024).
Zoochorous dispersal in B. pubispatha is probable, as it is common among palms, particularly its closest relative, B. microspadyx. For instance, B. eriospatha and B. microspadix are dispersed by maned wolves (Chrysocyon brachyurus), crab-eating foxes (Cerdocyon thous), and small rodents, particularly Holochilus brasiliensis (Cheida, 2005; Campos, 2009). However, given the limited availability of natural grasslands and savannas in the region (Fundação and Instituto Nacional de Pesquisas Espaciais, 2019; Parolin et al., 2015), along with the increasing difficulty in accessing these habitats for large mammals (Ciocheti, 2007; Metzger, 2006), it is plausible that B. pubispatha faces severely restricted seed dispersal. Studies on genetic distances between individual groups observed in this study could provide valuable insights into the species’ dispersal mechanisms and help determine the precise number of populations.
The combination of habitat history analysis and demographic data strongly suggests a population decline, with habitat modification being the primary threat to B. pubispatha. Between 2013 and 2021, the habitat was drastically reduced. Based on these changes and assuming that the species can only survive within the remaining 19.01 ha of the focal habitat patch in 2021, we estimated that 86.7% of the investigated population will be lost in the coming years due to habitat changes. However, little is known about the species’ tolerance to shading and soil alterations caused by Pinus plantations and other changes, making it challenging to estimate the timeline for potential extinction. Following the precautionary principle, we recommend translocating individuals to safeguard this species.
Future research should focus on age structure and size of individuals to better understand regeneration, growth, and mortality rates, as these factors directly influence population dynamics (Guilherme and Oliveira, 2010). The data and analyses presented here provide a foundation for comparisons with the newly discovered population and for further investigations.
Concluding remarksThe MHPR proved to be a practical and effective approach for locating new records and conducting demographic studies on rare species in grassland or savanna environments. This low-cost, rapid-execution methodology provides critical location and demographic data to inform conservation planning and decision-making. It would also enable future studies, including phenological monitoring, propagule collection, and genetic research.
Additionally, this method can be adapted for other restricted-population species, particularly in grasslands and savannas, aiding the conservation of threatened populations. Our findings confirm the extent, density, and clumped distribution of Butia pubispatha, underscoring its vulnerability to habitat loss. The results may support government agencies and public policies by providing technical evidence for establishing protected areas and identifying suitable sites for individual translocation. Our methodology offers a scalable framework for rapidly assessing restricted species in urgent need of conservation.
Declaration of Generative AI and AI-assisted technologies in the writing processDuring the preparation of this work, the authors utilized ChatGPT 4.0 for text refinement, primarily during the translation phase from Portuguese to English. After using this tool, the authors reviewed and edited the content as needed and assume full responsibility for the content of this publication.
FundingThis study was funded by the Fundação Grupo Boticário de Proteção à Natureza (#1124_20181, #A0027_2019), CNPq-Brazil (doctoral scholarship #141137/2020-7 to PMH, PQ grant #310857/2022-8 to MBC), and CAPES-Brazil (doctoral scholarship #40001016015P0/2024-3 to ACFS, Finance Code 001). Additional support was provided by the Kilverstone Wildlife Charity Trust, Botanic Gardens Conservation International (#GBGF/2023/03), the Whitley Fund for Nature (#WA 2022), One Tree Planted, Fondation Franklinia, and Sociedade Chauá. Resources for the new population search were partially funded by the Territorial Action Plan for the Conservation of Endangered Species Caminho das Tropas Paraná-São Paulo.
We dedicate this work in memory of biologist Leonardo Von Linsingen, a researcher who inspired us and pointed out the location of the species’ record. We extend our gratitude to Diego Cunha, owner of Fazenda Joaquim Menino (study area), for granting research permissions and providing logistical support. We are grateful for the logistical assistance and field tips from Chico Bacana and Leonel Anderman. Special thanks to Fernanda Thiesen Brum for her valuable insights during the research conception. We also thank the entire team of Sociedade Chauá, especially Rogério Silva, for his incredible dedication, the committed field volunteers, and the anonymous reviewers for their critical contributions and support. SJEV thanks the Center for Open Geographical Science (COGS), Department of Geography, San Diego State University for the research support.
The following is Supplementary data to this article:

