


Climate change may impose extreme conditions which potentially affect species’ distributions, leading to spatio-temporal variation in biodiversity and ecosystem services patterns. Here we compared current climate conditions to future climate scenarios projected to 2050 to assess potential changes in the spatio-temporal patterns of the taxonomic and functional diversities of the woody species of the Restinga vegetation in Brazil. We generated Ecological Niche Models (ENM) for 796 woody plant species from which we estimated the spatio-temporal changes of beta diversity components, the community-weighted means (CWM) of selected traits and functional diversity indices. The pessimistic scenario indicated an overall threefold increase in woody plant species loss compared to the optimistic scenario, whereas at regional scales, species loss may reach percentages as high as 19%. Conversely, beta diversity may increase in the future, in which the turnover component had a greater contribution than nestedness. The CWM projection emphasized contrasts among traits and ecoregions, with an increase in most analysed traits (stem wood density, seed length and fruit length) and a decrease in one of them (maximum plant height). Functional divergence and richness may decrease in future, while functional evenness may increase. Our study highlighted important potential changes in the distribution of biodiversity that could lead to biotic homogenization in the Restinga vegetation and calls for the inclusion of this marginalized vegetation in plans for mitigation and adaptation to climate change.
The impacts of climate change on the world’s ecosystems have already been documented on every continent, ocean and in most taxonomic groups (Scheffers et al., 2016). Greenhouse gases atmospheric concentrations are reaching levels never seen in recent history nor estimated over the past 20 million years (Beerling and Royer, 2011). Coupled with the intensification of habitat loss and aggressive land-use change, climate change represents one of the main threats to biodiversity and associated ecosystem services, particularly to tropical regions where most of the biodiversity is concentrated (Asner et al., 2010; Zwiener et al., 2017).
One of the most species-rich and yet highly degraded tropical domains is the Atlantic Forest (Mittermeier et al., 2011). This highly diverse South-American ecosystem complex formed by multiple physiognomies has approximately 28% left of its original vegetation cover (Rezende et al., 2018). Sadly, it is considered one of the ‘hottest of the hotspots’ (Laurance, 2009) and one of the three most vulnerable to climate change (Béllard et al., 2014). One of its most heterogeneous physiognomies is the Restinga vegetation, a mosaic of distinct coastal physiognomies dominated by herbs, shrubs and trees occurring side by side (Marques et al., 2015), and where peripheral plant communities face more extreme environment conditions than the hinterland forests (Scarano, 2002).
Despite exhibiting some floristic, functional and historical connections to other Atlantic Forest ones, at least 4% of Atlantic Forest plant species are endemic to the Restinga forest physiognomies (Marques et al., 2015). The biodiversity in these ecosystems is under serious threat as they are considered extremely vulnerable to climate change and highly exposed to deforestation and biological invasion (Zamith and Scarano, 2006). As such, species displacement (Pecl et al., 2017) and extinction (Waller et al., 2017), related to climate change, may entail irreversible consequences to the many aspects of biodiversity and ecosystem services. Indeed, services such as sediment retention, protection from sea-level rise and extreme high tide events are key to human well-being and climate change mitigation (Scarano and Ceotto, 2015).
Taxonomic diversity, i.e., the species composition and abundance at a given location and time, can be measured locally (alpha), among locations (beta) and regionally (gamma; Whittaker, 1972). Beta diversity indicates the degree of differentiation among communities and can be partitioned into two components: turnover and nestedness (Baselga, 2010). Disentangling these components allows beta diversity to be scaled up to regional levels (Socolar et al., 2016). The nestedness phenomenon occurs when the biotas of sites with less species are subsets of the biotas at richer sites, while spatial turnover denotes the replacement of some species by others due to environmental sorting and spatial constraints. Disentangling the beta diversity components represents an important tool for understanding the anthropogenic effects on the distribution of taxonomic diversity (Kraft et al., 2011).
Climate change is predicted to alter the environment and, by extension, the spatial distribution of biodiversity and ecosystem functioning. Species may locally adapt or track suitable conditions, however, given spatio-temporal restrictions to dispersal many species are expected to go locally extinct or retract their distribution leading to ecosystem degradation (Carpenter et al., 2001; Colls et al., 2009). Evidence shows that species responses to climate change may lead to biotic homogenization or heterogenization of ecological communities with detrimental effects to biodiversity (Hidasi-Neto et al., 2019; Socolar et al., 2016; Zwiener et al., 2018). Such changes directly affect the delivery of ecosystem services crucial to human well-being (Díaz et al., 2007). A way to assess these changes is by measuring functional diversity (Hooper et al., 2005), which represents the combined expression of functional traits. Functional diversity is not equally affected by all species, as the set of functional traits of each species matters differently to ecosystem processes (Mouchet et al., 2010). Combining different facets of diversity (i.e., taxonomic and functional) may represent an effective approach to estimate the effects of climate change on ecosystem structure and processes. In fact, considering the current land use changes and increasing impacts of climate disturbances in tropical ecosystems, measuring the different biodiversity levels adequately could account as an urgent task in Latin America (see Pearson et al., 2019).
Here we assessed the potential effects of climate change on woody plants of the Restinga vegetation in Brazil. Based on species checklists from local studies we generated ecological niche models and compiled functional traits for 796 woody plants to: i) predict the current and future distribution of taxonomic and functional diversities; ii) estimate the beta diversity between current and future scenarios and compare the relative contribution of turnover and nestedness; and iii) predict the distribution of functional traits indispensable to the delivery of multiple ecosystem services. Ultimately, our results contribute to the discussion of biotic homogenization and heterogenization that affect ecological communities and may jeopardize the conservation of biodiversity and human well-being.
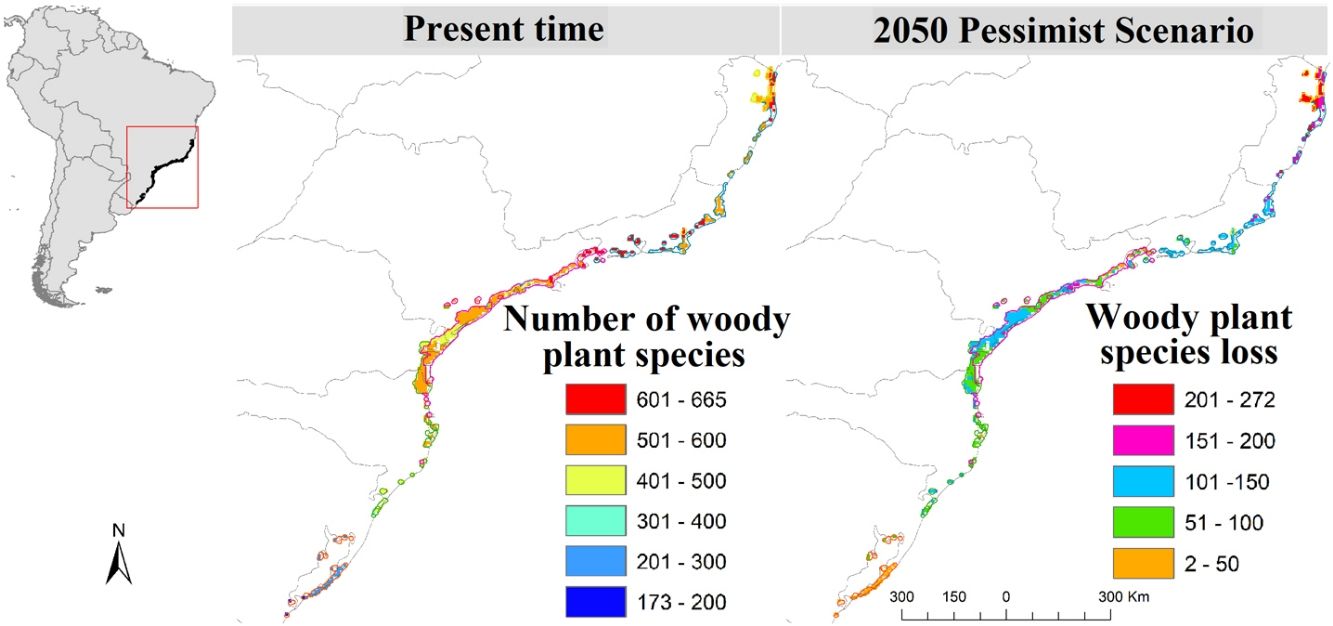
MethodsStudy region and occurrence dataThe study encompasses the forest component of the Restinga vegetation of South and Southeastern Brazil (States of Espírito Santo, Rio de Janeiro, São Paulo, Paraná, Santa Catarina and Rio Grande do Sul; Fig. 1A), a well-defined floristic zone in historical and ecological terms (Marques et al., 2011). This vegetation is part of the Atlantic Forest complex, and include the Edaphic System of First Occupation and the Lowland Dense Rain forest in the Brazilian vegetation classification (IBGE, 1992). The study region was defined by overlapping the area of Edaphic System and Lowland Forest from the IBGE vegetation map (www.ibge.gov.br) and the area of Restinga vegetation from the SOS Mata Atlântica map (www.maps.sosma.org.br). We divided the study region (5 km2 grid resolution) into five ecoregions – eco-0, eco-5, eco-12, eco-16 and eco-18 (Fig. 1) – considering the regionalization proposed by Cantídio and Souza (2019), which was based on a spatially contiguous estimation of floristic dissimilarity and ecosystem variation.
 – (A), current number of species (B), and future projected species loss (C and D). A buffer of 20 km was created around the final ecoregions to fit the shapefiles and the distribution raster resolution as well as to better integrate the total area, especially the isolated and smaller ones, in more detail.")
Study ecoregions eco-0, -5, -12, -16 and -18 plus the merger of the six ecoregions (eco-all) – (A), current number of species (B), and future projected species loss (C and D). A buffer of 20 km was created around the final ecoregions to fit the shapefiles and the distribution raster resolution as well as to better integrate the total area, especially the isolated and smaller ones, in more detail.
In order to create a checklist of woody plant species occurring in the Restinga vegetation, we gathered floristic and phytosociological studies from the literature based on a list previously compiled by Marques et al. (2015). The search resulted in 47 published studies, which were developed in 44 sites and comprised 796 native woody plant species (occurrence data ranged from 10 to 2435 records) of 89 families. Henceforth, the occurrence data of each species was compiled from SpeciesLink (http://splink.cria.org.br/) and GBIF (http://gbif.org/). Synonymies and misspelled names were resolved using the information provided by specialists at Flora do Brasil 2020 (http://floradobrasil.jbrj.gov.br/). See Appendix A for more details about the obtention and preparation of the occurrence data.
Climatic data and ecological niche modelingA total of 19 climatic variables for future climate projections were compiled from the WorldClim database (Hijmans et al., 2005), which are based on the IPCC Fifth Assessment Report. The first six principal component analysis (PCA) axes from current conditions projected to three global climate models (CCSM4, GISS-E2-R and MIROC5) for 2050 optimistic (RCP 2.6) and pessimistic (RCP 8.5) scenarios were chosen as proxy for the climatic variation in the region. These variables and the occurrence data of 796 woody species were used to estimate geographic distributions with ecological niche modeling (ENM) for the present time and for both 2050 scenarios (see details in Supplementary Material, Appendix A). Our models were performed in package ‘dismo’ (Hijmans et al., 2012) in R using the Maxent implementation, and considered all the assumptions stated by Peterson (2001).
Species loss assessmentIn order to calculate the number and percentages of projected species loss, we compared the current distribution of the Restinga woody plant species to the future RCP 2.6 and 8.5 scenarios' presence-absence matrices obtained from niche modeling. To determine the magnitude of distribution, we separated the species into range categories by calculating the quartiles based on the range of the most ubiquitous species (Securidaca diversifolia) and classifying the species in narrow (1st quartile), intermediate (2nd quartile) and wide (3rd and 4th quartiles) distribution. In addition, we determined the pattern of range dynamics (i.e., expansion, retraction and stabilization) every species in each range category presented in both future scenarios. We also calculated the net retraction rate (expansion minus retraction) for each species. We considered a potential local extinction event when the species showed no suitability in the future scenarios (i.e, 100% retraction).
Taxonomic beta diversity partitioningWe partitioned beta diversity into nestedness and turnover components in order to estimate the taxonomic beta diversity – Sørensen total dissimilarity index (βsor) – of each ecoregion by calculating the sum of its components in the current, RCP 2.6 and RCP 8.5 scenarios. Simpson’s dissimilarity index (βsim) was used to represent turnover and nestedness was represented by Sørensen’s beta diversity component of nestedness (βsne). Further on, we took the present time presence–absence matrices to compute the dissimilarity for each focal grid cell between present time and future scenarios considering βsim and βsne components of temporal change, and the sum of both values (i.e., βsor). Both analyses were calculated with the functions ‘beta.multi’ and ‘beta.temp’, respectively, available in the ‘betapart’ package (Baselga and Orme, 2012; R Core Team, 2017).
Plant traits and functional diversityFive functional traits for each species were compiled from the ‘UFPR_Atlantic_Forest_trait’ dataset, complemented with information from the literature and herbaria. The traits used were maximum plant height (Hmax), wood density (WD), leaf area (LA), seed length (SL) and fruit length (FL). These traits were chosen because of their association to key ecological functions and services for these coastal forest ecosystems. The missing trait values were imputed with ‘phylopars’ function in ‘Rphylopars’ package (Goolsby et al., 2017) considering the macroevolutionary parameters under the Brownian Motion model. The mean percentage of imputed trait data was 43%, what is considered reliable (Penone et al., 2014). For this procedure, we obtained a phylogenetic tree of all 796 species (Appendix C) from ‘V.PhyloMaker’ package (Jin and Qian, 2019), which is based on an extended version of the GBOTB megatree (Smith and Brown, 2018). All analyses were performed in R (R Core Team, 2017).
To measure functional diversity, we calculated the community-weighted mean of each trait mentioned above and the three components of functional diversity with the following multidimensional indices: functional richness (FRic), functional evenness (FEve) and functional divergence (FDiv; Villéger et al., 2008). The complementary nature of these facets allows us to fill the functional space of a community with the distributions and abundances of the species (Mouchet et al., 2010). While FRic defines the dimensions of the functional space by its volume, FEve describes how regularly of the species abundances are distributed in the functional space and FDiv, how far high species abundances are from the center of the functional space (Mouchet et al., 2010). All the functional metrics were calculated with the ‘dbFD’ function implemented in the ‘FD’ package (Laliberté and Shipley, 2011) and were performed in R (R Core Team, 2017). ENM’s environmental suitability index was used as a proxy of species abundance (Weber et al., 2017).
AnalysesTwo-way permutational ANOVA was used to compare the averages of the taxonomic beta diversity components (βsim, βsne and βsor), βsim and βsor temporal change and the functional diversity indices (FDiv, FEve, FRic and CWM of all five traits) of the climate scenarios (present, RCP 2.6 and RCP 8.5) for each ecoregion, using the ‘aovp’ function in the ‘lmPerm’ package (Wheeler and Torchiano, 2016). The datasets with significant variations were submitted to the Fisher's Least Significant Difference test (LSD) employing Bonferroni's correction with p < 0.05, using the ‘LSD.test’ function in the ‘agricolae’ package (Mendiburu, 2017; Table S1–5) performed in R (R Core Team, 2017).
ResultsSpecies loss assessmentOverall, our models suggested expressive losses in woody-plant species of the Restinga vegetation for future climatic scenarios (Fig. 1). The RCP 8.5 presented more than three times higher species loss rate than RCP 2.6 (0.75% and 0.25%, respectively). The highest individual ecoregion proportional rate of projected species loss occurred in eco-5, the northernmost ecoregion (14% in RCP 2.6 and 19% in RCP 8.5), whilst the lowest was in eco-16, located in the central region of the study area (1% in RCP 2.6 and 1.6% in RCP 8.5; Fig. 1). Regarding the range dynamics, the species in the optimistic scenario exhibited 10.0%, 80.5% and 9.7% of expansion, retraction and stabilization, respectively (Table S6). The pessimistic scenario showed a more contrasting pattern than the previous scenario as expansion and retraction presented even higher rates, reaching 11.3% and 82.7%, respectively, although stability was lower, representing 6.2 % of species only (Table S6). Furthermore, the optimistic scenario had not only a net retraction rate 1% lower than the pessimistic, but also a 3% higher stability rate. Comparing the patterns of range distribution with present, 2050’s RCP 2.6 and RCP 8.5 showed that narrow distributions decrease (80.65%, 80.60% and 80.50%, respectively) whilst wide (6.03%, 6.04 and 6.07%, respectively) and intermediate distributions (13.31%, 13.35% and 13.41%, respectively) increase.
Taxonomic beta diversity partitioningAll beta diversity components significantly changed from the current scenario to the future scenarios (ANOVA, Table S2). In the whole area (eco-all) and all individual ecoregions, βsim was significantly higher (p < 0.05) than βsne within each scenario, except for eco-5, where βsne was higher than βsim (Table S1). Additionally, in all regions, βsor increased in the future scenarios (Fig. 2; Table S2). For all ecoregions, βsor was higher in RCP 8.5 than in RCP 2.6 and present scenarios. All the individual beta diversity measures (βsim, βsne and βsor) were higher in RCP 2.6 and RCP 8.5 than in the present scenario, except in eco-0, where the present βsim was indeed higher than in future scenarios (Table S2). Moreover, RCP 8.5 showed even higher indices than RCP 2.6, except for the βsim of eco-5 and eco-12, where no significant difference was found.

In the temporal pairwise comparison among scenarios, βsim and βsne of the present–RCP 2.6 pair were significantly higher than the present–RCP 8.5 pair, except for βsim in eco-18 and βsne in eco-0, where there were no differences detected with ANOVA (Fig. S1; Table S3).
Functional traits and diversity distributionComparing the present time to future scenarios (RCP 2.6; RCP 8.5), the CWM for all five traits changed, in most ecoregions and for the whole study area (Fig. 3; Table S4). In addition, all five ecoregions did not show the same tendencies for changes in future scenarios, especially eco-0 (located at the southern limit of the study area), and eco-5 and eco-12 (the northernmost ecoregions; Fig. 3). In general, there was a decrease in maximum height (Hmax), except for the opposite result in eco-0, (Fig. 3A; Table 4), and an increase in stem wood density (SWD), seed length (SL) and fruit length (FL) (Figs. 3C, 3D and 3E, respectively; Table S4). Leaf area (LA) did not exhibit change for the whole area (eco-all), but eco-5 and eco-12 had increased values, whilst eco-16 and eco-18, decreased.
 boxplots of five functional traits in five ecoregions (eco-0, eco-5, eco-12, eco-16 and eco-18) and in the whole area (eco-all) at the present and in future scenarios.")
Seemingly to the CWMs, the values within each functional diversity index showed a congruent pattern of variation in future scenarios (Fig. 4). Functional divergence (FDiv; Fig. 4A) and functional richness (FRic; Fig. 4C) decreased, whilst functional evenness (FEve; Fig. 4B) increased. The only exception was FDiv in eco-0, which increased in the pessimistic future scenario (Fig. 4A; Table S5).
Discussion, FEve (B) and FRic (C)) in five ecoregions (eco-0, -5, -12, -16 and -18) and in the whole area (eco-all) at the present and in future scenarios.")
In general, we found that climate change has the potential to critically alter the woody plant biodiversity in the Restinga vegetation by 2050. The results point to a potential taxonomic heterogenization and functional homogenization, which indicate the first stages of a sequential process of long-term biodiversity loss and biotic homogenization. The gauged increase of taxonomic beta diversity in pessimistic future scenarios accompanied by the predicted loss of species suggests subtractive taxonomic heterogenization, where the loss of few highly ubiquitous species boosts beta diversity (Socolar et al., 2016). In addition, the higher turnover in relation to nestedness indicates the replacement of some ubiquitous species by non-ubiquitous ones despite the observed overall richness reduction. The combination of higher beta diversity values and species loss supports the heterogenization hypothesis, which states that an increase in beta diversity corresponds to a decrease in the mean of distribution range sizes either through the incursion of micro-endemic species (e.g., non-ubiquitous species) into the study area or through the net contraction of species ranges (Ochoa-Ochoa et al., 2012). Nevertheless, the decrease in the number of narrow-ranged species may be a sign that some non-ubiquitous and/or endemic species are predicted to be lost, what may contribute to a process of taxonomic homogenization in the future. Regarding the functional dimension, however, we observed an ongoing process of functional homogenization whereby the mean of key traits changes and clings towards one direction. Future environmental filters will potentially constrain species functional diversity to more acclimated trait values, narrowing the functional space. The taxonomic and functional outcomes forecast by our results are alarming, considering that human impacts extend beyond the climatic factors, therefore the estimated detrimental impacts on biodiversity are likely conservative and may act in synergy with other anthropogenic impacts, potencially leading to an even worse scenario of expressive loss of biodiversity and functions (Hidasi-Neto et al., 2019; Prieto-Torres et al., 2020).
Climate change may impose particular ecological filters that constrain the occurrence of trait diversity. At a single trophic level, disturbance, if in low intensity and frequency, may increase species richness (McCabe and Gotelli, 2000), on the other hand, it may lead to species loss, as only species at a certain range of the functional traits are allowed to establish and perpetuate. As our models predicted species loss in local, regional and continental scales, climate change in the Restinga vegetation may represent an intense and growing disturbance phenomenon. The regional scale (study area), representing gamma diversity, may witness the loss of two species in the optimistic scenario and six species in the pessimistic, all with narrow distribution. The models indicated that the species Unonopsis aurantiaca may disappear in both contrasting future scenarios of the study area where it is endemic, what endorses the concerning result of our models. In the more localized scale (ecoregions), species loss reached striking levels, making up to 134 of projected lost species by eco-5 in the pessimistic scenario, which represents 19% of its current estimated woody plant species number. Moreover, the unsettling levels of species loss and displacement will potentially hinder ecosystem processes in the Restinga vegetation and, by extension, the provision of ecosystem services crucial to human well-being.
The general projected increase of wood density and decrease of maximum height (and leaf area in a couple of ecoregions) suggest that these ecosystems might face dryer and warmer environmental conditions in 2050, as woody plant species are driven towards a more conservative ecological strategy, although further studies are necessary to explore this matter. The above-mentioned homogenization of functional diversity is attributed to the decrease of two out of the three aspects of functional diversity measures, FRic and FDiv. This outcome indicates a narrower functional space with declining species abundances in more extreme trait values. Although FEve showed, instead, an overall increase in future projections, this result is rather expected, considering the significant loss of projected species richness and environmental suitability (proxy of abundance). Moreover, an increase in FEve, coupled with a decrease in FRic, has been observed in the latitudinal gradient of taxonomic diversity (Schumm et al., 2019) and after mass extinction events (Edie et al., 2018). In these cases, despite major loss of species, the majority of, if not all, functional groups will persist, even with very few species and lower abundances, so the distribution of the species' abundances tends to be more uniform.
The Restinga is one of the most vulnerable marginal ecosystems of the Atlantic Forest (Scarano, 2009). Our models have indicated drastic effects of climate change on the diversity and functionality of these systems in a near future. Nevertheless, other current menaces such as deforestation, biological invasion and land-use change (Zamith and Scarano, 2006) are not expected to decrease nor cease in the near future, and they can act in synergy with climate change. The future conservation of the Restinga can be more uncertain than the outcome pointed out in this work, as we have addressed only one threat. It is important to highlight that this vegetation is typically composed by species with high phenotypic plasticity (Zamith and Scarano, 2006), which could affect species distribution. Another relevant aspect is that part of these Restinga plant communities is also structured by the facilitation process, especially in non-forest areas at initial stages of succession (Dalotto et al., 2018). Thus, incorporating the information on the species phenotypic plasticity, biological interactions and even considering sea-level rise in future models could promote higher refinement to predictions of the effects of climate change on the Restinga vegetation.
The used method for estimating abundance from environmental suitability is a practical approach to capture changes in species distributions and their functionalities. Despite the evidence of significant correlation between the suitability index and abundance, several factors may contribute to some degree of uncertainty in the results. For instance, (i) ENMs may inaccurately estimate species-environment correlation due to limited environmental representability within accessible areas; (ii) local factors and biological interactions not anticipated by the models may limit the occurrence of species at a given site; and (iii) correlative models assume niche stability, when in fact it is dynamic. In spite of the methodological limitations and associated uncertainty, ENM endorses conjecturing over large spatial and temporal scales, and allows exploring macroecological community assembly processes (Distler et al., 2015).
Understanding the relationship between the distribution of the taxonomic and functional facets of biodiversity across spatio-temporal scales and different scenarios is crucial to guide conservation strategies that deal with the uncertainty of the future. The predicted higher future turnover associated to decreasing species richness should be considered when planning protected areas in the Restinga vegetation, otherwise it would risk losing species and functions (Tuomisto et al., 2003). Moreover, the conservation of the Restinga is also vulnerable to law subterfuges (Marques et al., 2015). Tackling this and many other issues to attain healthier ecosystems is paramount not only for the intrinsic value and maintenance of the Atlantic Forest biodiversity, but also to preserve ecosystem services essential to the prevalence of the Brazilian coastal natural wonders as well as the traditional peoples and communities that rely on its integrity.
Conflicts of interestNone declared.
We are grateful to Mario Garbin, Fernanda Brum and two anonymous referees for improving the manuscript with important suggestions. This work was supported by the Coordenação de Aperfeiçoamento de Pessoal de Nível Superior - Brasil (CAPES) (MEC/CAPES Finance Code 001) and Conselho Nacional de Desenvolvimento Científico e Tecnológico (CNPq) (Universal Grant 401613/2016-0; PQ Grant 303356/2019-7 to MCMM).
The following is Supplementary data to this article:

