


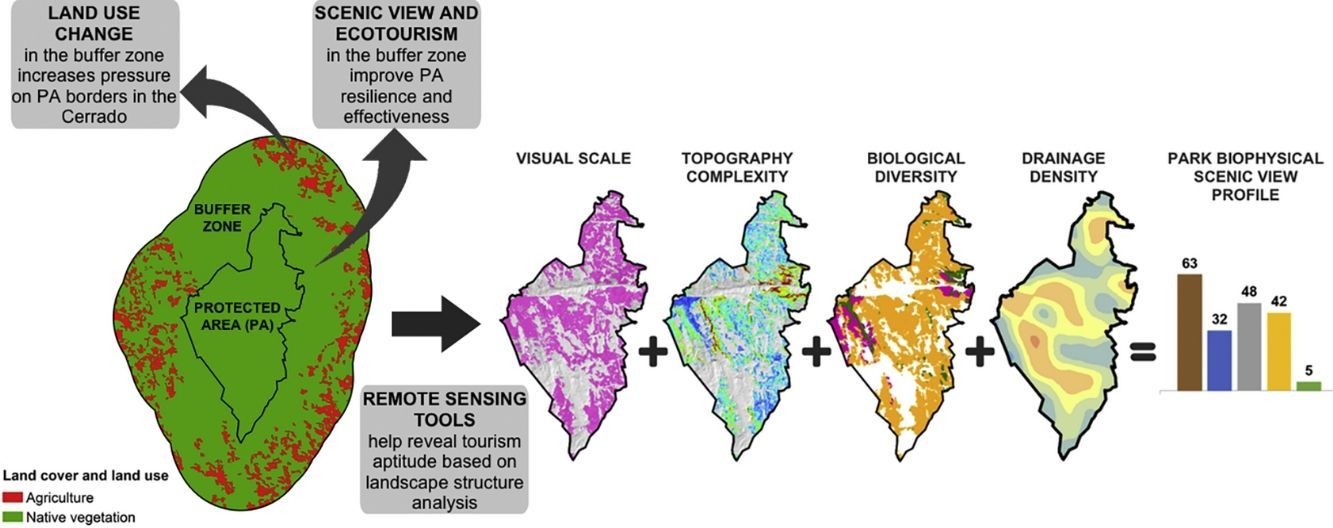
Buffer zones around protected areas (PA) can minimize negative human impacts and stimulate the sustainable use of natural resources. To fulfill these goals, it is important to ensure the participation of local communities on resources management and to support local economies. Sustainable tourism activities have the potential to reconcile the apparent conflict between protection of nature and socioeconomic benefits, but it has not been fully developed in Brazilian PA network. The objective of this study is to address opportunities to expand and complement the touristic attractions in areas surrounding eight Cerrado National Parks opened for visitation, by taking advantage of their scenic views. The analysis was based on remote sensing derived landscape biophysical attributes, including three key categories related to visual and ecological qualities and six indicators. Results allowed the identification of profiles for the selected parks, relating their biophysical characteristics to their main touristic potential. Strong hilly topographies, in general, were associated with wide visual scale and high complexity while flat topographies favor water related recreational services. Although focused on National Parks located in the Brazilian Cerrado, the study area is representative of tropical ecosystems with relevant species richness and high land conversion pressure.
South America contains one of the most comprehensive protected area (PA) networks in the world, with around 25% of its terrestrial area under protection (Deguignet et al., 2014). There is a trend, however, of increasing degradation inside and around PAs all over South and Central America (Leisher et al., 2013) that can lead to the isolation of those areas, impairing their capacity to conserve biodiversity. One of the strategies to minimize the negative impacts of land conversion is to create buffer zones and ecological corridors, that increase PAs connectivity and resilience (Hansen and DeFries, 2007; Lopoukhine et al., 2012). The buffer zone concept was initially conceived to restrict human activities in PAs borders and reduce external disturbances. Later, it incorporated concerns with the human groups affected by the conservation measures (Wells and Brandon, 1993). Nowadays, support from local people is considered a critical aspect to ensure long term conservation goals (Wells and Brandon, 1993). Nevertheless, it remains a challenge to promote the inclusion of different stakeholders in the decision making processes and to provide alternatives to sustain the livelihood of PA neighboring communities (Vivacqua and Vieira, 2005).
One of the economic activities that can be developed in the buffer zone, in accordance with nature protection, is ecotourism, derived from cultural ecosystem services (CES). Beyond the traditional goal of biodiversity conservation, PAs provide many ecosystem services (ES), including CES (Lopoukhine et al., 2012). CES are the intangible benefits that arises from the interaction between society and the environment (MEA, 2005). Cultural and social aspects are often neglected because immaterial and intangible dimensions are considered difficult to characterize and measure, since high levels of subjectivity are involved in their analyses (Chan et al., 2012). Even though the importance of CES to societies have increased as the economies grow (Guo et al., 2010), there are few publications about this theme in Latin America (Hernández-Morcillo et al., 2013).
Scenic view is a type of CES included in the group of aesthetic services (MEA, 2005). Scenic potential or scenic quality expresses the aptitude of the place to provide quality experiences in terms of visual appreciation of the natural scenery to the visitors. These experiences come from the interaction between the observer and the landscape features. In this case, landscape refers to the perceived landscape, a space determined by the impression of the observer that involves all human senses, especially the vision (Alonso et al., 2004). Two sets of analytical variables are considered: the objective landscape characteristics and the subjective observer perceptions (Daniel, 2001). Objective approaches focus on environmental features and aesthetic theories while subjective approaches are based on direct or indirect measures of opinion to qualify scenic beauty, according to preferences of individuals or groups. Most of the studies combine elements from these two approaches (Daniel, 2001). There is also a tendency to join aesthetics with ecology, defining the scenic potential based on ecological integrity criteria (Daniel, 2001). This perspective enriches the multifunctionality of natural environments, in agreement with the Brazilian policy to create National Parks intended to protect both biodiversity and scenic beauty (as defined by the Federal Law no. 9985 of July 18, 2000).
Scenic view and other CES are also important sources of revenues. In Brazil, federal PAs received around 8 million visitors in 2015, contributing with the national economy with estimated $1.2 billion U.S. dollars (Souza, 2016). For every one U.S. dollar that the Brazilian government invested, about seven U.S. dollars returned to the economy, supporting 43,602 jobs. The numbers indicate that the benefits related to ecotourism exceed the geographical limits of PAs, contributing to improve local economies and create direct and indirect jobs in their neighboring areas (Souza, 2016). Tourism activities, however, are unevenly distributed among PAs.
The Brazilian savanna (Cerrado) is a biodiversity hotspot under threat from the rapid land cover change process, with as little as 3% of its area within strictly PAs (Françoso et al., 2015). The National Parks located within the Cerrado received approximately 0.6 million visitors in 2015 (Souza, 2016), which is only 7.5% of the total visitors received by all Brazilian federal PAs in the same year. Diverse factors, such as multiple attractions in the region, reputation, recreation facilities and population density have been demonstrated to affect the number of visitors in a park (Castro et al., 2015). Yet, the imbalance in the number of tourists among parks needs to be further investigated, as well as the unexplored potentials of development of each park (Souza, 2016).
This study aimed to identify opportunities to expand and complement the touristic attractions in areas surrounding eight Cerrado National Parks opened for visitation (ICMBIO, 2017), by exploring landscape biophysical aspects of their scenic view. National Parks correspond to areas with low anthropogenic impacts (Françoso et al., 2015), therefore, expected to provide increased levels of ecosystem services. Projects to improve ecotourism in the surroundings of the parks can create opportunities for the engagement of local population in sustainable activities.
The selected National Parks were: Brasilia, Cavernas do Peruaçu, Emas, Chapada dos Veadeiros, Chapada dos Guimarães, Grande Sertão Veredas, Serra da Canastra and Serra do Cipó. For each park, we obtained relevant information about their panoramic view based on objective landscape biophysical attributes. Using key categories of visual and ecological qualities suggested by Fry et al. (2009), we selected indicators related to visual scale, complexity and imageability.
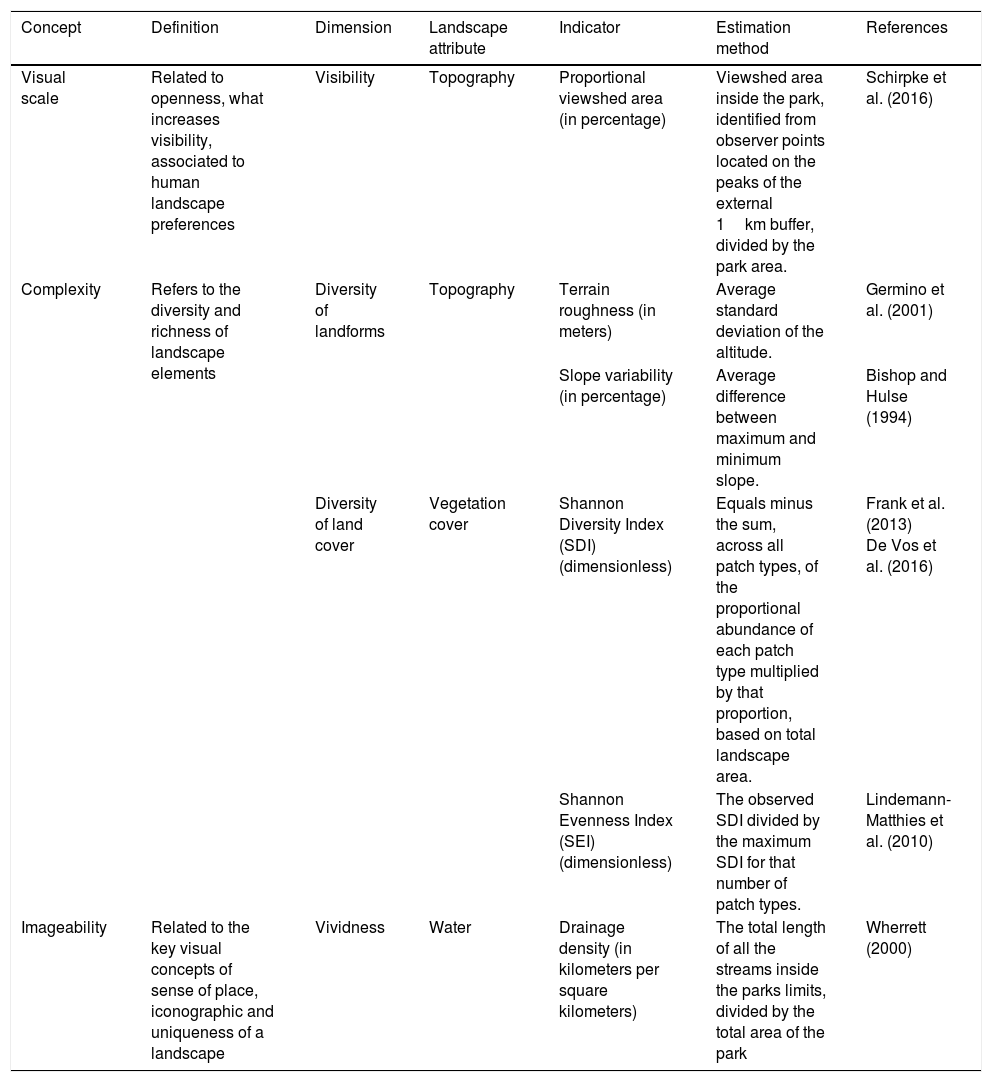
Material and methodsThe investigation was based on the spatial analysis of remote sensing data that were processed with the support of ArcGIS 10.4.1 geographical information system software, Patch Analyst 5.2 (Rempel et al., 2012) extension available for the ArcGIS software to estimate landscape metrics and Envi 5.0 image processing software. The analysis was centered in landscape structural characteristics, a common feature that integrates visual and ecological aspects of the landscape, using three concepts proposed by Fry et al. (2009) and six indicators (Table 1).
Concepts (visual scale, complexity and imageability) and indicators (viewshed area, terrain roughness, slope variability, Shannon Diversity Index, Shannon Evenness Index and drainage density) considered in the integration of visual and ecological aspects for landscape metrics analysis. The framework was proposed by Fry et al. (2009).
| Concept | Definition | Dimension | Landscape attribute | Indicator | Estimation method | References |
|---|---|---|---|---|---|---|
| Visual scale | Related to openness, what increases visibility, associated to human landscape preferences | Visibility | Topography | Proportional viewshed area (in percentage) | Viewshed area inside the park, identified from observer points located on the peaks of the external 1km buffer, divided by the park area. | Schirpke et al. (2016) |
| Complexity | Refers to the diversity and richness of landscape elements | Diversity of landforms | Topography | Terrain roughness (in meters) | Average standard deviation of the altitude. | Germino et al. (2001) |
| Slope variability (in percentage) | Average difference between maximum and minimum slope. | Bishop and Hulse (1994) | ||||
| Diversity of land cover | Vegetation cover | Shannon Diversity Index (SDI) (dimensionless) | Equals minus the sum, across all patch types, of the proportional abundance of each patch type multiplied by that proportion, based on total landscape area. | Frank et al. (2013) De Vos et al. (2016) | ||
| Shannon Evenness Index (SEI) (dimensionless) | The observed SDI divided by the maximum SDI for that number of patch types. | Lindemann-Matthies et al. (2010) | ||||
| Imageability | Related to the key visual concepts of sense of place, iconographic and uniqueness of a landscape | Vividness | Water | Drainage density (in kilometers per square kilometers) | The total length of all the streams inside the parks limits, divided by the total area of the park | Wherrett (2000) |
Visual scale is a measure of openness and includes characteristics such as area and depth of visibility, which are related to the landscape preferences (Schirpke et al., 2016). In this study, visual scale metrics were adopted to identify wider panoramic views of the parks accessible to observers located outside the park. Visible areas can be obtained from viewshed analysis. Viewshed operations identify cells in raster-based surfaces potentially visible from an observing point. Since there was no specific point of interest, the goal was to create a map of best visibility along the borders of the parks.
Creating the viewshed for every pixel is time-consuming (Rana, 2003) and produces many overlapping fields of view, since neighboring pixels tend to have similar visibility (Kim et al., 2004). Then, a key issue that arises is how to choose the observer points in order to minimize the processing effort and maximize the field of view (Rana, 2003). Previous studies about strategies to select observer points demonstrated that topographic position is a key predictor of visibility (Kim et al., 2004; Rana, 2003). Most points of high visibility are located on peaks and ridges, because those features tend to be in a geographic position above the nearby points (relative elevation) (Kim et al., 2004). Kim et al. (2004) found little difference in the visibility when pits or passes were added to peaks as candidate observer points.
To select the observer points, the 30-m digital elevation model (DEM) produced by the NASA's Shuttle Radar Topographic Mission (SRTM) (Farr and Kobrick, 2000) was classified in ENVI software, using a 7×7 kernel size. The classification identified six morphometric classes: peak, ridge, pass, plane, channel, pit and unclassified. Ridges occupied a large proportion of the topographic features, resulting in an excessive increase of candidate observers with highly redundant viewshed areas, as pointed out by Kim et al. (2004). Therefore, only the peaks were selected as observer points and their polygonal features were converted into points (centroids of each polygon). Only the points within the 1km buffer area outside the borders of the parks were considered.
The number of observing points varied among the parks, according to the number of peaks identified. Using the selected observer points, we carried out the viewshed analysis on the ArcGIS, setting the observer eye level at 1.60m above the ground and the offset external radius as 10km The viewshed area into the park was calculated and expressed as percentage of the total area of each park.
Other biophysical features within the scenic view were also investigated. Diversity of vegetation cover and topography complexity have been associated with viewers’ preferences (De Vos et al., 2016; Germino et al., 2001). The SRTM DEM data were used to obtain the surface roughness and slope variability, both indicators of topography complexity. Surface roughness in the viewshed area, defined as the average standard deviation of elevation for all cells within the visible area, was calculated on ArcGIS. Slope (in percentage) was calculated using ENVI and slope variability inside the viewshed area was estimated subtracting the maximum and minimum slope values in a 100×100 cell neighborhood (Ruszkiczay-Rüdiger et al., 2009), using ArcGIS.
The analysis of biological diversity within the viewshed area considered differences in the Cerrado vegetation formations, as classified by Pinto et al. (2009). Three plant physiognomies were distinguished: grasslands, savannas and forests. Since the Brasília National Park extension was not included in the study conducted by Pinto et al. (2009), we employed the land use and land cover map produced by MMA (2015) only in the portion of park that was missing from the previous classification. Diversity was calculated through Shannon Diversity Index (SDI) and Shannon Evenness Index (SEI) functions available in the Patch Analyst extension for ArcGIS. Only natural vegetation cover classes that intersected the viewshed area were considered.
Another aspect evaluated was the presence of surface water inside the park, which is considered an important attractive feature for tourism, recreation and scenic view (Wherrett, 2000). Presence of surface water was accounted using the drainage density parameter, which is the total length of the drainage system inside the park by the total area of the park. A drainage model was created for an area that included the park and a 10km surrounding zone. We used the Japan Aerospace Exploration Agency (JAXA) Advanced Land Observing Satellite (ALOS) 30-m Digital Surface Model (DSM) (Tadono et al., 2014), that was processed by the Hydrology ArcGIS Tools. Higher flow cells present higher cell values, so that the resulting drainage system only considered streams with more than 500 pixels. A visual model of drainage kernel density was also created with ArcGIS, using a standard search radius of 3.5m (minimum default search radius among the study areas), resulting in a 30m cell size raster data. We symbolized kernel density matrix with natural breaks (jenks) to obtain seven classes of drainage density, varying from very low to very high.
Results were normalized to 0–100 scale for comparison, using the natural data variability for each indicator. We also performed a cluster hierarchical analysis including as variables the viewshed proportional area, average terrain roughness, average slope variability, SDI and drainage density. The cluster analysis was carried out in RStudio Desktop Version 1.0.136 (RStudio Team, 2016), using the libraries vegan and labdsv, to identify similarities among the parks. RStudio is an integrated development environment (IDE) for R statistical package. To run the cluster operations, data were previously standardized, using χ2 method, to create the Euclidean distance matrix of dissimilarities. Four different clustering methods were tested and Ward's minimum variance method resulting dendogram was selected (cophenitic correlation=0.65; cutoff=0.3).
ResultsThe viewshed area ranged from 10.9% (Grande Sertão Veredas) to 47.6% (Serra do Cipó), distributed in discontinuous patches along the borders, reaching the core areas of the parks in the smallest ones, Chapada dos Guimarães and Serra do Cipó (see supplementary data, Fig. S1). Topography complexity indicators (slope variability and especially roughness) exhibited a wide range of values and high standard deviations. Serra da Canastra presented the highest average roughness (11m±8), while the lowest roughness was observed in Emas and Grande Sertão Veredas (1m±1). Slope variability was higher in Serra do Cipó (142%±69), Serra da Canastra (140%±50) and Chapada dos Guimarães (137%±69), and lower in Grande Sertão Veredas (23%±13) and Emas (24%±11). The large variability suggests that the average value is not a good indicator since it may underrepresent much of the natural complexity shown in maps (Fig. 1).
 inside the viewsheds of the selected National Parks: A. Brasília National Park; B. Cavernas do Peruaçu National Park; C. Chapada dos Guimarães National Park; D. Chapada dos Veadeiros National Park; E. Emas National Park; F. Grande Sertão Veredas National Park; G. Serra da Canastra National Park; H. Serra do Cipó National Park.")
Terrain roughness (units in meters) inside the viewsheds of the selected National Parks: A. Brasília National Park; B. Cavernas do Peruaçu National Park; C. Chapada dos Guimarães National Park; D. Chapada dos Veadeiros National Park; E. Emas National Park; F. Grande Sertão Veredas National Park; G. Serra da Canastra National Park; H. Serra do Cipó National Park.
The diversity of vegetation types in the combined viewshed comprises a mosaic of grasslands (17.5%), savannas (68.5%), and forests (14.0%) (see supplementary data, Fig. S2). These percentages are similar to those estimated for the remaining natural vegetation in the entire Cerrado (Pinto et al., 2009; Sano et al., 2010). The viewsheds of Chapada dos Veadeiros and Grande Sertão Veredas were predominantly composed of savannas (87% and 86%, respectively), and there was a higher proportion of grasslands in the Emas viewshed (50%). Chapada dos Guimarães (SDI=1.02; SEI=0.93), Emas (SDI=0.94; SEI=0.86) and Brasília (SDI=0.93; SEI=0.84) presented the highest biodiversity indexes within the viewshed. Conversely, the lowest indexes were observed in Chapada dos Veadeiros (SDI=0.44; SEI=0.40), which is covered predominantly by the savanna formations.
Drainage density results show an opposite tendency compared to the topography, since parks with flat topography tend to accumulate more water in the soil surface (see supplementary data, Fig. S3). Serra da Canastra exhibited the lowest drainage density (0.85kmkm−2). Emas and Grande Sertão Veredas presented the highest drainage densities (1.20kmkm−2 and 1.06kmkm−2, respectively). Overall, most of the parks showed similar values of drainage density.
Cluster analysis revealed four groups of parks that are consistent with their topography variability (Fig. 2). The groups were distributed in a gradient from strong wavy (Serra da Canastra), wavy (Chapada dos Guimarães, Serra do Cipó and Chapada dos Veadeiros), smooth wavy (Brasília and Cavernas do Peruaçu) and smooth (Emas and Grande Sertão Veredas). Serra da Canastra is dissociated from other wavy parks in a group because its average terrain roughness (11m) is almost twice higher than the value obtained for the parks with the second highest roughness, Serra do Cipó and Chapada dos Veadeiros (6m). The results revealed varying biophysical profiles associated to each park (Fig. 3 and supplementary data Figs. S4 and S5) and different potentials to attract visitors.

 and drainage density. Results were normalized to 0–100 scaling factor for comparison purposes. Figure includes information relative to the area of each park (in km2) and number of visitors reported for 2015, obtained from Souza (2016).")
Biophysical profiles of the selected National Parks from the Brazilian Cerrado in terms of five visual and ecological indicators: viewshed area, terrain roughness, slope variability, Shannon Evenness Index (SEI) and drainage density. Results were normalized to 0–100 scaling factor for comparison purposes. Figure includes information relative to the area of each park (in km2) and number of visitors reported for 2015, obtained from Souza (2016).
Strong wavy topographies, in general, were associated with wider visual scale, and higher landscape complexity. This pattern was observed between parks as well as within the regions of the same park (Figs. 1 and 3). Serra da Canastra, however, presented a relatively small viewshed area, but high slope variability and high terrain roughness (Fig. 3). It is an extensive park with strong wavy topography, and the largest absolute viewshed area (406km2). Despite that, when compared with the total area of the park, the viewshed area was not so wide. For larger and more circular or regularly shaped parks, there is a limitation related to the object of the study itself, since our analyses focused on scenic potential around the borders of the park, within a viewing distance of 10km radius. The main purpose of this research was to investigate how to reveal the touristic potential that can benefit the surrounding areas. Parks with large areas have large inner core areas that fall outside the range of visibility. The panoramic views from inside the park, including the areas opened for visitors, require unavailable information about the existing trails and should be addressed in future studies, once the data become available. Likewise, data about the presence of waterfalls and the location of natural attractions were not accessible to be included in this research.
The spatially explicit approach is critical to identify differences in biophysical patterns within each park. The generated maps indicate regions around the parks where visibility of the natural scenery is wider, what may turn out to offer complementary tourist attractions in the region, contributing to increase the tourist flow (Castro et al., 2015; Souza, 2016). Brasília is an example where increased topography variability occurs in specific areas located in the recently created extension of the park, that occurred in 2006 and increased the total area from 300 to 423km2. The extension includes rough terrain and it is unsuitable for agriculture (Braga Braga Netto et al., 2005). However, it adds ecological and cultural values to the park, including low impacted areas, habitats with altitudinal gradients that were underrepresented before, waterfalls and Brasília's highest elevation point, with a wide viewshed (Braga Braga Netto et al., 2005).
Most importantly, the evaluated ecosystem features allowed the creation of profiles for each park, with relevant biophysical characteristics and different aptitudes for tourism. Parks with strong wavy topography, in general, have higher potential to offer scenic experiences from the neighboring areas to the tourists. Otherwise, in parks with smooth relief, the natural beauty is mostly accessible from inside the park. This is the case of the Cavernas do Peruaçu National Park, where the most attractive landscape features are the speleological complexes within the park. Emas National Park main attractions are also inside the park, comprising water recreational activities, the phenomenon of the bioluminescence of termite nests and wild animals watching, facilitated by the flat reliefs and the dominance of grasslands. Overall, parks with low scores of topographic complexity exhibited greater aptitude for aquatic recreational activities, thanks to the high drainage densities. However, the presence of waterfalls, that are also natural attractions, may be reduced in more plane reliefs. This information would help park managers design appropriate strategies to promote sustainable touristic activities.
From the point of view of public preference, considering the number of visitors as a proxy, Brasilia National Park stands out from the other parks. According to Souza (2016), this park received 294,682 visitors in 2015 (∼807 people per day). Brasília National Park is located in a large urban area, with an estimated population of almost 3 million inhabitants (IBGE, 2016), and contains natural water pools, considered the main attraction of the park. Cavernas do Peruaçu presented similar biophysical features as the ones found in the Brasília National Park, but registered only 2,938 visitors in the same period. The park is 238km away from Montes Claros, a city in the Minas Gerais State that has an estimated population of ∼400,000 inhabitants (IBGE, 2016). The comparison between the number of visitors in those two parks shows that factors other than natural features, such as distance to large cities and airports, logistics, promotion and marketing of the park and subjective perception, have decisive influence in visitors preferences (Castro et al., 2015; De Vos et al., 2016; Souza, 2016). These findings are coherent with the idea that natural biotic and abiotic factors of ecosystems correspond to the supply side of ecosystem services, while associated infrastructure and socioeconomic factors interfere in the demand (De Vos et al., 2016).
The number of visitors, however, is not a measure of the social value the park holds in its neighboring areas. In Brasilia National Park, for example, there are a number of conflicts related to land use and environmental degradation by urban expansion (Tavares and Nakagomi, 2016). Challenges related to the management of the Brazilian network of PAs are complex and involve distribution of revenues and governance issues (Vivacqua and Vieira, 2005; Wells and Brandon, 1993).
The indicators and methods presented here can complement the analyses based on socioeconomic tourism-related aspects (Souza, 2016) with spatially explicit characteristics of the natural environment (De Vos et al., 2016). Although CES research often includes agricultural and built landscapes (Dramstad et al., 2006; Schirpke et al., 2016), the analysis targeting PAs should enhance the interaction between cultural and ecological values, as pointed out by Fry et al. (2009) and Gobster et al. (2007). Thus, the aesthetic and recreational services can strengthen synergies between social, ecological and economic dimensions.
ConclusionsIn this study, we were able to characterize eight National Parks located in the Cerrado, in terms of biophysical properties and tourism opportunities. Strong wavy topographies, in general, were associated with wider viewshed and higher landscape complexity. Smooth topographies favor water-related recreational services. The analysis of the number of visitors reported for each park indicates the existence of other aspects, not associated to the ecosystem features, which influence the demand of CES.
The proposed methods are useful to reveal important biophysical characteristics and map the natural potential supply of scenic view. Although this study focused only on National Parks located in the Brazilian Cerrado biome, the approach we developed can be extended to other tropical areas dominated by species-rich ecosystems, under high pressures of land conversion.
The relationship between park visitation and revenues from this activity have been long investigated in the studies involving tourism and recreation. However, only recently recreational and touristic aspects have been integrated in the ecosystem service framework (Willis, 2015). To our knowledge, this study is one of the pioneer researches about scenic view applying the ecosystem services framework in Brazil, contributing to reduce the research gap on CES in South America.
Conflicts of interestThe authors declare no conflict of interest.
AcknowledgementsThis work was supported by the Coordenação de Aperfeiçoamento de Pessoal de Nível Superior (CAPES), Brasília, DF, Brazil. We thank the two anonymous reviewers for their comments and contributions to improve this manuscript.
The following are the supplementary data to this article:

