
This study explores how climate change could potentially drive shifts in the geographic range of the Cerrado endemic snake Phalotris lativittatus. By using three ecological niche modeling methods, I found that P. lativittatus is more likely to occur in the extent of its known geographic distribution (in Southeastern Brazil), but new distribution areas also include semideciduous forest southwestward from current occurrence points, as well as areas in the Cerrado and semideciduous forest northeastward of the current range. Niche models suggest that P. lativittatus would consistently reduce its total extent of occurrence through time. By 2050, the climatically suitable area for P. lativittatus is expected to be reduced by 65% to 70%, whereas the remaining range would reach only 10% to 20% of the current prediction by 2080. These predicted range contractions are associated with a southeastward range shift for predictions to 2050, while most of the predicted area to 2080 encompasses the same as that of 2050.
Ecological niche modeling (ENM; sensuPeterson & Soberón 2012) is used to estimate the potential distributional areas of species across the environmental space. Ecologists have also been using ENM to predict population densities based on the level of environmental suitability generated by the models (Torres et al. 2012). Essentially, these methods generate the extent of occurrence of a species by means of the association of general climatic information (temperature, precipitation, and their variations) for each point-locality record (Elith & Burgman 2002). Although the modeled geographic distribution should be considered with caution, due to methodological limitations (see Graham & Hijmans 2006), ENM methods can be useful tools for a wide range of applications in conservation biology, including predictions of new occurrence areas for rare and/or threatened species (Giovanelli et al 2008; Marini et al. 2010) and the establishment of conservation priorities under future scenarios of climate change (Loyola et al. 2013).
The Cerrado is a tropical savanna with an original extent of approximately 2 million km2 (MMA & IBAMA 2011) and is listed among the five biodiversity hotspots (Mittermeier et al. 2004) in South America. The biodiversity of the Cerrado has been severely threatened by human occupation, which reduced its original extension to 51.16% (MMA & IBAMA 2011). Despite the continuous degradation, ecological studies in the Cerrado provide important background for efficient conservation plans, which also include recently published ENM studies (e.g., Faleiro & Loyola 2013). Other studies have used ENM to predict species distribution under future scenarios of climate change in the Cerrado, but they are relatively rare when compared to other ecological approaches, although there has been an increasing literature on this subject during the last decade (e.g., Marini et al. 2009; Diniz-Filho et al. 2010; Faleiro et al. 2013).
Considering that there are a few studies predicting how future climate change scenarios could affect reptiles in the Cerrado, this study explores how climate change could potentially change the geographic range of Phalotris lativittatus (Ferrarezzi, 1994), a snake species endemic to the southern rim of the Cerrado (Fig. 1). Specifically, I used three ENM methods to predict potential areas in which individuals of P. lativittatus would be climatically able to presently occur. These areas can indicate, on a short-term basis, places in which collecting efforts should be directed to increase knowledge about the species. Furthermore, I projected the expected geographic range of the species based on different climate change scenarios, in order to identify suitable areas in which P. lativittatus might be found in the future.

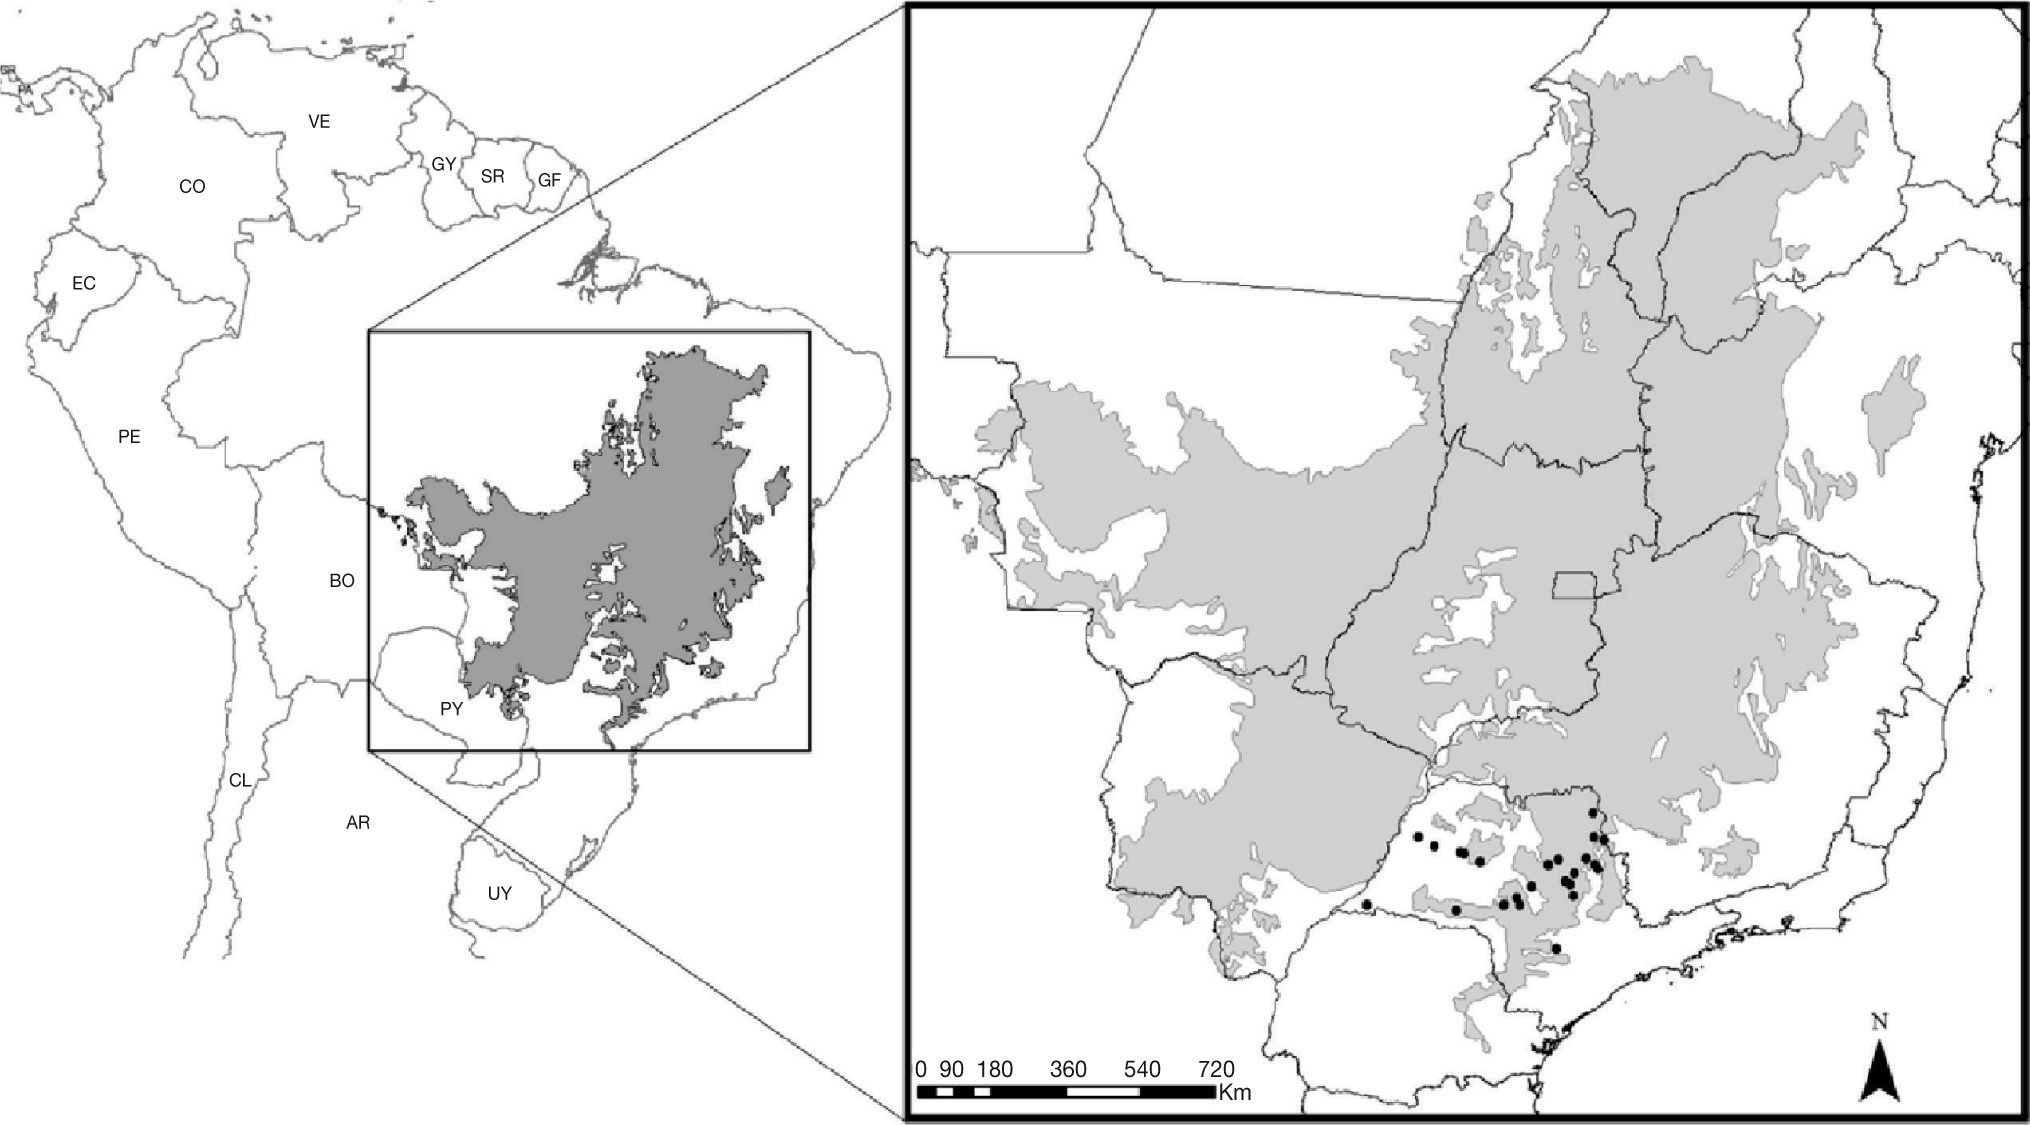
Location of occurrence data of Phalotris lativittatus used for the distribution modeling process. Gray area represents the extent of the Cerrado. Occurrence points apparently outside the Cerrado represent occurrences in small patches of this biome that could not be visualized at this scale.
Phalotris lativittatus is a fossorial Dipsadinae snake endemic to the Cerrado, occurring specifically in the southern rim of this biome in Southeastern Brazil (Fig. 1; Ferrarezzi 1994; Colli et al. 2002; Sawaya et al. 2008; Vasconcelos & Santos 2009; Araujo & Almeida-Santos 2011). Little information is available about this species, despite its original description (Ferrarezzi 1994), reports on new occurrence areas (Vasconcelos & Santos 2009; Araujo & Almeida-Santos 2011), and notes on natural history (Sawaya et al. 2008; Braz et al. 2009). These records from the literature were used to obtain 24 occurrence points for the modeling process (Fig. 1, Table S1).
I used six environmental variables that describe general climatic trends (i.e., mean values), variation in temperature and precipitation over time, and potential physiological limits for reptiles (Nix 1986) to model the species niche and project its geographic range (in current climate, 2050, and 2080 scenarios), namely: annual mean temperature, temperature seasonality, mean temperature of the warmest quarter, mean temperature of the coldest quarter, annual precipitation, and precipitation seasonality. The climatic variables for the current scenario were obtained from the WorldClim database at a spatial resolution of ~10km (Hijmans et al. 2005). To project the species distribution in future scenarios (2050 and 2080), I considered two CO2 emission scenarios (A1B and B2A) that can be roughly classified as ‘pessimistic’ and ‘optimistic’, respectively (Diniz-Filho et al. 2010 and references therein).
Therefore, I used CO2 emission scenarios from the HadCM3 model of the Atmosphere–ocean General Circulation Model (AOGCM) with the same spatial resolution of ~10km (available at the General Circulation Model portal: http://www.ccafs-climate.org/).
Ecological niche modeling and final distribution mapsThe models were calibrated to run within the Cerrado extent (Fig. 2) to minimize overpredictions when wider calibration areas are used as background (Giovanelli et al. 2010). The 24 occurrence points were used to generate potential distribution areas using three ENM methodologies that are widely used in the literature and that are known to have reasonable performance (e.g., Giovanelli et al. 2010; Vasconcelos et al. 2012): bioclimatic envelope algorithm (BIOCLIM), genetic algorithm for rule-set production with a new openModeller implementation (OM-GARP), and support vector machines (SVM). Descriptions and/or application of these methods can be found in Nix (1986), Stockwell & Peters (1999), Giovanelli et al. (2010), Muñoz et al. (2011), and Vasconcelos et al. (2012). The goodness-of-fit of each method was evaluated using the receiver operating characteristic (ROC) curve, whose area under the curve (AUC) ranges from 0 to 1, in which a value of 0.5 indicates a model no better than random and a value of 1 indicates that the model can discriminate perfectly between presence and absence records (Elith & Burgman 2002; Graham & Hijmans 2006).
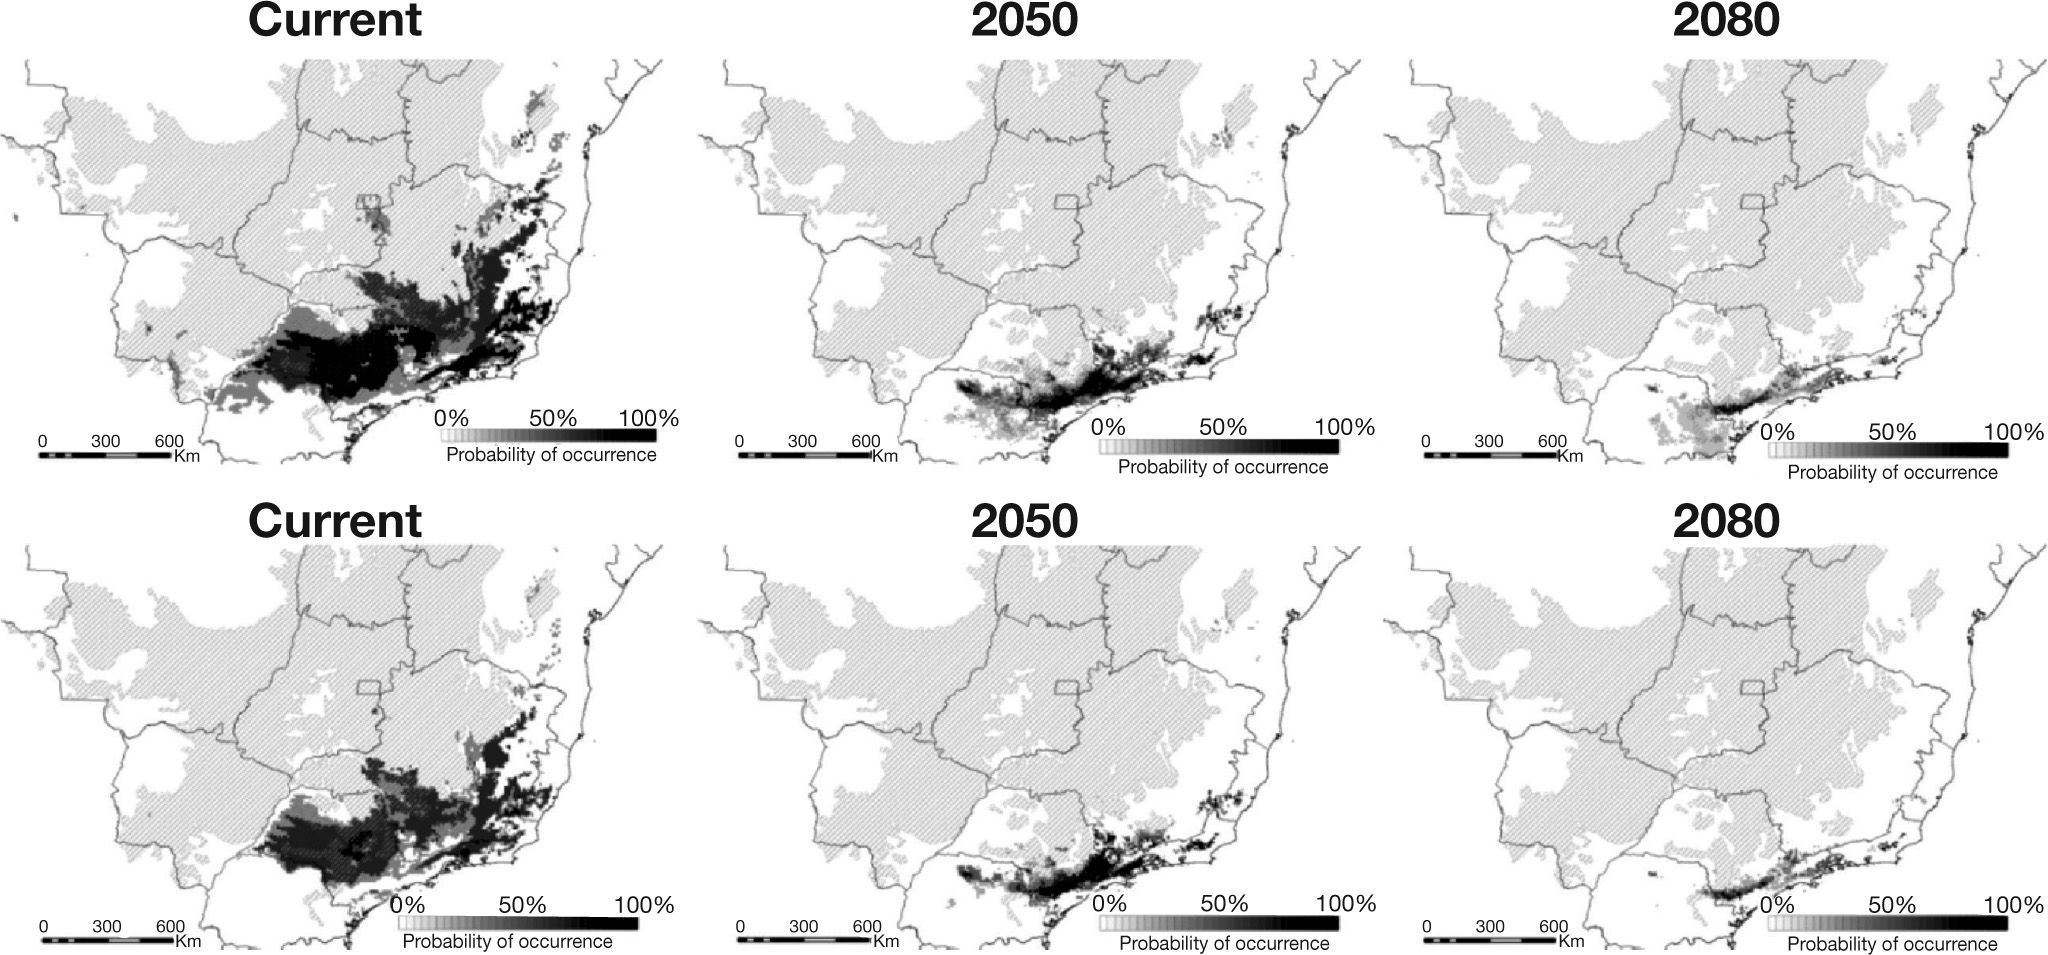
, while lower maps represent the more conservative threshold (70%). Shaded area represents the extent of the Cerrado.")
Predicted occurrences for Phalotris lativittatus considering the three ENM methodologies and two CO2 emission scenarios. Upper maps represent predictions considering the liberal consensus (threshold of 50%), while lower maps represent the more conservative threshold (70%). Shaded area represents the extent of the Cerrado.
Finally, to address the inherent differences among ENM methods and CO2 emission scenarios, ensembles forecasting were generated considering the final predictions of each time slice (Araújo & New 2006). Thus, two consensus maps for each time slice (current, 2050, and 2080) were generated in openModeller 1.1.0 (Muñoz et al. 2011) to predict the most suitable areas of occurrence for P. lativittatus. The first consensus map considered a frequency of occurrence higher than 50% for each one of the three ENM methods and the two CO2 scenarios, whereas the second map considered a more conservative threshold of 70%. At the end, six final maps were generated: three maps for each time slice considering 50% of frequency of occurrence, and three others considering a threshold of 70%. All ENM methods and consensus maps were performed in openModeller 1.1.0 (Muñoz et al. 2011). For modeling purposes, parameterizations (e.g., partition of the dataset for calibration and model evaluation) followed default options in openModeller. Final maps and calculation of total predicted areas were made in ArcGIS 10.1.
ResultsHigh AUC values were found for all ENMs (i.e., 0.99 for BIOCLIM and 0.98 for OM-GARP and SVM predictions), indicating high predictive power. Considering the current climate, the total area predicted for P. lativittatus ranges from 133,159km2 (BIOCLIM) to 471,951km2 (SVM; Table 1, Fig. 2). The consensus map considering a more liberal threshold (50%) demonstrated that P. lativittatus is more probable to occur in its known geographic range (Sao Paulo State, Brazil), but potential distribution also include areas of seasonally dry forest southwestward from the known occurrence points, as well as areas in the Cerrado and seasonally dry forest to the northeast (Fig. 2). Considering a more conservative threshold (70%), the range of P. lativittatus shows reasonable congruence with the previous one, but the species is not predicted to occur in the southwest seasonally dry forest (Fig. 2).
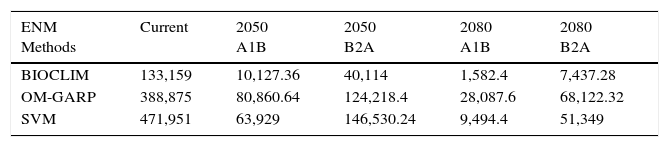
Total distribution area (km2) predicted for Phalotris lativittatus considering all ecological niche modeling (ENM) methods, ‘pessimistic’ (A1B), and ‘optimistic’ (B2A) CO2 emission scenarios, at each time slice (current, 2050, and 2080).
| ENM Methods | Current | 2050 A1B | 2050 B2A | 2080 A1B | 2080 B2A |
|---|---|---|---|---|---|
| BIOCLIM | 133,159 | 10,127.36 | 40,114 | 1,582.4 | 7,437.28 |
| OM-GARP | 388,875 | 80,860.64 | 124,218.4 | 28,087.6 | 68,122.32 |
| SVM | 471,951 | 63,929 | 146,530.24 | 9,494.4 | 51,349 |
The predictions considering the climate change scenarios show that BIOCLIM predicted the smallest range, while OM-GARP predicted the largest (except for the ‘optimistic’ B2A scenario in 2050; Table 1). Even so, all forecasts show continuous reduction in the total area throughout the time (Table 1). The consensus maps with the liberal threshold (50%) show that the total range might be reduced to 34.65% by 2050 and to 19.61% by 2080 when compared to current predictions (Table 2). The more conservative threshold (70%) shows that the reduction is approximately to 30.48% by 2050 and to 10.71% by 2080 compared to current time (Table 2). The 2050 forecasts (considering both thresholds) show that the range contractions are associated to southeastward range shifts, including the occurrence of P. lativittatus in areas in which the current climate does not predict its occurrence (Fig. 2). By 2080, the few remaining predicted areas would mostly encompass the predicted 2050 area (Fig. 2).
Total range size (km2) predicted for Phalotris lativittatus at each time slice, considering the consensus (T-50%=threshold of 50%; T-70%=threshold of 70%) of the different ENM methods and different CO2 emission scenarios (A1B and B2A, see section “Methods” for details). Numbers in parenthesis represent the percentage of total area remaining climatically suitable when compared to the “current” predicted area.
| Time slice | Total area (km2) | |
|---|---|---|
| T-50% | T-70% | |
| Current | 538,569.84 | 385,472.64 |
| 2050 | 186,644.08 (34.65) | 117,493,2 (30.48) |
| 2080 | 105,625.2 (19.61) | 41,300.64 (10.71 |
First and foremost, it is important to emphasize that these predictions represent climatically suitable areas in which individuals of P. lativittatus would be able to occur. This means that P. lativittatus will sometimes be absent inside the predicted area, since the final ENM maps are coarsegrained representations, and that the species will be found only in suitable habitats within the extent of the predicted occurrence. Besides, the ENM methods used are not able to predict absences caused by factors other than climate, such as evolutionary history of the species or clade, biotic factors, and/or dispersal limitations (Graham & Hijmans 2006). For instance, Araujo et al. (2010) did not record P. lativittatus in Cerrado areas, in which the models presumed its occurrence in southeastern Brazil (Águas de Santa Bárbara, São Paulo state). Conversely, studies regarding squamate species distribution are still needed for diverse regions in Brazil, including the Cerrado of Minas Gerais (Southeastern Brazil), in which the models indicate that P. lativittatus might be present. Thus, some important Cerrado areas to which surveys should be directed are the following legally protected parks in the state of Minas Gerais, Southeastern Brazil: Parque Nacional da Serra da Canastra, Parque Nacional da Serra do Cipó, and Parque Nacional das Sempre-Vivas (to visualize these areas, see Fig. 2 of Giovanelli et al. 2008).
Considering the effects of climate change, little change in the geographic ranges and/or increase in the predicted areas can be recorded through the years among different organisms (e.g., Haddad et al. 2008; Diniz-Filho et al. 2010). However, a decrease in the predicted areas is the most common pattern observed for organisms in the Cerrado (Marini et al. 2009, this study) and adjacent biomes (e.g., Atlantic forest; Haddad et al. 2008). A common pattern associated to this range contraction is a range shift (but see Haddad et al. 2008), mostly toward the south/southeast in South America (Marini et al. 2009; Diniz-Filho et al. 2010, but see Marini et al. 2009). The effects of climate change on P. lativittatus by 2050 would include a reduction by 65% to 70% of its original extent of occurrence, and a shift in its range southeastward. However, by 2080, P. lativittatus is expected to occur in the same predicted areas as those of 2050, without substantial range shift. However, the loss of suitable areas by 2080 would even further restrict its extent of occurrence.
Considering only the ‘pessimistic’ CO2 emission scenario (A1B), the extent of occurrence of P. lativittatus could be even smaller than the predicted herein. For instance, the Cerrado is predicted to expand its limits as a response to climate change effects. If Cerrado expansion were to occur southward, new suitable areas would become available for P. lativittatus; however, this increase is not presumed to occur southward (Salazar et al. 2007). Therefore, the occurrence of P. lativittatus would be restricted to a few areas in the southernmost rim of the Cerrado. Additional synergistic effects of climate change, such as dispersal constraints and rapid rates of habitat degradation, among others, may hinder efficient conservation actions in the future (Marini et al. 2009). Since snakes are not good dispersers relative to other organisms, such as birds and mammals, this limited dispersal would prevent individuals of P. lativittatus from isolated Cerrado remnants (Fig. 1) from reaching new climatically suitable areas in the southern Cerrado. Thus, considering that climate change is certain to happen, at least and hopefully in an ‘optimistic’ way, short-term efforts towards gathering basic natural history information for poorly known species, such as P. lativittatus, are mandatory. This basic information, associated with ecological and evolutionary studies, will support more accurate models of species distribution, which in turn will provide more efficient conservation actions.
I am grateful to Prof. Dr. Tiago G. dos Santos and Prof. Dr Fernando R. da Silva for their critical reading of the first draft. Prof. Dr. Levi C. Terribile, the Associate Editor Prof. Dr. José A. F. Diniz-Filho, and an anonymous reviewer also provided great inputs to the manuscript. Diogo B. Provete reviewed the English language. This study was supported by FAPESP (Fundação de Amparo à Pesquisa do Estado de São Paulo, Brazil; grant: 2011/18510-0; research fellowship: 2012/07765-0) and is part of the FAPESP Research Program on Global Climate Change (RPGCC).

