Systematic conservation planning is traditionally based on biological features, sometimes representing a single biodiversity component, such as top predators. However, few studies have tested the efficiency of traditional spatial prioritizations to capture the phylogenetic and functional diversity of entire faunas. Here, we evaluated (1) the congruence among spatial prioritization analyses based on taxonomic, phylogenetic and functional diversity for mammals and birds occurring in Brazil; and (2) the congruence among outputs of spatial priorities for carnivores and birds of prey and priorities for conserving the phylogenetic and functional diversity of all mammal and bird species. Priority sites differed among taxonomic groups as well as among biodiversity aspects, with low congruence among them. Overall, both strategies – full group and top predators – were not efficient and have not captured even half of all variation in phylogenetic and functional diversity existing in the groups.
Systematic conservation planning – the prioritization of sites due to their natural values and implementation of strategies to secure the survival and maintenance of biodiversity – is usually based only on the diversity of taxa (Margules and Pressey, 2000). However, taxonomic diversity is often considered a less meaningful biological diversity measure because it ignores the differences among species (Rodrigues et al., 2011). Some authors have shown that taxonomic diversity does not necessarily overlap the distribution of other important components of biodiversity, such as the phylogenetic and functional diversity (Faith, 1992; Devictor et al., 2010; Strecker et al., 2011). Phylogenetic diversity quantifies the relatedness among species, based on their evolutionary histories (Pavoine and Bonsall, 2011). Meanwhile, functional diversity reflects the ecological relationships among species, considering their life history strategies and the roles that they play in the ecosystem (Pavoine and Bonsall, 2011). Given that extinction of species has led to non-random loss of evolutionary information (Purvis et al., 2000) and underlying ecological functions (Flynn et al., 2009), it is fundamental to test whether current conservation plans are efficient in capturing these biodiversity aspects.
Systematic conservation planning is also a complementarity-based site selection method accounting for both the biological attributes of sites, and inter-site similarities in order to represent all features without much duplication (Kukkala and Moilanen, 2013). Further, a comprehensive conservation plan should address the use of limited conservation resources efficiently beyond maximizing biodiversity features (Margules and Pressey, 2000). Spatial mismatches between taxonomic, phylogenetic, and functional patterns have been evidenced (e.g. Safi et al., 2011), but there are still few studies including the multifaceted nature of biodiversity in conservation planning (Devictor et al., 2010; Strecker et al., 2011) and they encompass only single groups. Top predators, for example, have long been considered a good conservation surrogate by conservation biologists that are faced with time and logistic constraints (Sergio et al., 2008). This group has been commonly employed as tool when identifying areas to conserve spatial heterogeneity (Sergio et al., 2008), a proxy of biodiversity.
However, to date there is no study investigating whether spatial priorities defined on the basis of top predators is efficient to capture the phylogenetic and functional diversities of entire faunas. Here, we used geographic distribution data of mammal and bird species – including top predators of both groups (carnivores and birds of prey, respectively) – for all terrestrial biomes of Brazil. We compared traditional spatial prioritization approaches, which are based on taxonomic diversity with approaches considering phylogenetic and functional components of biodiversity. Also, we explored the congruence between spatial prioritization based on top predators and those different facets of biological diversity. More specifically we tested: (1) the congruence (i.e. spatial overlap) between the priority sites based on taxonomic diversity of all mammals and birds and the phylogenetic and functional diversity of all these species, and (2) the congruence between the priority scenarios based on taxonomic diversity of carnivores and birds of prey and the phylogenetic and functional diversity of all mammal and bird species.
Materials and methodsSpecies distribution modelsWe modeled the potential distribution of Brazilian mammals (n=515 species) and birds (n=1581 species) as a function of abiotic variables using the extension of occurrence provided by IUCN (www.iucnredlist.org) and BirdLife International (www.birdlife.org). Because species distribution maps have, in general, coarse resolution we chose to model each species distribution instead of using its extension of occurrence. This has been used to provide finer resolution estimates of species occurrences for spatial planning analyses (e.g. Loiselle et al., 2003).
We mapped each species in a grid of 3057 cells with 0.5×0.5 of latitude/longitude (about of 55,200m in Ecuador Line) covering all Brazilian territory. We built a presence–absence matrix from overlapping the species distribution maps and cell grids. Species were considered as present in a cell when their range covered more or at least 50% of the cell. We also built a matrix of abiotic variables: altitude and climatic variables (Mean Temperature of Warmest Quarter, Mean Temperature of Coldest Quarter, Annual Precipitation and Precipitation Seasonality). We obtained these variables from of WorldClim database (www.worldclim.org) interpolating climate data from 1950 to 2000 periods.
Projections coming from alternative species distribution models can be variable and, in addition, the sensitivity of each species to the models is unknown (Diniz-Filho et al., 2009). Therefore, as we were interested in a large number of species, with different range characteristics and sensibilities unknown, we modeled the species distribution applying an ensemble forecasting approach in which different methods of ecological niche model were combined (Araújo and New, 2007). This procedure provides a more robust consensus forecast reducing uncertainties (Araújo and New, 2007) that may mislead conservation actions making them less cost-effective (Loiselle et al., 2003). We chose the following ecological niche models (ENM) methods: Generalized Linear Models (GLM), Generalized Additive Models (GAM), and Multivariate Adaptive Regression Splines (MARS). We used such methods because their predictions are intermediate between commission and omission error if compared with distance and machine-learning methods (see Rangel and Loyola, 2012).
To build each ecological niche model we randomly partitioned the species data in calibration data (75%) and validation data (25%) replicating this process for 50 times (cross-validation test). We used true skill statistics (TSS, Allouche et al., 2006) as a measure of model performance, given by:
where sensitivity is the proportion of species presences correctly identified and specificity is the proportion of the correctly identified species absences (both calculated from the validation subset). Models with TSS lower than 0.5 were excluded from analyses. Species occurrences resulting from ecological niche models were expressed as frequencies of occurrence at which they appear at each cell. We also calculate presence-absence at each cell applying a majority consensus rule cutting estimated frequencies of occurrence at 50%.Phylogenetic and functional analyses
For each cell grid we quantified the phylogenetic and functional diversity of (i) carnivores, (ii) birds of prey, (iii) all other mammals (except carnivores) and (iv) birds (except birds of prey) of Brazil based on the species composition resulted of ecological niche models. To quantify the phylogenetic and functional diversity of groups we used the Mean Pairwise Distance (MPD), a measure independent of taxonomic diversity (Webb, 2000). Originally, MPD was developed for estimating only phylogenetic diversity; however, taking into account that phylogenetic and functional data have similar structure, MPD can also be applied for estimating functional diversity (Pavoine and Bonsall, 2011). Therefore, in this study, MPD represents both the mean phylogenetic distance as the mean functional distance between all pairs of species co-occurring. To quantify phylogenetic diversity of mammals we used the phylogenetic tree of Fritz et al. (2009), while for birds we used the topology of phylogenetic tree of Jetz et al. (2012). To quantify functional diversity of mammals and birds we used ten traits – five for each class – related to meaningful functions and processes of assemblages (Tables S1 and S2, online Supplementary material). To construct the functional dendrogram we used Gower distance and UPGMA clustering. We conducted phylogenetic and functional analyses in R (www.r-project.org).
Conservation prioritiesPriority areas for conservation were identified using the Zonation framework and software (Moilanen et al., 2012). Zonation identifies areas that are important for retaining environmental quality and connectivity for multiple species simultaneously from a hierarchical prioritization based on conservation value of cells (Moilanen et al., 2012). We assessed different conservation plans that took into accounting an integrated view of biodiversity for comprehending the complementary facets of diversity (Devictor et al., 2010). We used an Additive Benefit Function Zonation variant which bases selection on a cell's weighted occurrence for all species, favoring sites with the highest species richness while fitting species’ proportional distribution in a given cell (Moilanen, 2007). Here, the units in our systematic conservation planning analysis were the ENMs consensus solution.
We used the distribution discounting (Moilanen et al., 2006) to include the uncertainty associated to ENMs. This method penalizes a site and species-specific measure of conservation value by an error measure, in our case by TSS. For each cell, we applied a subtraction of a multiple of the standard deviation of predictions across ENMs, SD [psc], by the mean prediction (ps∗), which represented our nominal estimate. Specifically, we calculated psc(α)=max{0,psc∗−α SD[psc]}, where α is the horizon of uncertainty in information-gap decision theory (Ben-Haim, 2006). Nevertheless, our analysis used α=1 which means subtracting one standard deviation off the mean. For incorporating this measure, we aggregated the highest conservation value to those species s that have high mean probability and low deviation across all ENMs.
We used the hierarchical ranking of cells by an iterative process created in Zonation to investigate the quantitative trade-off between ecological features through both specific facets of biodiversity: taxonomic, phylogenetic and functional diversity. Then, we compared the outcome of the prioritization with diversity scenario according to a ranking from 0.1% to 100% for the landscape. Finally, we quantified the percentage of cells overlapping in each ranking of the landscape (i.e. spatial concordance) considering each pairwise combination of diversity measures to estimate the spatial congruence between the different priority scenarios.
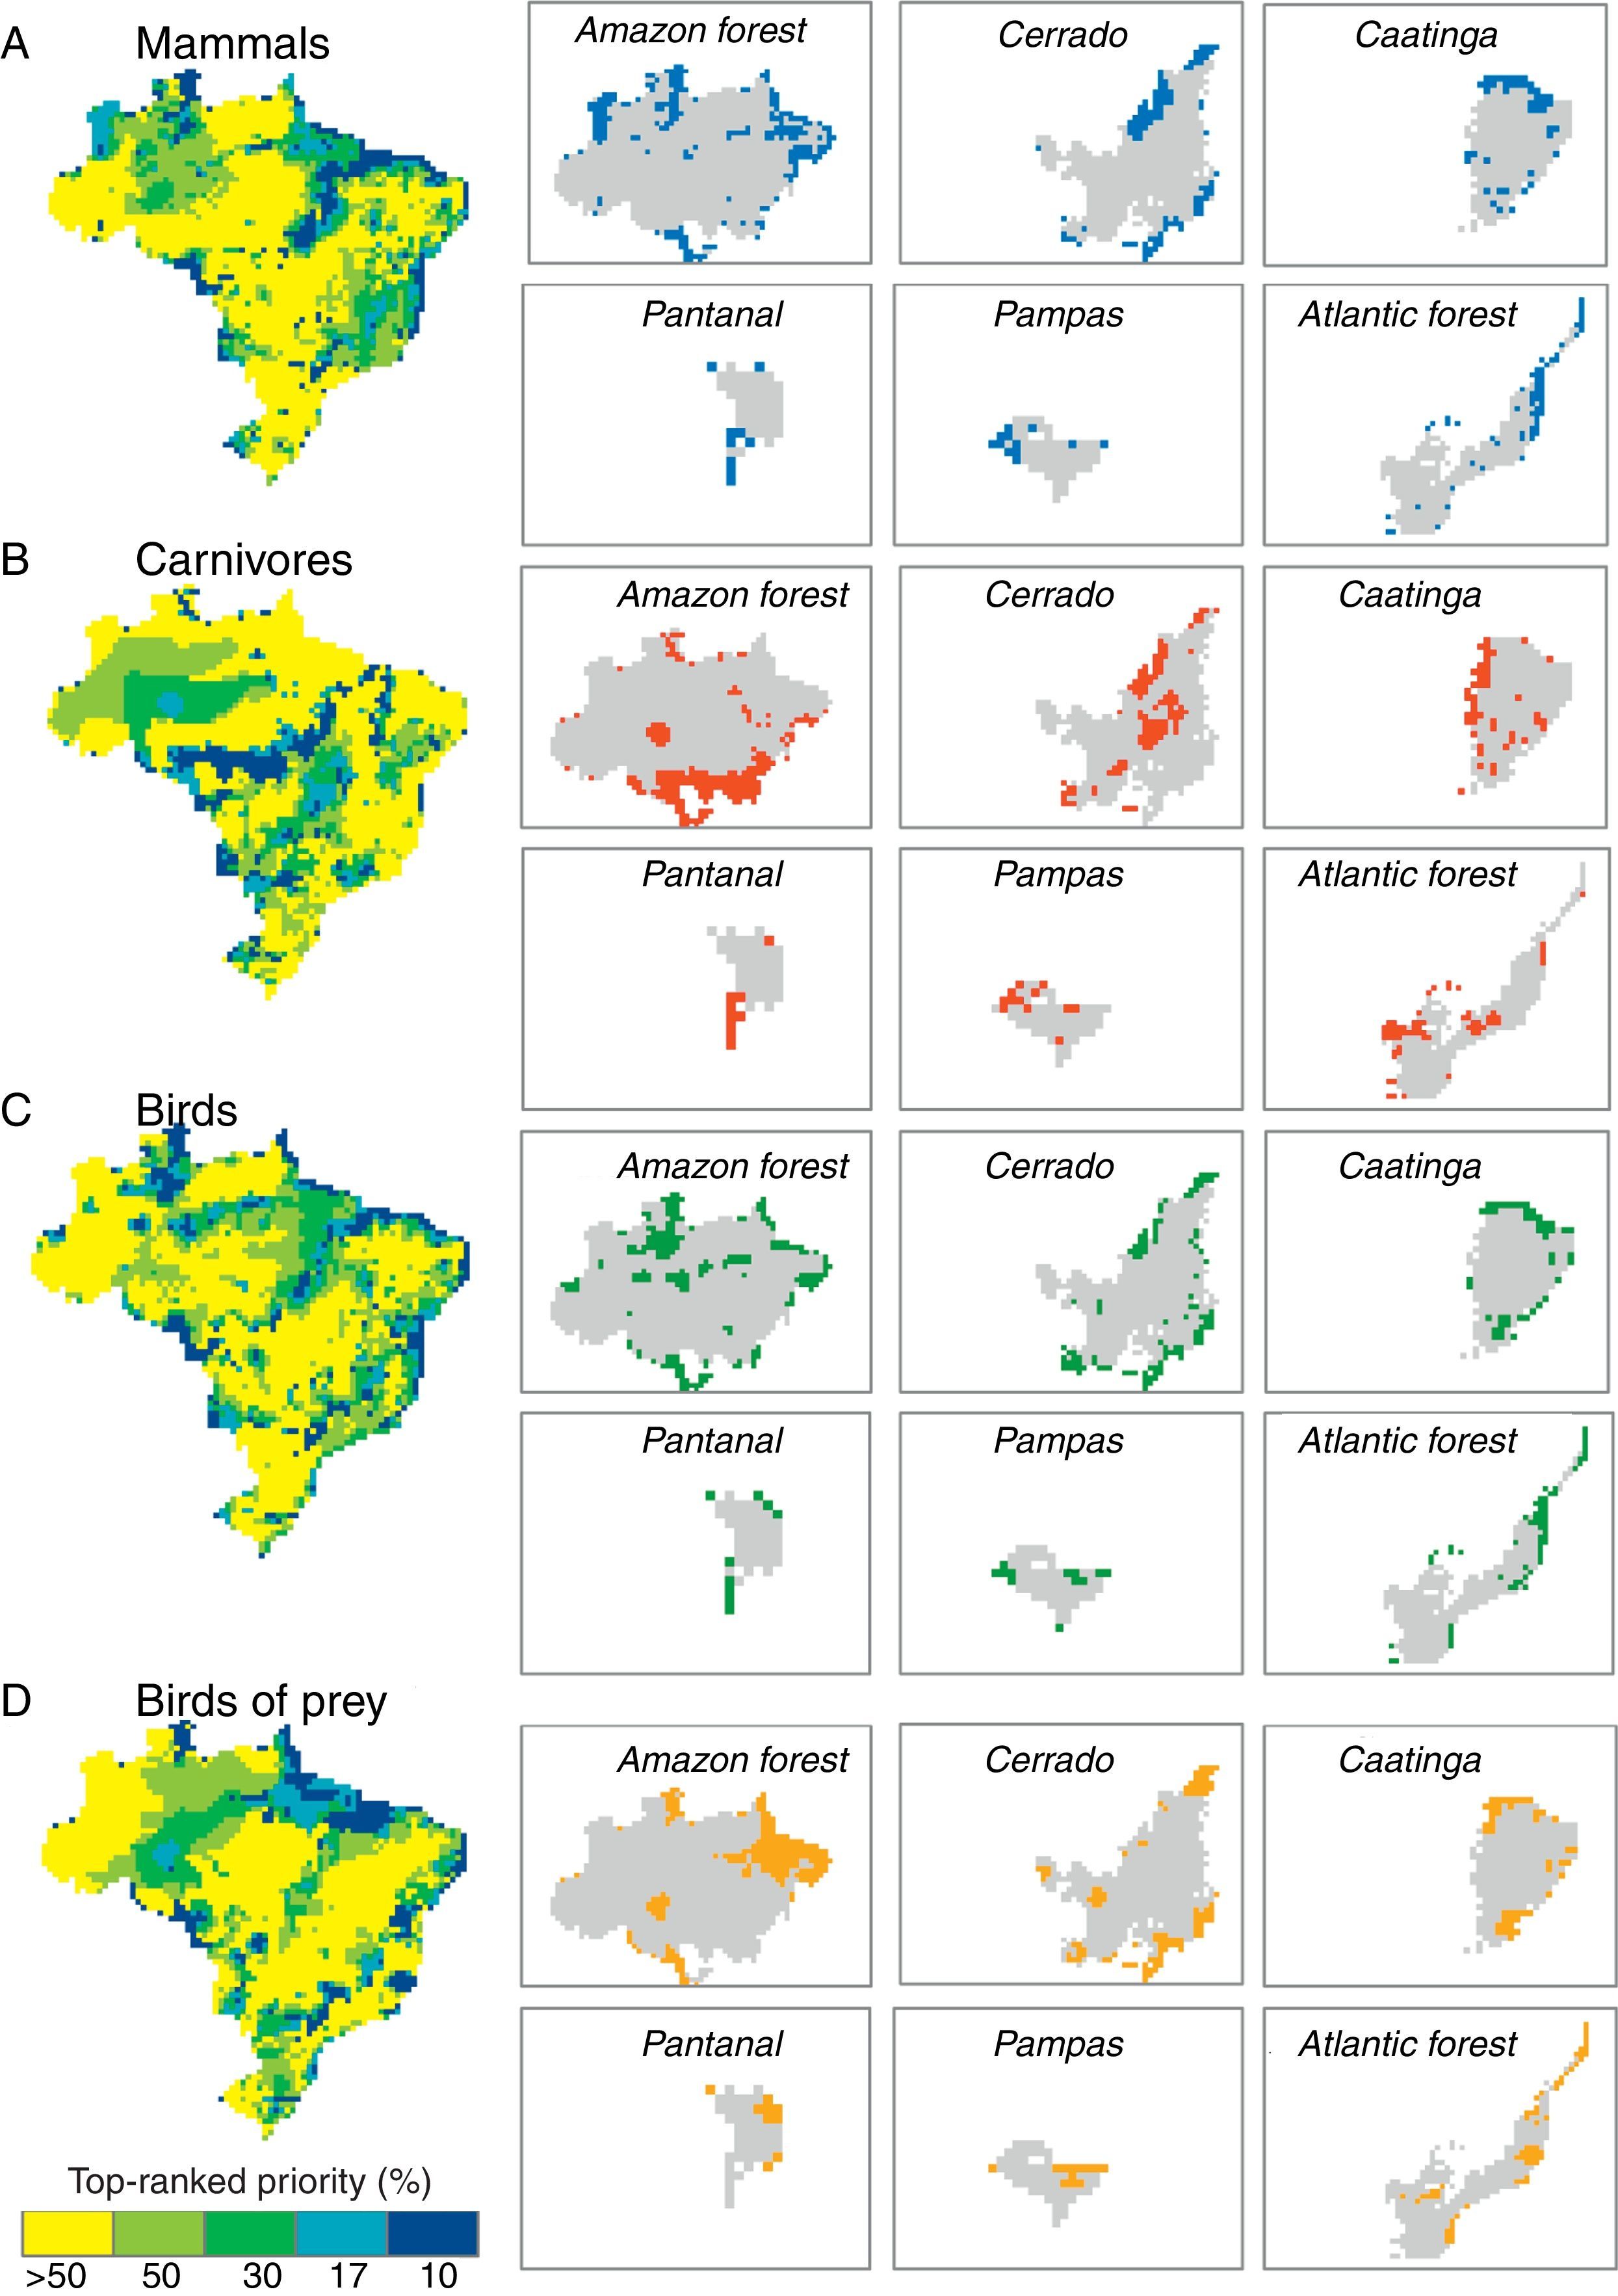
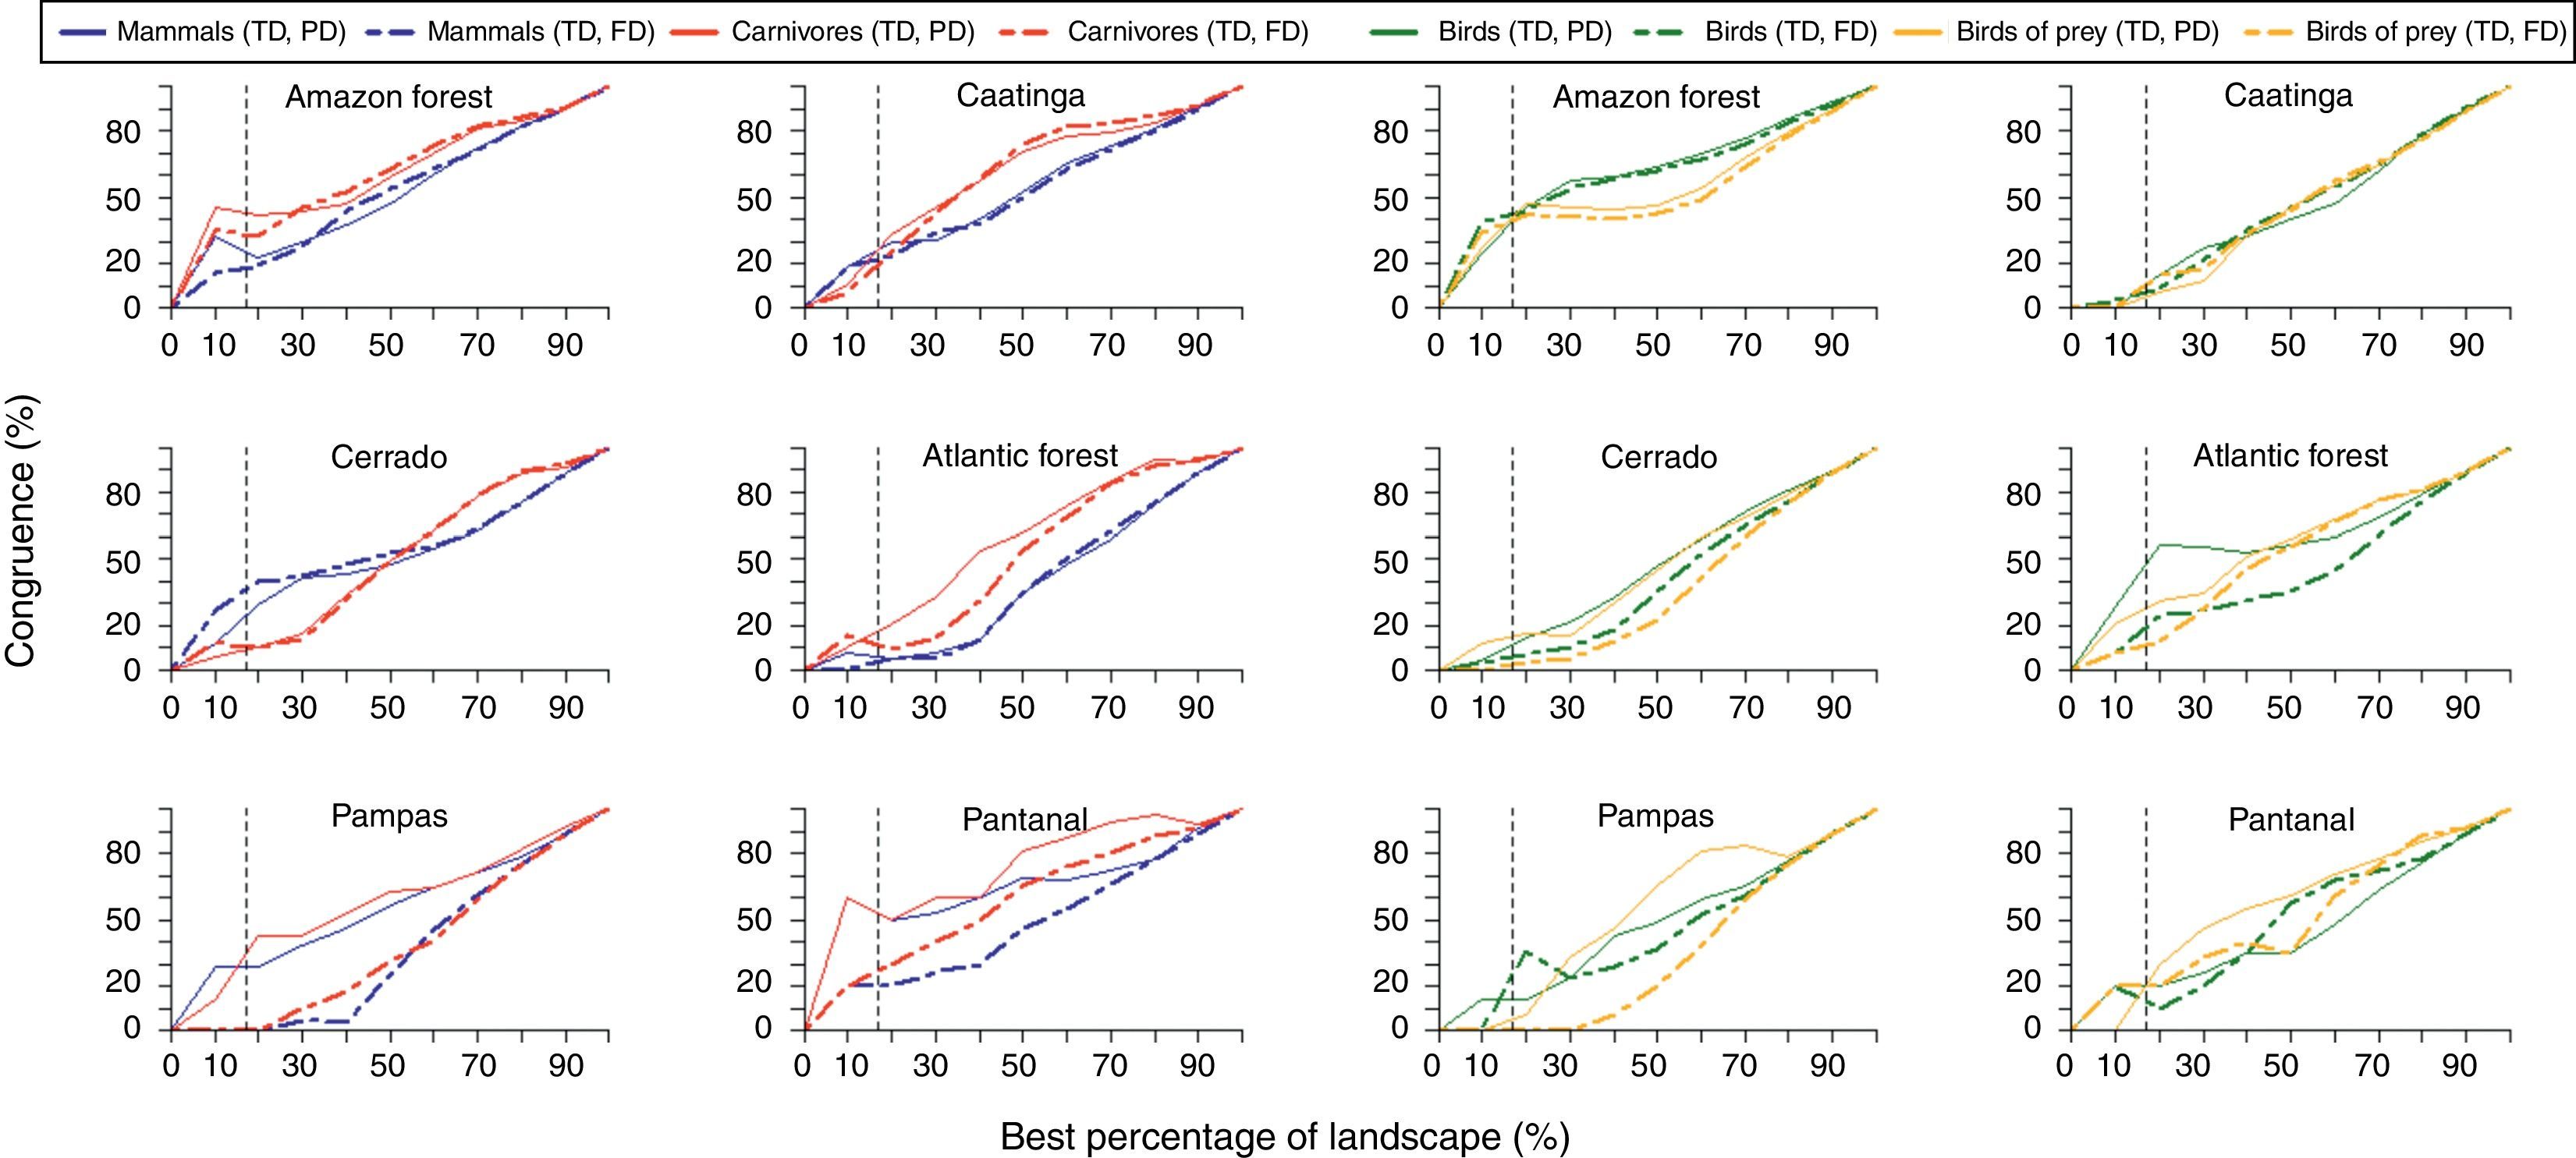
ResultsPriority scenarios differed among taxonomic groups, biodiversity measures and biomes of Brazil (Fig. 1). For practical purposes, here, we show only the best 17% of sites for all scenarios, according to the target defined for terrestrial environment from Aichi Biodiversity Targets to 2020 (www.cbd.int). This target is a concrete political commitment signed by the Brazilian government. Under the top 17% of the sites, our results revealed low congruence between all prioritizations based on taxonomic diversity and phylogenetic and functional components of biodiversity (see congruence on black dashed lines in Fig. 2 and Table 1). The highest congruence occurred between priorities based on taxonomic diversity of mammals and carnivores, and phylogenetic diversity of all mammals occurring in the Pantanal biome (55.56%, Table 1). All other scenarios have not achieved at least 50% of congruence between the measures of biological diversity, and also indicated that both strategies – full group and top predators – have not captured even half of all variation in phylogenetic and functional diversity (Table 1).

 versus phylogenetic (PD) versus functional (FD)) along an increasing gradient of landscape quality (ranking). The black dashed lines indicate the congruence considering the top 17% priority rank.")
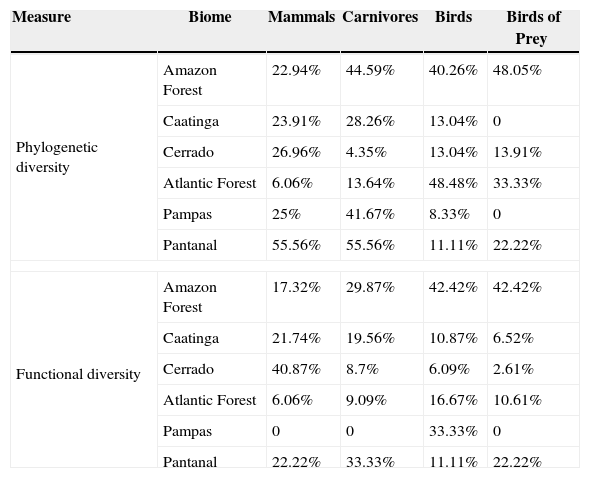
Congruence between top 17% of spatial prioritizations based on taxonomic diversity of mammals, carnivores, birds and birds of prey and phylogenetic and functional components of biodiversity across biomes of Brazil.
| Measure | Biome | Mammals | Carnivores | Birds | Birds of Prey |
|---|---|---|---|---|---|
| Phylogenetic diversity | Amazon Forest | 22.94% | 44.59% | 40.26% | 48.05% |
| Caatinga | 23.91% | 28.26% | 13.04% | 0 | |
| Cerrado | 26.96% | 4.35% | 13.04% | 13.91% | |
| Atlantic Forest | 6.06% | 13.64% | 48.48% | 33.33% | |
| Pampas | 25% | 41.67% | 8.33% | 0 | |
| Pantanal | 55.56% | 55.56% | 11.11% | 22.22% | |
| Functional diversity | Amazon Forest | 17.32% | 29.87% | 42.42% | 42.42% |
| Caatinga | 21.74% | 19.56% | 10.87% | 6.52% | |
| Cerrado | 40.87% | 8.7% | 6.09% | 2.61% | |
| Atlantic Forest | 6.06% | 9.09% | 16.67% | 10.61% | |
| Pampas | 0 | 0 | 33.33% | 0 | |
| Pantanal | 22.22% | 33.33% | 11.11% | 22.22% | |
In addition, pairwise spatial similarities between all scenarios ranged from 0 to 55.56%, with some priority sites showing a total mismatch among different components of biodiversity (Table 1). On the one hand, spatial priorities based on taxonomic diversity of carnivores were slightly more congruent with phylogenetic and functional diversity than priorities based on taxonomic diversity of all mammals, except in the Cerrado biome. On the other hand, spatial priorities based on taxonomic diversity of birds of prey did not show a high congruence with phylogenetic and functional diversity compared with prioritizations based on taxonomic diversity of all birds (Fig. 2).
DiscussionOur results indicate that spatial priorities defined on the basis of diversity of taxa cannot efficiently cover other meaningful facets of biodiversity. In general, the top 17% priority sites showed low congruence between the measures of biological diversity: in most scenarios priority sites failed to capture evolutionary and ecological information about the species. Furthermore, our results indicate that some of these scenarios are totally incongruent among taxonomic, phylogenetic and functional diversity. Such spatial mismatch among different components of biodiversity has long been observed in nature (e.g. Faith, 1992), both in terrestrial (Devictor et al., 2010) as aquatic environments (Strecker et al., 2011), which highlights the urgent need for an integrated approach to conserve the biological diversity.
Developing conservation plans that combine phylogenetic and functional information about species is now crucial, given that the current biodiversity crisis has gone beyond the extinction of species and several studies have recorded not only the loss of evolutionary history (Purvis et al., 2000) as well as ecological functions (Flynn et al., 2009). Phylogenetic relationships among species can reveal biogeographic and historical events that shape the structure and composition of assemblages along time (Pavoine and Bonsall, 2011). Meanwhile, functional relationships can reflect the role of species interactions and their link with ecosystem functioning (Pavoine and Bonsall, 2011). Thus, preserving the phylogenetic and functional diversity can, respectively, guarantee the maintenance of evolutionary mechanisms responsible for the species assembly, as well as ensure the goods and ecosystem services provision.
Systematic conservation planning also has been applied according to criteria that are not completely ecological, for example, addressing prioritization of charismatic groups, such as top predators (Caro et al., 2004). This strategy has been widely used to support conservation actions, but most of them often do not test the real benefits delivered to all biodiversity. Here, although conservation priorities based on carnivores have been slightly more congruent than those based on all mammals, scenarios based on birds of prey were not more efficient than those based on all birds.
Conservation biologists have increasingly debated the potential compatibility between top predators and biodiversity conservation. However, there is still no consensus about its effectiveness as a biological diversity surrogate (Sergio et al., 2008). Some studies suggest that top predators are associated with biodiversity for several reasons: maintenance of trophic cascades, connectivity to different ecosystem factors, resource facilitation, dependence on productivity and heterogeneity of ecosystem, and sensitivity to environmental disturbances (Sergio et al., 2008). In contrast, our spatial prioritizations suggest that carnivores and birds of prey cannot function as indicators of phylogenetic and functional diversity of mammals and birds in the Brazil. Previous studies also have suggested that umbrella and flagship species cannot be a good biodiversity surrogate (e.g. Andelman and Fagan, 2000). Such evidences reinforce that spatial priorities based on top predators cannot be efficient and, at least should be carefully used on comprehensive conservation strategies.
Our results can also be employed to evaluate the efficiency of current conservation plans to preserve different aspects of species (Rodrigues et al., 2011), and highlight the need for an integrated approach to biological diversity conservation (Devictor et al., 2010; Strecker et al., 2011). We found evidence that top predators are not good indicators of overall biodiversity, given the low efficiency in cover phylogenetic and functional components of biological diversity. Thus, we suggest that spatial priorities should include evolutionary and ecological information about the species to increase the efficiency of traditional conservation plans to preserve the different facets of biodiversity.
Conflicts of interestThe authors declare no conflicts of interest.
FLS thanks CNPq for support (grant # 381418/2011-1). LJ and NM (grant # 1243/81-2) thank CAPES for support. PL thanks CNPq for support (grant # 150480/2014-8). RL research has been constantly funded by CNPq (grants # 304703/2011-7, 479959/2013-7 and 407094/2013-0), Conservation International Brazil, and O Boticário Group Foundation for the Protection of Nature (PROG_0008_2013). MVC has a productivity grant from CNPq (# 306843/2012-9). This is a paper from the SISBIOTA – Top Predators network. The authors thank CNPq and Fundação de Amparo à Pesquisa do Estado de São Paulo for financial support.
The following are the supplementary material to this article:

