Here we applied phylogenetically based conservation analyses using a novel multivariate approach to better evaluate the effects of human land use on different primate lineages worldwide. Using a 1°×1° grid, we obtained information on primate species distribution and the cover of six land use categories (Urban, Village, Cropland, Rangeland, Seminatural and Wild). We synthesized the phylogenetic composition into principal coordinates of phylogenetic structure. We correlated phylogenetic composition and land use in each region, and assessed statistical significance via null model. In America, the Atelidae clade was associated to areas with larger coverage of villages whereas Pitheciidae was found on areas with higher cover of wildlands. Moreover, we found some Atelidae, Callitrichidae and Pitheciidae species to be associated with seminatural areas, while other Alouatta and Callicebus species were more related with higher coverage of rangelands. In Madagascar, Lemuridae was negatively associated with wild areas. Africa did not show any statistically significant association between clades and land use. Asia had an intense association of some Cercopithecidae species with high coverage of villages. Primate lineages are currently facing different land use pressures, which would imply in the need of clade-specific conservation planning.
Approximately 75% of Earth's ice-free land has been altered by humans (Ellis and Ramankutty, 2008) and such alterations have modified global patterns of biodiversity. Over the last decades, increased information on human activities across the globe has enabled us to evaluate the effects of such human activities on biodiversity at broad geographical scales (Brum et al., 2013; Harcourt and Parks, 2003; Pekin and Pijanowski, 2012). Commonly, these evaluations have been conducted using species as foci of the research (Davidson et al., 2012; Pekin and Pijanowski, 2012). However, phylogenetic relationships among taxa are also an important measure for conservation biology (Faith, 1992; Vane-Wright et al., 1991). Most phylogenetic approaches are limited because they summarize phylogenetic diversity in a single metric, such as the phylogenetic diversity index (PD; Faith, 1992), which can obscure which clades are influenced by different sorts of threats. In fact, clades may be affected disproportionally by human disturbances, which, in turn, will determine the relationships among different regions of the phylogeny, providing clues for conservation interventions (Loyola et al., 2014). Here we applied phylogenetically based conservation analyses using a novel multivariate approach to better evaluate what threats impact different lineages.
Much of the variation in species’ extinction risk is associated with spatial patterns of human threats and depends on how different species respond to threats (Purvis, 2000; Cardillo and Meijaard, 2012). Human land uses are unevenly distributed across the globe (Ellis and Ramankutty, 2008), and different types of land use can have different impacts on biodiversity. For example tropical regions, which shelter much of the global biodiversity, suffer from intense deforestation, condemning forest species to local extinction (Hansen et al., 2013). High human population densities in Asia lead to a direct conservation conflict between human populations and wild species, which result in increased hunting pressure (IUCN, 2013).
Phylogenetic relatedness may influence how species respond to human impacts. Closely related species are likely to show high trait similarity (Felsenstein, 1985) and, consequently, could respond similarly to threats. In other words, species with high extinction risk sharing the same phylogenetic affinities and ecological traits may be more prone to go extinct. In contrast, unrelated species might respond differently to human threats. As a result, it may be useful to consider phylogenetic relatedness in conservation assessments and planning (Corey, 2010; Cardillo and Meijaard, 2012; Hidasi-Neto et al., 2013; Loyola et al., 2014).
One common way to quantify phylogenetic relatedness is to use diversity metrics based on phylogenetic distance. The most frequently used metric is Faith's PD (Faith, 1992), which sums the branch lengths of the phylogenetic tree connecting all species within a community (Faith, 1992). However, phylogenetic diversity metrics synthesize phylogenetic information into one single value. As a consequence, other aspects of phylogenetic diversity are neglected. Hence, it is important to not only know how much diversity is found in a given location, but what that diversity is, especially since different lineages likely respond to different threats (Davidson et al., 2012; Pekin and Pijanowski, 2012). To address this shortcoming we used a metacommunity phylogenetics approach, which describes the distribution of different phylogenetic lineages across a set of communities using fuzzy sets defined by species’ phylogenetic similarities (Pillar and Duarte, 2010; Duarte, 2011). By using this approach, we could assess the main anthropogenic pressure acting on individual lineages.
Primates represent an important case study on which to apply our methods because nearly half of all the world's primates are currently threatened (IUCN, 2013). Primates are mainly threatened by habitat destruction, hunting (for food and other purposes) and live capture for export or local trade (Chapman and Peres, 2001; Mittermeier et al., 2012). Not surprisingly, the mechanisms underlying the increased extinction risk in primates are directly linked to human population growth and social-economic activities (Chapman and Peres, 2001; Harcourt and Parks, 2003; Benchimol and Peres, 2013). While much has been done on the impact of human activities on primate species, only few studies evaluated how these impacts influence phylogenetic diversity beyond simply quantifying loss of phylogenetic diversity (Sechrest et al., 2002; Spathelf and Waite, 2007).
In this paper, we did a broad-scale evaluation on the association between land use and primate phylogenetic composition to answer the following question: what human impacts have the strongest influence on primate clades in each continent and Madagascar? For this, we evaluated if there is an association between the distribution of primate lineages and particular types of land use. We discuss the potential threats that most likely impact each clade.
MethodsPrimate occurrence dataWe obtained primate species occurrences by overlapping the range maps from the Global Mammal Assessment (IUCN, 2013) on to a 1°×1° grid. Only cells with presences were used for further analysis. We split the occurrence data per continent; Madagascar was analyzed separately from continental Africa, due to its historical isolation, which generated a completely distinct biota in this island (Lehman and Fleagle, 2006). We used primate species composition in each cell for further analyses.
Phylogenetic compositionWe used the phylogenetic hypothesis from Perelman et al. (2011), which includes phylogenetic relationship between 186 primate species from 61 genera and estimated divergence time for each node in MYA. Species were arranged as polytomies inside the node of the genera, and genera and species absent in Perelman's phylogeny were inserted based on literature information (see Supplementary Material). The phylogeny used in the analyses contained 416 primate species, from 72 genera, and the branch lengths were dated in MYA. Then we assessed the phylogenetic composition of primate clades in each continent and Madagascar performing the phylogenetic fuzzy-weighting method developed by Pillar and Duarte (2010), using the package SYNCSA (Debastiani and Pillar, 2012) and ape (Paradis et al., 2004) in the R software. This method uses phylogenetic similarities between taxa to scale-up the phylogenetic relationships from taxa to the site level. First, pairwise phylogenetic distances between species were taken from the phylogeny, and then transformed into a phylogenetic similarity matrix (SP) ranging from 0 to 1. Then, phylogenetic similarities in SP were used to weigh primate species composition in each cell, using a fuzzy set algorithm (see Pillar and Duarte, 2010 for details). This procedure generated a matrix P of species by cells containing primate species composition weighted by phylogenetic relationships. Each value in matrix P is the probability of a given species to occur in a cell given its phylogenetic similarities to the species that were actually found in the cell. We then performed a principal coordinates analysis (PCoA) on matrix P, based on square-root of Bray–Curtis distances between cells, which generated principal coordinates of phylogenetic structure (PCPS; Duarte, 2011). Each PCPS is a vector describing an independent phylogenetic gradient in the dataset (Duarte, 2011). The PCPS with the highest eigenvalue describes broader phylogenetic gradients related to the oldest tree nodes and, as the eigenvalues of the other PCPS decrease, finer phylogenetic gradients related to higher nodes (e.g., families, genera) are described (Duarte et al., 2012). Then, the associations between primate phylogenetic clades and each phylogenetic vector in each continent were plotted in a correlation scatter plot.
Land useWe used the Ellis and Ramankutty's (2008) reclassification of global land cover into “anthropogenic biomes” or “anthromes”. They identified and mapped 18 anthropogenic biomes using a multi-stage process based on global data for population density, land use and land cover. Using GIS processing, we obtained the cover of each land use per 1°×1° cell. In order to facilitate the interpretation of our results, we synthesized the cover of the 18 categories into six major land use categories, in decreasing order of human population density: urban (1788persons/km2), villages (327persons/km2), croplands (33persons/km2), rangelands (7persons/km2), seminatural (1person/km2) and wild (0person/km2). The proportion of cover of each land use category per cell was treated as separate variables in the analyses.
Statistical analysisWe measured the association between the distribution of primate clades and land use types in each continent using Pearson correlation coefficient (r). For each continent, we correlated each land use type with the PCPS axes containing more than 5% of the total variation on the P matrix, to avoid including low representative axes in the analysis.
We used a null model to ensure that the observed association between some primate lineages and specific land use types is different of what would be expected if the clades were randomly distributed across the space (Debastiani et al., 2014). For this, we built 999 random trees where tree tips (species names) were shuffled across the tree. As a result the phylogenetic distance between any pair of species across the phylogenetic tree changed in each random tree. At each tree randomization, we recalculated the matrix P and the PCPS axes.
The PCPS null axes were submitted individually to a procrustean adjustment with the respective observed PCPS; this procedure is necessary for comparing two distinct axis of ordination. Procrustes analysis minimizes the differences in the sum of squares between two data sets (Jackson, 1995) and allows to obtain the fitted PCPS null. The adjusted PCPS null axes, which can be compared with the observed PCPS, were correlated to land use. In the end, we had a distribution of 1000 Pearson correlation values (999 random plus 1 observed) for each PCPS-land use pair (e.g., PCPS1 vs. cover of villages). The rank position of each observed correlation in relation to random correlations defined the probability p of the observed coefficient being different of what we could expect by randomizing lineages distribution. As correlation coefficients could be either positive or negative, we used a two-tailed test. Thus, assuming a type I error probability of 0.05, any observed correlation with p values lower than 0.025 or higher than 0.975 were considered significant. It is important to note that the null model kept the species occurrence matrix (species by cells) fixed and therefore controlled for spatial autocorrelation (Pillar and Duarte, 2010).
ResultsWe analyzed the phylogenetic distribution of 416 primate species, being 141 species from five families (Aotidae, Atelidae, Callitrichidae, Cebidae and Pitheciidae) occurring in America, 83 species from four families (Cercopithecidae, Galagidae, Hominidae and Lorisidae) in continental Africa, 93 from five families (Cheirogaleidae, Daubentoniidae, Indriidae, Lemuridae, Lepilemuridae) in Madagascar and 99 species from five families (Cercopithecidae, Hominidae, Hylobatidae, Lorisidae and Tarsiidae) in Asia. All the lineages occurring in America and Madagascar are exclusive of these regions, while Africa and Asia share three families (Hominidae, Lorisidae and Cercopithecidae).
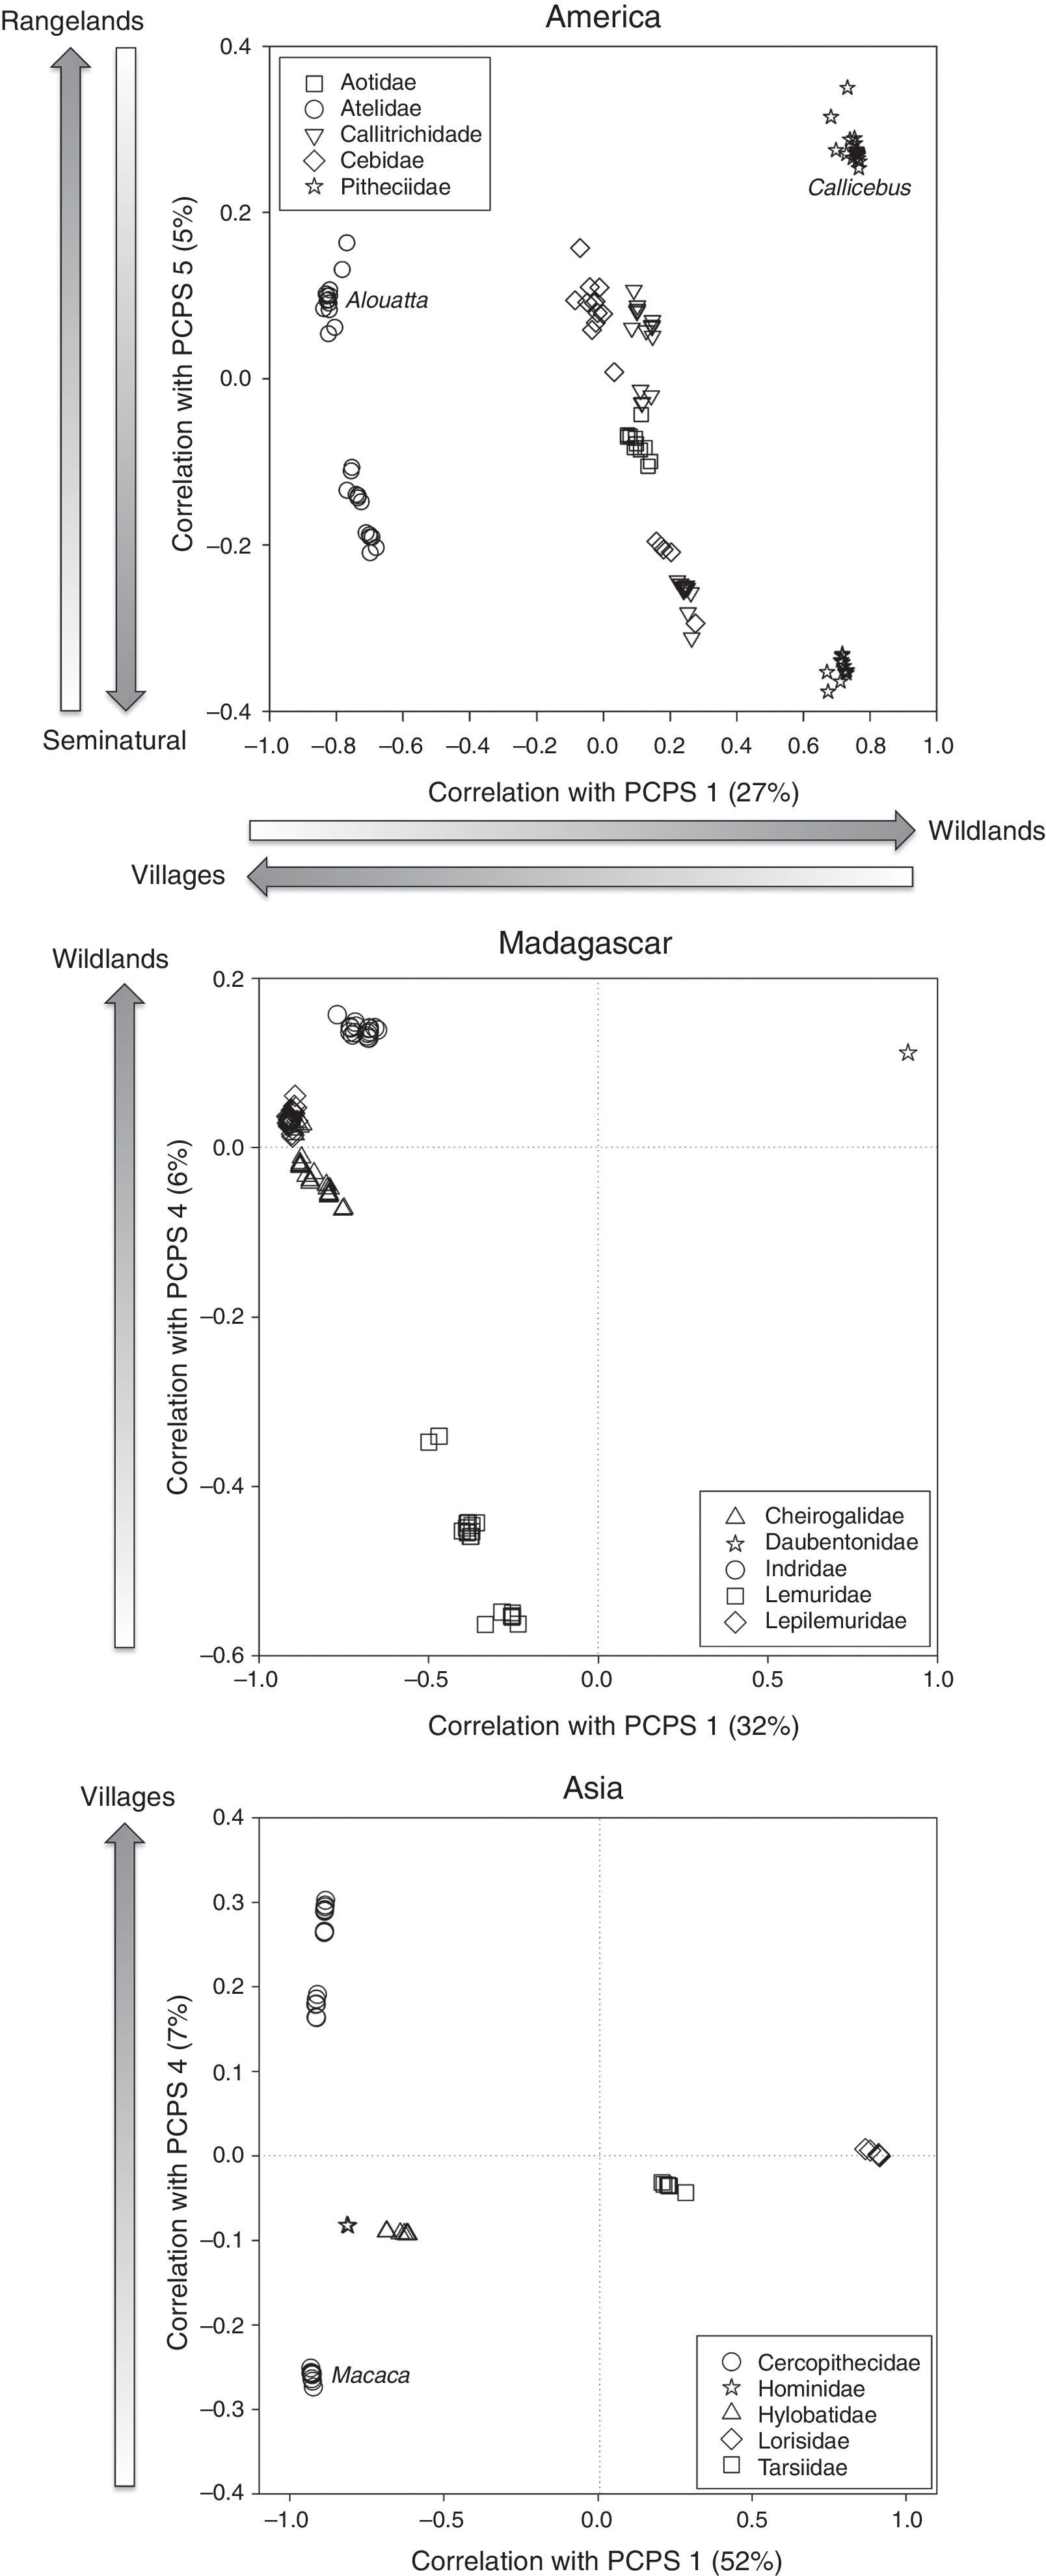
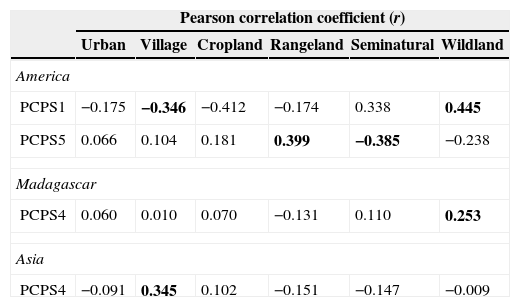
In America, only two axes of primate phylogenetic composition (PCPS 1 and PCPS 5) held significant correlation with land use, specifically the cover of villages, rangelands, seminatural lands and wildlands (Table 1). The PCPS 1 was correlated with an opposite gradient of villages and wildlands (Table 1), the Atelidae clade being the one more associated to areas with higher villages and Pitheciidae with higher cover of wildlands (Fig. 1). In relation of PCPS 5, this axis was correlated with rangeland and seminatural areas (Table 1). We found some species from Atelidae, Callitrichidae and Pitheciidae associated with these seminatural areas, while Alouatta (Atelidae) and Callicebus (Pitheciidae) species were more related with areas with higher cover of rangelands (Fig. 1).
Pearson correlation coefficients (r) between land use cover and principal coordinates of phylogenetic structure (PCPS) in the regions that presented at least one significant correlation coefficient (America, Madagascar and Asia). The values in bold indicate significance of the correlation coefficient, with p values, obtained by the null model (see main text for explanation), being lower than 0.025 or higher than 0.975. Africa did not present any significant correlation coefficient and was not included in this table.
| Pearson correlation coefficient (r) | ||||||
|---|---|---|---|---|---|---|
| Urban | Village | Cropland | Rangeland | Seminatural | Wildland | |
| America | ||||||
| PCPS1 | −0.175 | −0.346 | −0.412 | −0.174 | 0.338 | 0.445 |
| PCPS5 | 0.066 | 0.104 | 0.181 | 0.399 | −0.385 | −0.238 |
| Madagascar | ||||||
| PCPS4 | 0.060 | 0.010 | 0.070 | −0.131 | 0.110 | 0.253 |
| Asia | ||||||
| PCPS4 | −0.091 | 0.345 | 0.102 | −0.151 | −0.147 | −0.009 |
 and the cover of land use categories. The names in italic correspond to a specific genus inside the family.")
Correlation scatter plot for primate phylogenetic clades and land use categories showing correlation values with the PCPS in America, Madagascar and Asia. Each point represents a primate species and species are grouped within families represented by different symbols. Arrows indicate the direction of the correlation between the principal coordinates of phylogenetic structure (PCPS) and the cover of land use categories. The names in italic correspond to a specific genus inside the family.
We did not find any clear association between land use cover and distribution of phylogenetic clades in continental African primates. The fourth axis of phylogenetic composition of Madagascarian primates was significantly associated with the cover of wildlands (Table 1). All clades but Lemuridae were associated with areas with higher cover of wildlands (Fig. 1). In Asia, the cover of villages was significantly correlated to phylogenetic composition of primate clades in the axis four (Table 1), some Cercopithecidae species (all but Macaca species) being strongly associated with the higher cover of villages (Fig. 1).
DiscussionWe found that primate lineages respond differently to human land uses and their response differed among regions. Considering that regions vary greatly regarding their biogeographic history and the intensity of land transformation, and have distinct primate assemblages (Lehman and Fleagle, 2006; Ellis et al., 2010), it is not surprising that we did not find the same pattern across all regions. Knowledge on clades-specific threats across regions can provide insight needed to design effective clade-specific conservation plans (Corey, 2010; Loyola et al., 2014). This approach has been used in studies involving amphibians, to identify causes of population decline in Hylidae (Corey, 2010) and to quantify and map the efficiency of protected areas in protecting biodiversity from threats, e.g., climate change (Loyola et al., 2014).
The association between land use and phylogenetic primate composition was stronger in America than in the other regions (see Table 1). Considering the recent intense occupation of the American continent (approx. 100 years, Ellis et al., 2010), the extinction debt in the Neotropical primates may not have been paid yet (Kuussaari et al., 2009), resulting in greater overlap between the distribution of primate species and the distribution of humans. In particular, the Atelidae clade and some species from Pithecidae are more represented in areas with high cover of villages and rangelands. The advancement of colonization frontiers that result in high human population density and removal of natural vegetation for rangeland could be leading these clades to decline (Ellis and Ramankutty, 2008), impacting any species that depends on forests, including primates (Lehman and Fleagle, 2006). From the five Neotropical primate species included in the last list of the World's top 25 most endangered primates (Mittermeier et al., 2012), three are from the Atelidae family and one is from Pitheciidae. This information highlights the need of a special care with this region and especially with these two families, because without a specific conservation program for these groups and a conscious occupation of the landscape, their population decline can be irreversible.
The fact that we did not find any association between primate clades and land use in Africa does not mean that there is no conservation conflict between primates and human activities in this continent, as we know that deforestation, logging and hunting are serious issues for African primate conservation (Chapman and Peres, 2001; Mittermeier et al., 2012). There are three possible reasons for this result: firstly, the contact between human and non-human primate populations is very old on this continent, and the extant taxa would be a set resistant survivors from the past changes (Harcourt and Parks, 2003). Second, given that African primates use woodlands and wooded grasslands as well as forests (Chapman and Peres, 2001), they may be able to use open habitats created by humans. Lastly, the choice of constrain in the analyses to axes with at least 5% of variation could have limited the phylogenetic scale that we were able to evaluate. The phylogenetic axes with higher eigenvalues describe broader phylogenetic and, as the eigenvalues decrease, finer phylogenetic gradients are represented (Duarte et al., 2012). The coarse phylogenetic scale we analyzed may not be suitable for identifying the relationship between land use and threat in African primates, perhaps because human pressure occurs at finer phylogenetic scales, or even operates at species level.
Primate lineages from Madagascar were negatively related with wildland cover, which implies in higher cover of other and more populated land uses. Specially, the Lemuridae family, a clade that is highly threatened, was associated with areas with low cover of wildlands. Since the arrival of humans 2000 years ago, the island lost approximately 90% of its original forest cover, driving several species to extinction. Most of the forests in Madagascar were converted to agricultural areas based on the slash-and-burn techniques, and the remaining forests become increasingly fragmented (Lehman and Fleagle, 2006), decreasing the habitat suitability and increasing the hunting pressure on the primate populations. The extant species in Madagascar could be the resistant species that remained and their ranges are just a fraction of what they were once (Harcourt and Parks, 2003).
We found a strong association of village cover with phylogenetic structure in Asian primates, mainly related with Cercopithecidae clade. Asia landscape has a long history of agricultural activities (Lehman and Fleagle, 2006), leading several primate species to extinction (Zhang and Quan, 1981). Tropical Asia presents higher human population density and, consequently, higher cover of villages than any other tropical continent (Harcourt and Parks, 2003; Ellis and Ramankutty, 2008). The contact with high human densities exposes the primates not only to habitat degradation, but also to hunting pressure (Chapman and Peres, 2001). Asian primates are strongly threatened by hunting for several purposes, as for pet trade, meat and traditional medicine (Mittermeier et al., 2012). In China and India, Macaca species are forced to live at elevation over 3000m to escape from deforestation and species living near to farms are reputed to raid crops and end up hunted (Zhang and Quan, 1981; Srivastava, 2006). It shows that in Asia, and especially for the Cercopithecidae family, the direct contact with human population is a critical pathway to primate extinction.
Finally, primate clades are facing different land use pressure around the world, and it implies in the need of clade-specific conservation planning. In two continents (America and Asia) we found significant correlations between the distribution of clades and densely populated land use (village), specially affecting Atelidae and Cercopithecidae species. Knowing that the major threats to biodiversity result from human population growth, and that human population will keep growing, the primate clades that are now facing more densely populated lands should be prioritized, because the conservation conflicts tend to increase.
Here we showed a new way to use phylogenetic information in conservation assessments, far beyond the phylogenetic diversity. The inclusion of phylogenetic composition could benefit conservation studies by showing if a specific lineage is more threatened than another, and what is the main threat for each one. Attention should be paid to clades with higher susceptibly, because their extinction could lead not only to the loss of species, but also to a huge loss of evolutionary history and ecosystems services.
Conflicts of interestThe authors have no conflict of interest to declare.
F.T.B. and V.J.D. received CAPES Ph.D. scholarships. L.D.S.D. received a productivity scholarship awarded by the CNPq (304650/2012-9). RDL thanks CNPq (Grant Nos. 304703/2011-7, 479959/2013-7, 407094/2013-0), Rede CLIMA, Conservation International Brazil, and the O Boticário Group Foundation for the Protection of Nature (PROG_0008_2013) for funding his work. We thank Sandra M. Hartz, Fernando G. Becker, Valério D. Pillar, Catherine H. Graham and two anonymous reviewers for valuable suggestions on the manuscript. This research was funded by Conservation International Brazil.
The following are the supplementary data to this article:

