The Atlantic Forest is the biome most severely affected by deforestation in Brazil. Cabralea canjerana ssp. canjerana is a dioecious tree species that due to its wide distribution and reproductive biology traits can be considered a model for Atlantic Forest conservation studies. Using microsatellite loci, the genetic diversity and its structure were evaluated in natural subpopulations of this species located in forest fragments in Southern Minas Gerais State, Brazil. High levels of genetic diversity and a strong genetic structure among these subpopulations were found. Genotype assignment analyses suggested that the eight subpopulations can be grouped into two clusters, probably as a consequence of environmental landscape elements affecting gene flow patterns. High levels of spatial genetic structure were found among subpopulations, suggesting that pollen mediated gene flow and seed dispersal occur mainly within small distances.
Brazil is recognized as one of the most important repositories of worldwide biological diversity. The Atlantic Forest has high levels of biodiversity and endemism but it is the biome most severely affected by deforestation in Brazil. Habitat fragmentation alters the patterns of random genetic distribution within and between populations and changes the patterns of pollen and seed dispersal (Ghanzoul, 2005). This process has a direct influence on the genetic composition of populations and can produce negative genetic effects like inbreeding and genetic drift. Also, habitat fragmentation may decrease reproductive fitness, disease resistance and population adaptation to new environments increasing susceptibility to local extinction (Fahrig, 2003). These considerations explain the inclusion of genetic diversity levels by IUCN as an important parameter to be used in the characterization of endangered species (IUCN, 2000). The understanding of the spatial distribution of genetic diversity within and among populations is considered fundamental to the design of efficient conservation strategies (Caballero et al., 2010). The knowledge about the distribution patterns of genotypes in the landscape is extremely important for the conservation of natural resources because it helps to define in situ conservation strategies for endangered species.
Cabralea canjerana belongs to the family Meliaceae and comprises three subspecies. One of them, C. canjerana ssp. canjerana, is a dioecious tree species that occurs in Neotropical forests. The genus Cabralea has a range of distribution from Costa Rica to north of Argentina. In Brazil, C. canjerana spp. canjerana is abundant from southern Minas Gerais to the Rio Grande do Sul State, predominantly in mountain ranges and Ombrophilous Dense Forests, being absent only in the Araucaria Forest (Barreiros and Souza, 1986).
The aim of our study was to evaluate the levels and structure of genetic diversity in subpopulations of C. canjerana spp. canjerana from forest fragments of different sizes. To test the hypothesis that habitat fragmentation does affect the pattern of genetic diversity distribution, the genetic diversity of eight subpopulations of C. canjerana was evaluated at a small spatial scale in an area of approximately 10km2 in high-altitudes of Atlantic Forest (montane forest) fragments. The level of spatial genetic structure among these subpopulations was also evaluated to study the effects of habitat fragmentation on pollen and seed dispersion.
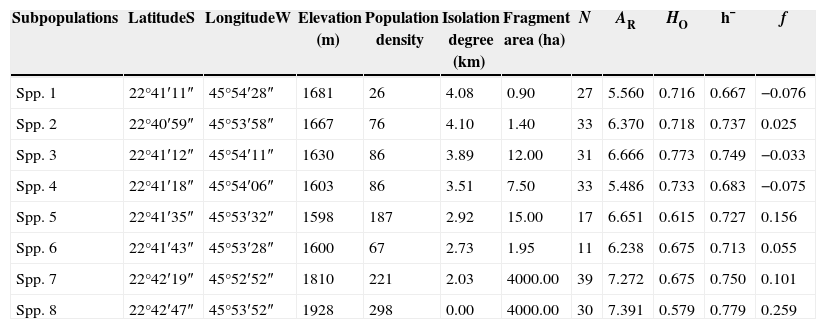
Materials and methodsSampled sites and molecular proceduresThe sampling sites are located in the Fernão Dias Environmental Protection Area (EPA), situated in a mountain range in southern Minas Gerais State, Brazil and occupy an area of 180,073ha. Samples were taken in six small fragments (area ≤15ha), of which two are also corridor fragments, and in two large fragments located in a continuous forest area, totaling eight sampled sites. Each sampled site was considered as a subpopulation (Table 1).
Geographical and genetic traits of C. canjerana subpopulations.
| Subpopulations | LatitudeS | LongitudeW | Elevation (m) | Population density | Isolation degree (km) | Fragment area (ha) | N | AR | HO | h¯ | f |
|---|---|---|---|---|---|---|---|---|---|---|---|
| Spp. 1 | 22°41′11″ | 45°54′28″ | 1681 | 26 | 4.08 | 0.90 | 27 | 5.560 | 0.716 | 0.667 | −0.076 |
| Spp. 2 | 22°40′59″ | 45°53′58″ | 1667 | 76 | 4.10 | 1.40 | 33 | 6.370 | 0.718 | 0.737 | 0.025 |
| Spp. 3 | 22°41′12″ | 45°54′11″ | 1630 | 86 | 3.89 | 12.00 | 31 | 6.666 | 0.773 | 0.749 | −0.033 |
| Spp. 4 | 22°41′18″ | 45°54′06″ | 1603 | 86 | 3.51 | 7.50 | 33 | 5.486 | 0.733 | 0.683 | −0.075 |
| Spp. 5 | 22°41′35″ | 45°53′32″ | 1598 | 187 | 2.92 | 15.00 | 17 | 6.651 | 0.615 | 0.727 | 0.156 |
| Spp. 6 | 22°41′43″ | 45°53′28″ | 1600 | 67 | 2.73 | 1.95 | 11 | 6.238 | 0.675 | 0.713 | 0.055 |
| Spp. 7 | 22°42′19″ | 45°52′52″ | 1810 | 221 | 2.03 | 4000.00 | 39 | 7.272 | 0.675 | 0.750 | 0.101 |
| Spp. 8 | 22°42′47″ | 45°53′52″ | 1928 | 298 | 0.00 | 4000.00 | 30 | 7.391 | 0.579 | 0.779 | 0.259 |
N=number of sampled individuals; AR=average allelic richness; HO=observed heterozygosity; h¯ =Nei's gene diversity; f=intrapopulation fixation index. The isolation degree is the distance (km) between all subpopulations and the subpopulation 8, taken as reference. Population density refers to the number of adult C. canjerana trees per hectare.
The Atlantic Forest was continuous in the study area until 1910, when human activity increased its footprint in the landscape. Intense and inappropriate logging along the past 60 years has produced severe habitat fragmentation. The deforestation became more intense after 1950, due to timber exploitation. These fragments decreased in size until 1985, when timber exploitation and the expansion of agriculture became less intense in the area. Currently, several fragments are well conserved, but others are still subject to selective logging and cattle grazing (Aguari, 2001).
Leaves of C. canjerana adult plants were collected randomly in the eight sampled sites. On average, 28 individuals were sampled from each subpopulation, totaling 221 individuals. Genotyping was carried out for six microsatellite loci described by Pereira et al. (2011).
Statistical analysesAllelic richness and unbiased expected heterozygosity (HE) (Nei, 1973) were estimated for each subpopulation. The parameters intrapopulation fixation index (f), overall inbreeding coefficient (F) and the measure of genetic structure among subpopulations (θ) were estimated according to Weir and Cockerham (1984). These parameters are analogous to Wright's F-statistics, FIS, FIT and FST, respectively. These estimates were also produced using FSTAT 2.9.3.2 (Goudet, 2002) software. Slatkin's RST genetic structure parameter was estimated using RST-calc (Goodman, 1997). Recent population bottleneck was evaluated for each subpopulation using Luikart and Cornuet (1998) empirical test available in Bottleneck software (Cornuet and Luikart, 1996). The presence of null allele frequencies was checked for each loci with 104 interactions in Gibbs sampling as implemented in INEst software (Chybicki and Burczyk, 2009).
To identify the number of clusters that best explained the genetic structure of the data set, an analysis was performed using Structure 2.3.3 (Falush et al., 2003), with default parameters. K values ranging from 1 to 10 were evaluated using 20 independent runs for each K and 106 MCMC steps, assuming a burn-in period of 50,000 steps. The suggested K values were evaluated using the ΔK statistic developed by Evanno et al. (2005). The level of genetic structure among the K clusters suggested by this analysis was also estimated.
The level of spatial genetic structure among the eight subpopulations was evaluated by the Mantel test with 104 permutations using pairwise RST values and the Euclidean geographical distances matrix. The geographical distances matrix was calculated using geographical coordinates data in UTM. Geographical distance matrix, Mantel test and dispersion plots were made in R software (R Core Team, 2013).
ResultsOne hundred forty seven alleles were found in the eight C. canjerana subpopulations for the six loci evaluated, an average of 24.5 alleles per loci. The average genetic diversity in the eight subpopulations was high (h¯=0.725), as was the average allelic richness (AR=6.454). Subpopulations 7 and 8 showed the highest levels of genetic diversity and allelic richness (Table 1). No bottleneck effect was detected in the eight subpopulations, except for subpopulation 2, in which an excess of heterozygosity was found according to the Wilcoxon test (p=0.015). The frequency of null alleles for each locus was very low.
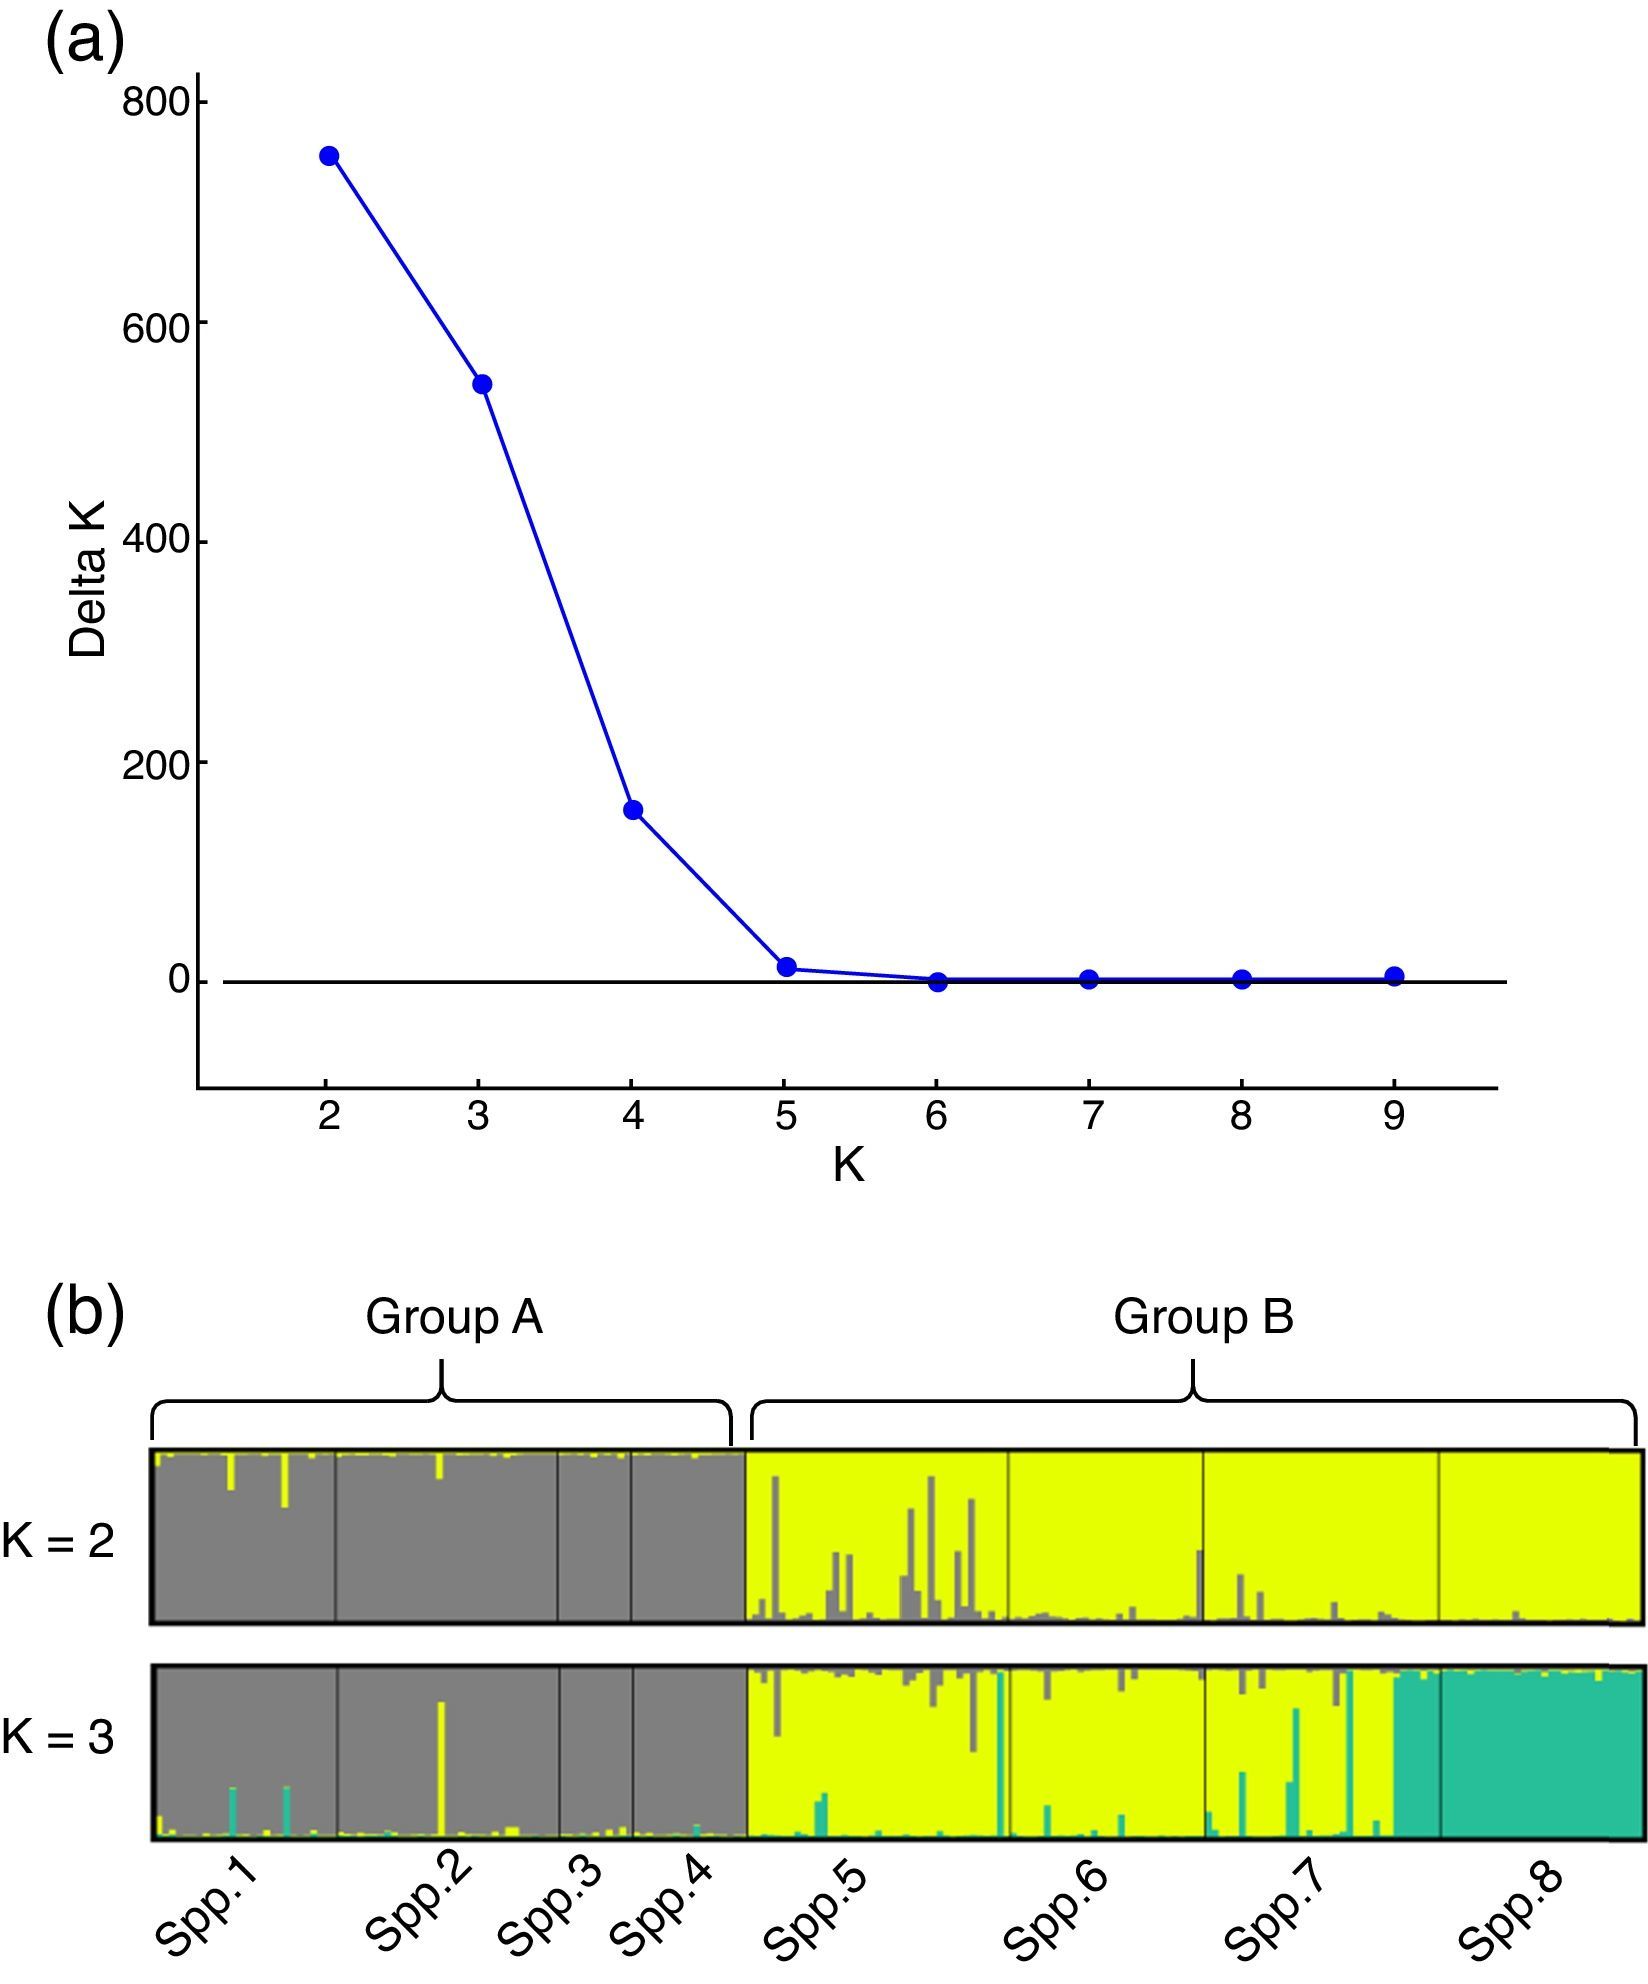
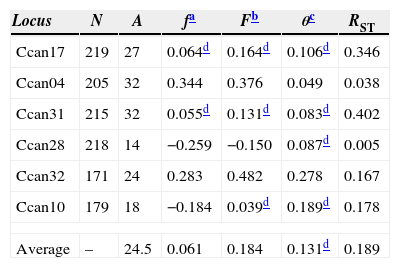
The genetic structure parameters estimates were f=0.061 [CI95%=−0.174 to 0.278] and θ=0.131 [CI95%=0.066–0.222] showing a low level of within subpopulation inbreeding and a moderate genetic differentiation among subpopulations (Table 2). The θ estimate reveals that 0.869 of the total genetic diversity is within subpopulations. The RST=0.198 (p<0.01) corroborates the evidence of a moderate genetic structure among all subpopulations. This pattern of genetic structure is typical of outcrossing plants species (Loveless and Hamrick, 1984). The assignment analysis showed that the eight subpopulations were structured into two clusters (Group A and Group B) according to the Evanno et al. (2005) criteria (Fig. 1). A high ΔK value was also found for K=3. This third group refers mainly to individuals from subpopulation 8 and can be regarded as a subdivision of Group B.
Genetic structure parameters estimates obtained for six microsatellite loci, for eight C. canjerana subpopulations.
| Locus | N | A | fa | Fb | θc | RST |
|---|---|---|---|---|---|---|
| Ccan17 | 219 | 27 | 0.064d | 0.164d | 0.106d | 0.346 |
| Ccan04 | 205 | 32 | 0.344 | 0.376 | 0.049 | 0.038 |
| Ccan31 | 215 | 32 | 0.055d | 0.131d | 0.083d | 0.402 |
| Ccan28 | 218 | 14 | −0.259 | −0.150 | 0.087d | 0.005 |
| Ccan32 | 171 | 24 | 0.283 | 0.482 | 0.278 | 0.167 |
| Ccan10 | 179 | 18 | −0.184 | 0.039d | 0.189d | 0.178 |
| Average | – | 24.5 | 0.061 | 0.184 | 0.131d | 0.189 |
 Evanno et al. (2005) ΔK statistic. (b) Bar plot with assignment probabilities of all C. canjerana individuals to the inferred clusters (K=2 and K=3).")
Genetic structure analysis results obtained by the Structure software. (a) Evanno et al. (2005) ΔK statistic. (b) Bar plot with assignment probabilities of all C. canjerana individuals to the inferred clusters (K=2 and K=3).
The genetic structure analysis including only the four subpopulations of Group A showed a low but significant genetic structure (θ=0.029 [CI95%=0.017–0.041]) and high genetic diversity (h¯=0.712). The analysis of Group B showed a moderate and significant genetic structure (θ=0.074 [CI95%=0.04–0.118]) and a genetic diversity (h¯=0.755) higher than that of Group A. The estimated overall apparent gene flow among all subpopulations was 1.65 migrant individuals per generation. The apparent gene flow rates within Group A, Group B and between these groups were estimated at 8.370, 2.875 and 1.548 migrant individuals per generation, respectively.
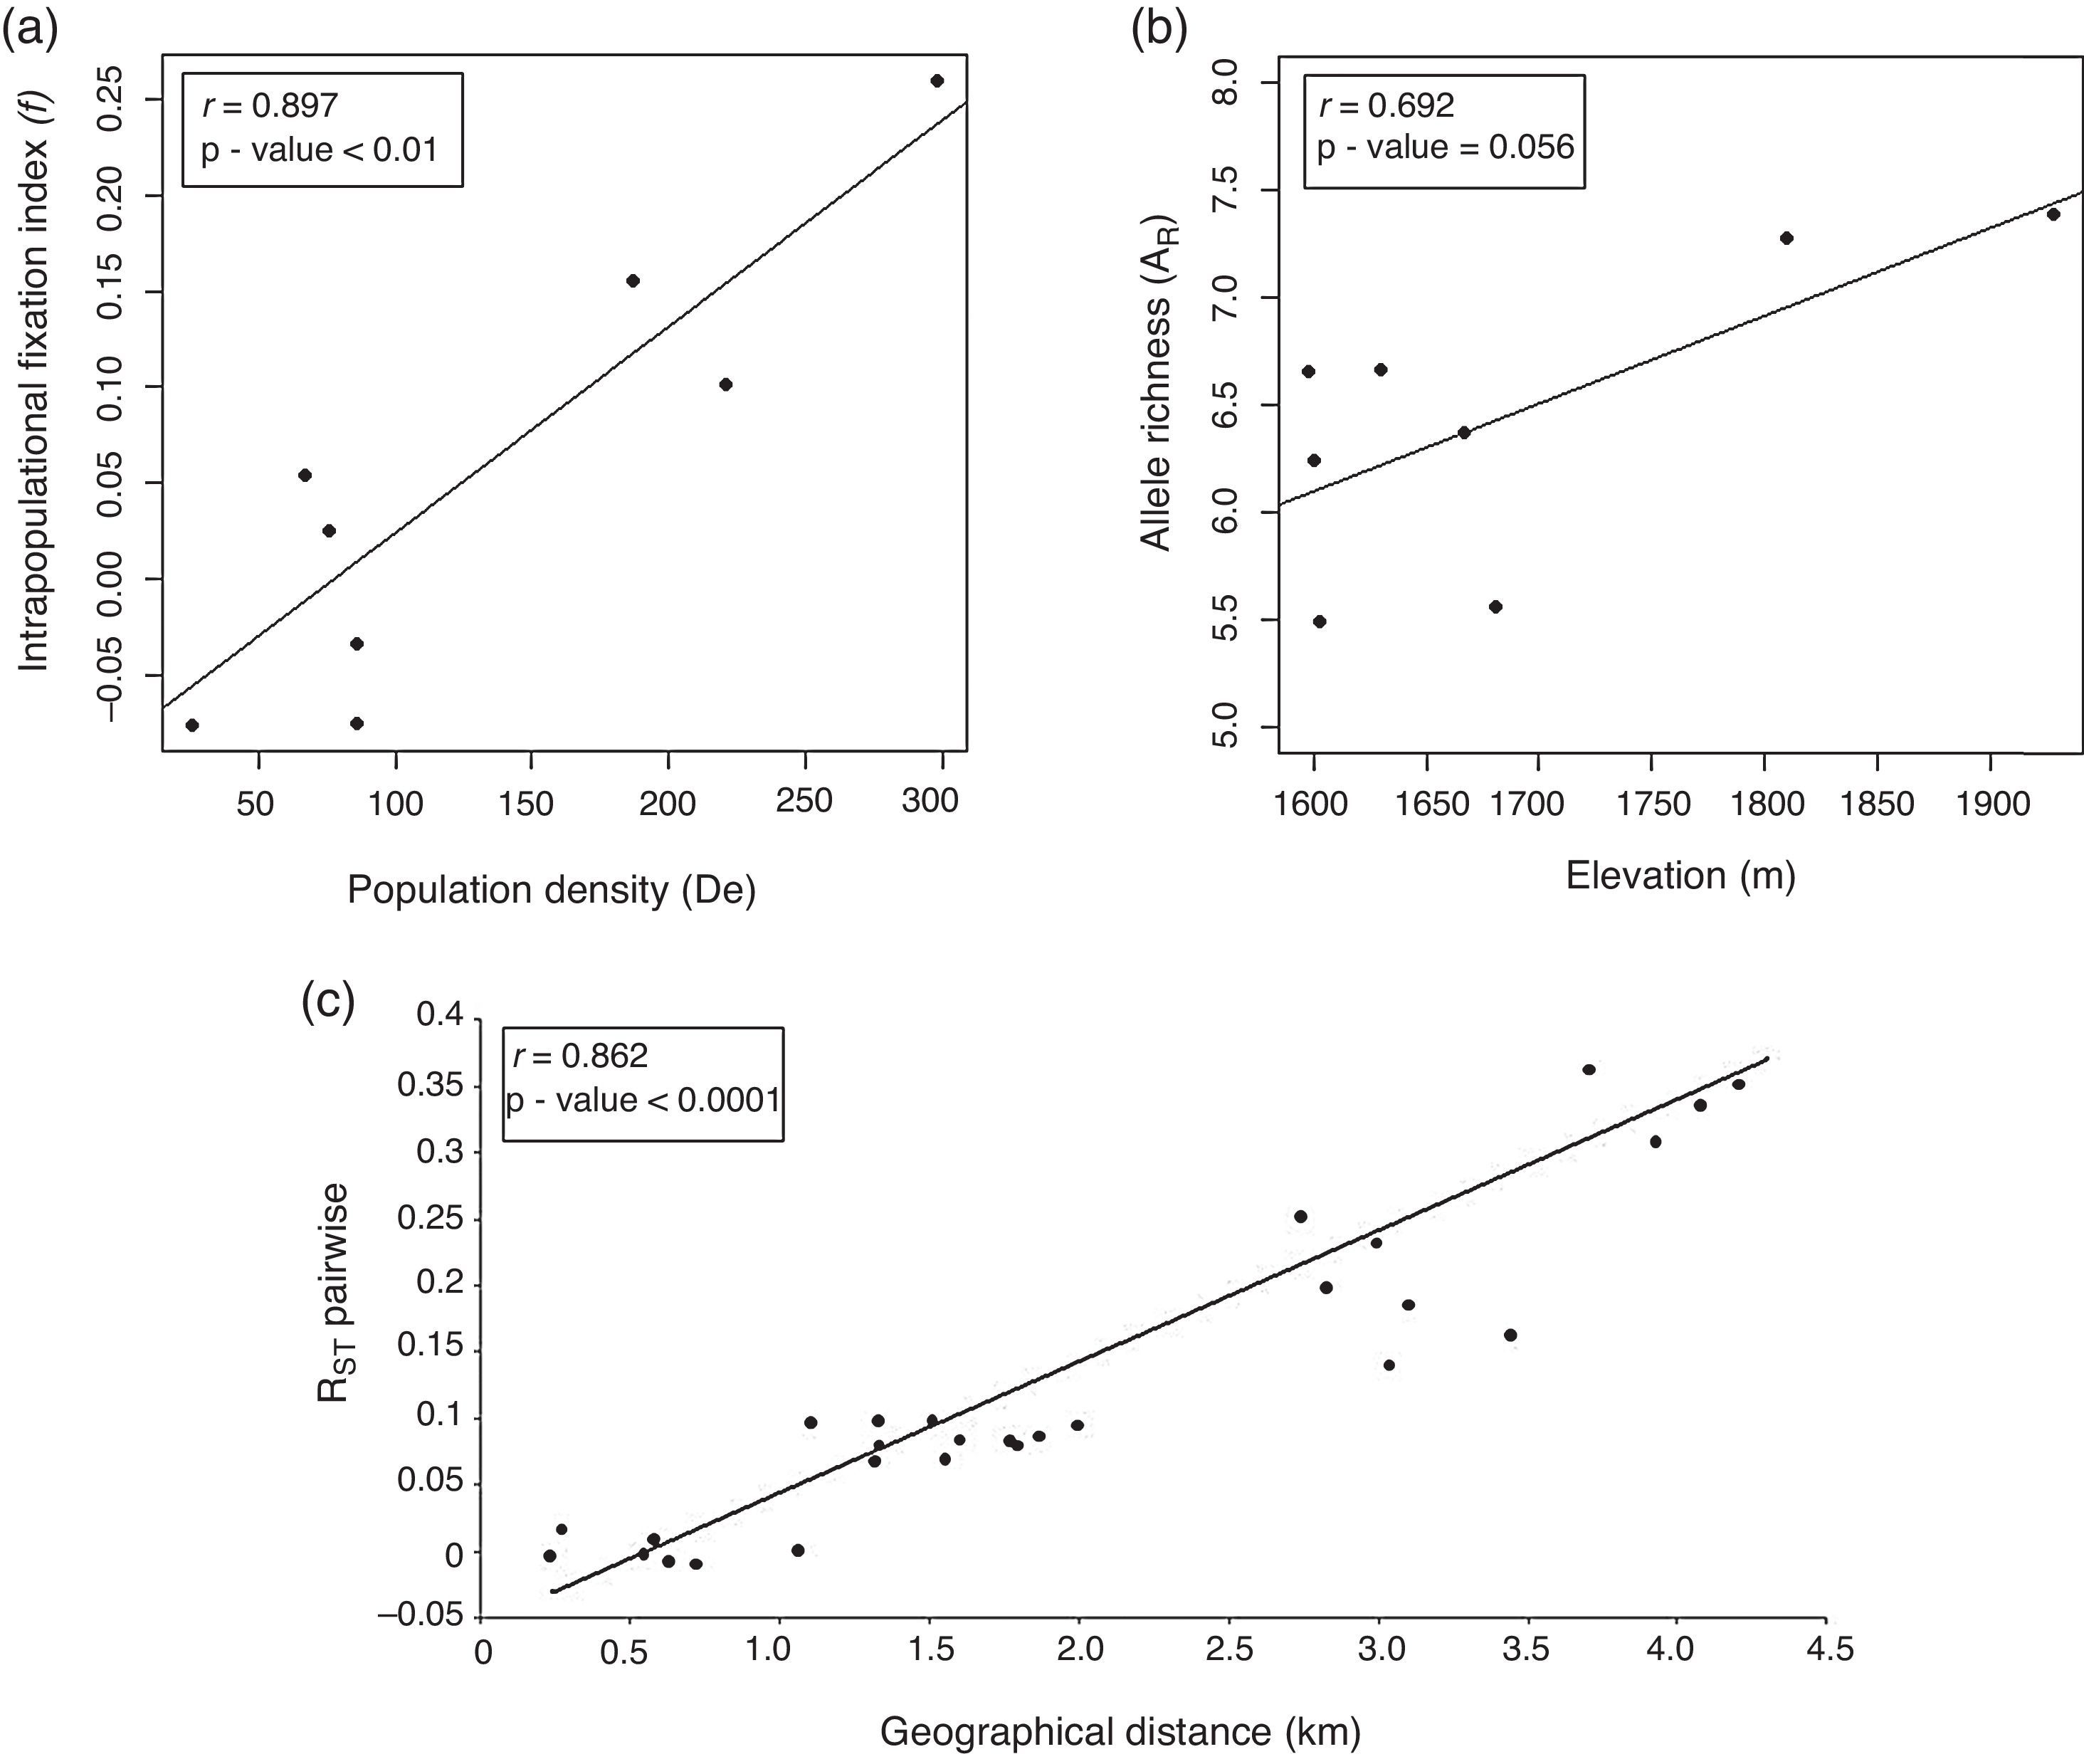
The Pearson's correlation coefficient between the subpopulations pairwise RST values and geographical distances was high (r=0.836) and significant (p<0.0001). These results suggest that the pattern of genetic divergence among subpopulations is structured in the geographical landscape due to isolation by distance (Fig. 2).
DiscussionLevel and distribution of genetic diversity in the landscape Population density and intrapopulation fixation index (f), (b) Elevation (m) and Allelic richness, and (c) Geographical distances (km) among eight C. canjerana subpopulations and RST pairwise values.")
C. canjerana subpopulations in the Fernão Dias EPA have a high level of genetic diversity. The genetic diversity estimates are in agreement with those found by Nybom (2004) in different plant tree species and are greater than those found for endemic species (Kang et al., 2008; Furches et al., 2009). The genetic diversity levels detected in Group A subpopulations were lower than those found in Group B, suggesting an effect of altitude (Fig. 2a) and that subpopulations from Group A have already suffered the effects of forest fragmentation. The intrapopulation fixation index estimates were strongly correlated to subpopulation densities (Fig. 2b). Interestingly, significant estimates of f were found in subpopulations 7 and 8 from a continuous forest area. Since C. canjerana is a dioecious species, this is probably a result of biparental inbreeding as a consequence of the spatial genetic structure within each subpopulation.
The estimate of θ=0.131 indicates a moderate level of genetic differentiation among the subpopulations. However, due to the small-scale geographical distribution of these subpopulations, the detected genetic structure can be considered strong. The similarity between the θ and RST estimates (Table 2) suggests that genetic drift is the major force shaping the genetic structure and that the dispersive effect of mutation is still of minor importance. The recent fragmentation scenario can explain the high levels of genetic diversity retained by the fragments. Franceschinelli et al. (2007), working in the same area with young plants of Myrciaria floribunda, a common Brazilian Atlantic Forest tree, also found high levels of genetic diversity.
Subpopulations from Group B are located at higher altitudes than those from Group A. The genetic differentiation within Group A was low, most likely because these subpopulations are very close to each other, favoring gene flow among them. In contrast, the genetic structure found in Group B can be related to the geographical distance and variation in altitude among these subpopulations. Although the apparent rate of gene flow in Group B was low, the genetic diversity measure in this group was high, most likely because subpopulations 7 and 8 are located in higher and better-preserved forest fragments.
The genetic structure between the two groups was high (θ=0.139), suggesting a low rate of gene flow between the subpopulations belonging to different groups (Nm=1.584). Our results suggest that the gene flow among subpopulations is affected by distance (Fig. 2c) and the landscape of the study area. These two groups are separated by a deforested valley, which explains the higher apparent levels of gene flow within each group than between them. Our results also support the hypothesis of an additional genetic isolation between these two groups beyond that expected by isolation by distance. The presence of a deforested valley separating the two groups is probably limiting the agents of seed and pollen dispersal. Primarily birds, bats and small mammals perform seed dispersal in C. canjerana and there is evidence that pollen dispersal is performed exclusively by small moths (Pizo & Oliveira, 1998). The pattern of gene flow found may reflect the dispersal behavior of these animals.
Implications to conservationTwo environmental scenarios clearly describe these eight C. canjerana subpopulations. The first scenario includes subpopulations located at lower altitudes with little landscape variation. These subpopulations are in the most severely degraded forest fragments and show reduced levels of genetic diversity. For this reason, these subpopulations deserve substantial attention by conservation programs. The second scenario includes two subpopulations located in a preserved continuous area at higher altitudes. These subpopulations are located in areas with less logging activity and maintain high levels of plant density and genetic diversity. Gene flow is still important evolutionary force acting on these subpopulations, and their survival depends on the preservation of the Fernão Dias EPA. These scenarios suggest that the high altitude subpopulations must be considered priority areas for conservation policy since they still retain the higher levels of genetic diversity. Once these areas are protected, conservation efforts that improve the gene flow mediated by pollen and seed dispersal must be stimulated, mainly on direction of subpopulations in small fragments.
Conflicts of interestThe authors declare no conflicts of interest.

