
Geographical patterns of genetic variation and population structure and their relationship with habitat loss and fragmentation have been investigated at distinct scales and extents using spatially explicit statistics. Here, we analyzed population genetic structure of Dipteryx alata (Fabaceae; the “baru” tree), an economically important tree widely distributed in Central Brazil that is endemic to the “Cerrado” (savanna) biome, relating population genetic divergence with broad-scale landscape patterns. Genetic divergence among 25 populations, estimated based on eight microsatellite loci for a total of 644 individuals, was correlated with landscape features using several forms of Mantel tests (standard Mantel correlations, Mantel correlograms, partial correlations, and multiple regression). Patterns of genetic divergence are significantly correlated with human-driven landscape features of habitat loss and fragmentation, after taking into account isolation-by-distance and historical effects of range expansion after the last glacial maximum. Our findings present important implications for the conservation of this species, because interruption of gene flow by habitat loss and fragmentation jeopardize the persistence of population in the medium- and long term due to disruption of demographic patterns, increased endogamy, and recruitment problems.
© 2014 Associação Brasileira de Ciência Ecológica e Conservação. Published by Elsevier Editora Ltda
Geographical patterns of genetic variation and population structure have been investigated at distinct scales and extents using spatially explicit statistics, in different research programs, ranging from the analysis of fine-scale population genetic structure up to broad-scale phylogeographical patterns (see Epperson 2003; Guillot et al. 2009; Diniz-Filho & Bini 2012; Wagner & Fortin 2013 for overviews). In all cases, spatial analyses allow for the inference of ecological and evolutionary mechanisms underlying the patterns and, at the same time, may be informative in respect to helping to establish effective strategies for biodiversity conservation within species (e.g., Diniz-Filho & Telles 2002; Escudero et al. 2003; Diniz-Filho et al. 2012a).
At more local and regional scales, several studies have focused on inferring processes underlying population structure related to spatial constraints on dispersal and gene flow (Epperson 2003). Moreover, it is possible to relate these dispersal processes to landscape characteristics, including natural features and human-induced modifications related to habitat loss and fragmentation, as proposed by the new research program in landscape genetics (Manel et al. 2003; Manel & Holderegger 2013).
The Cerrado is one of the world’s conservation hotspots, mainly due to a high level of endemism for plants, adapted to the long dry season, including several tree species whose fruits have commercial importance for local economies. Most of them may be considered endangered due to habitat loss and climate changes (e.g., Nabout et al. 2012). One of these economically important Cerrado species is Dipteryx alata Vogel (Fabaceae), popularly known as the “baru” tree, a widely distributed large tree species endemic to the biome, usually restricted to seasonal savannas habitats and growing in eutrophic and drained soils (“cerradão”). The species is hermaphroditic, and pollination is mainly performed by large- and medium-sized bees. Seeds have a very woody endocarp, with edible nuts that are eaten and dispersed by mammals, such as bats and monkeys, and are a source of raw material for small- and middle-sized food industries, playing an important role in the local economy of Central Brazil.
Previous analyses with D. alata revealed spatial patterns in genetic variation both at local and regional scales (Collevatti et al. 2010, 2013; Diniz-Filho et al. 2012b) and that, at least in part, this structure may be related to human occupation and habitat fragmentation in the Cerrado (Soares et al. 2008). Spatial autocorrelation analyses (Collevatti et al. 2010) showed the spatial genetic structure at local scales, as expected by considering the ecological and life history traits of the species. Our current knowledge of broad-scale genetic diversity and population structure in D. alata shows that the species possess a strong spatial structure in genetic differentiation, following an IBD-like pattern coupled with range expansion after glacial maximum for distinct loci (Diniz-Filho et al. 2012b).
Here, we analyzed the broad-scale genetic population structure of D. alata, associating patterns of variation with landscape features, using an explicit landscape genetics framework (the "link approach", as recently defined by Wagner & Fortin (2013). Our goal was to investigate, in more detail, how broad-scale patterns of population genetic divergence due to range expansion and isolation-by-distance in deep time are disrupted by recent constraints to gene flow caused by intense human occupation of the Cerrado biome.
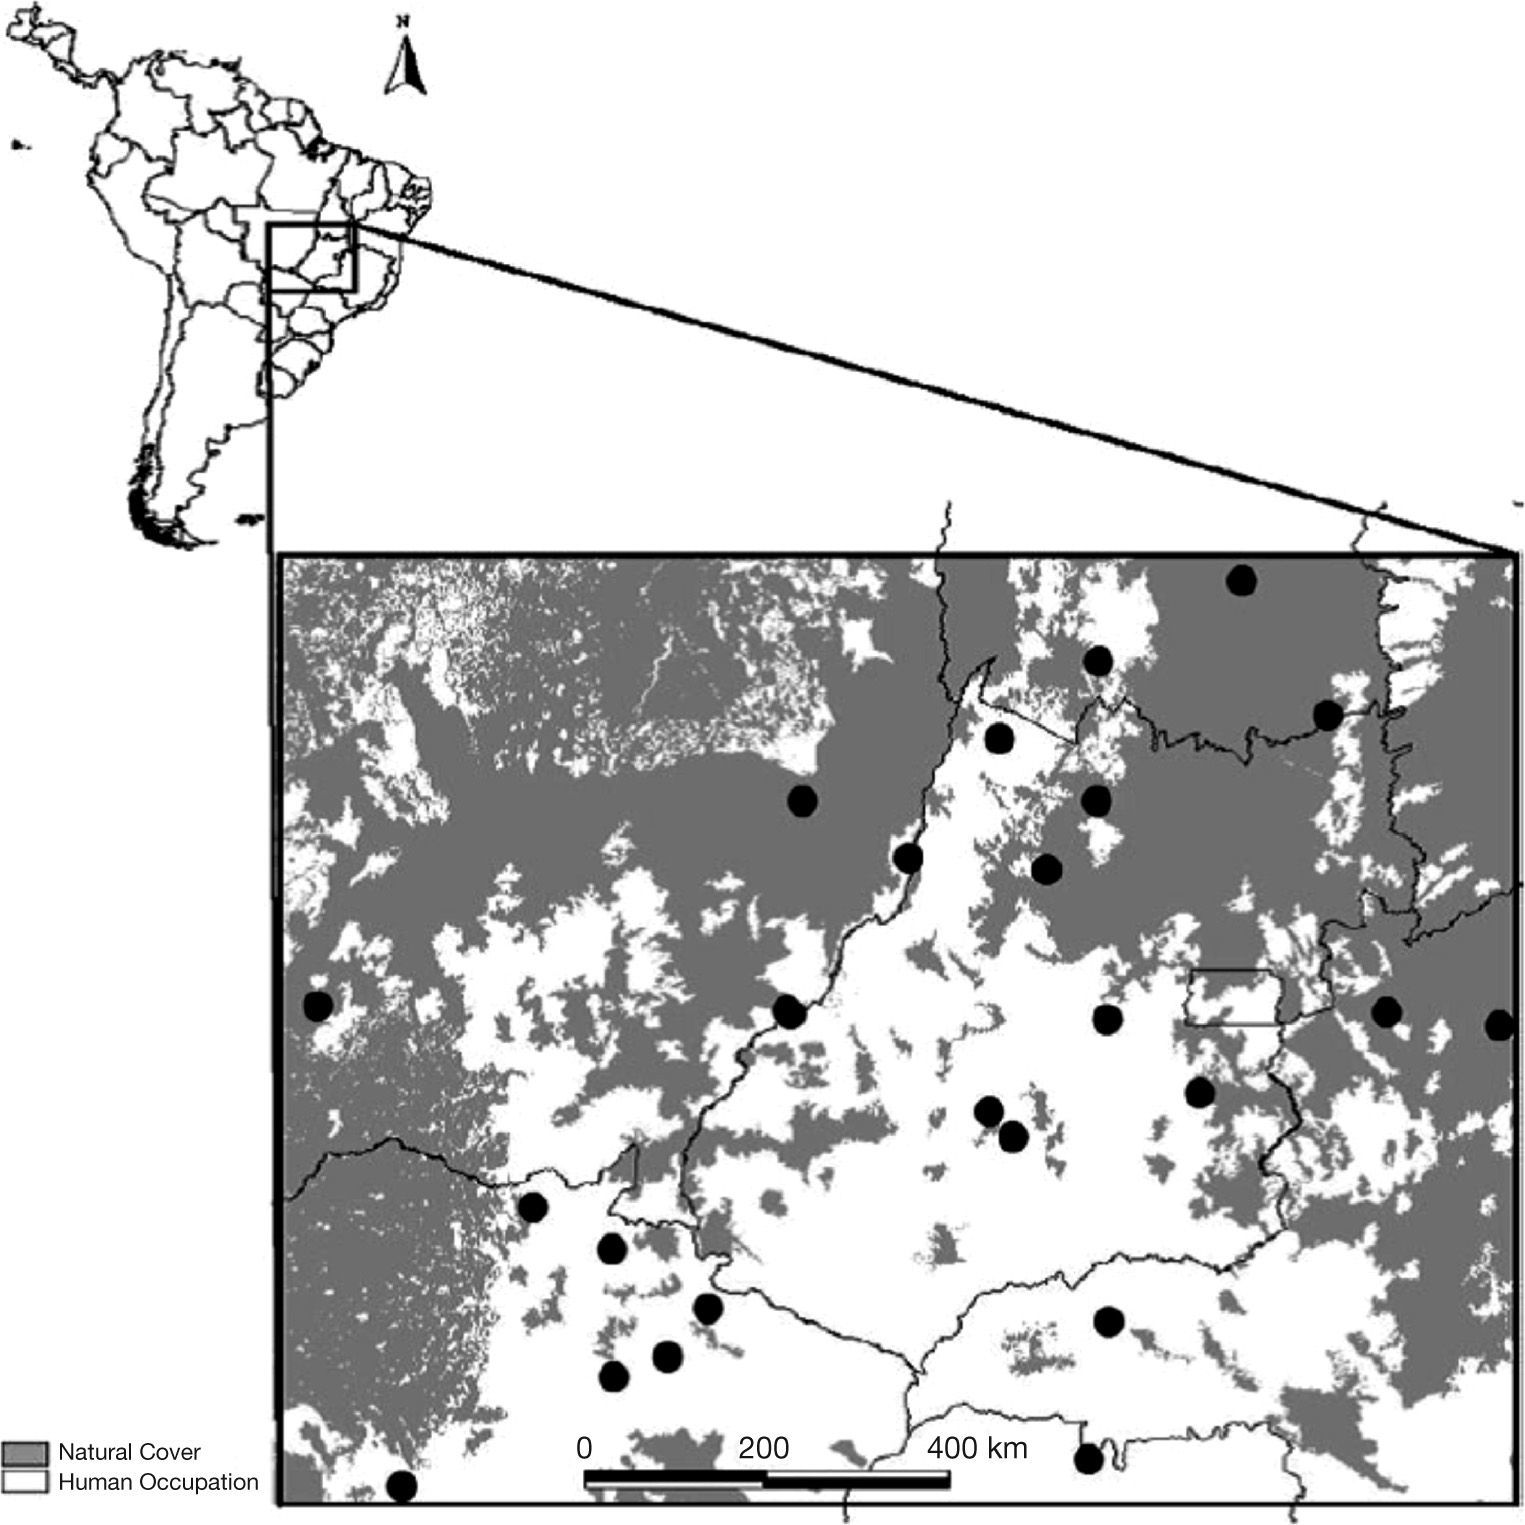
Materials and methodsGenetic dataWe estimated genetic variation for a total of 644 individuals sampled in 25 localities (populations hereafter) in the Cerrado region, with sample sizes varying from 13 to 32, at distinct points covering most of the range of D. alata (Fig. 1). Individuals were genotyped using eight microsatellite loci, following Soares et al. (2012). The variation in these eight loci was used to estimate pairwise allelic divergence (q) obtained from an analysis of variance of allele frequencies, among all populations and for pairwise comparisons (see Holsinger & Weir 2009). These values of q were transformed into Slatkin's linearized form (FST/[1- FST]) to improve linearity in the relationships and allow a better link with theoretical expectations. For simplicity, these values will hereafter be referred to only as FST.
Landscape data and metrics for D. alata in the analyzed Brazilian Cerrado. Dark regions indicate remnants of natural vegetation in the region.")
Land use data was obtained from the vegetation cover maps of the Brazilian biomes in the 1:250.000 spatial scale, by visual interpretation of compositions of bands three, four, and five of Landsat 7 ETM+images from the year 2002 (see www.mma.gov.br). We used the basic classification that differentiated natural vegetation (forests, savannas, and natural grasslands) from anthropic land cover classes (including agriculture, pasture lands, urban, and mining areas). The polygons were converted into a raster image with resolution of approximately 100m (0.001°).
We then created lines connecting all pairs of populations and, around these lines, we created "corridors" with variable widths. However, fragmentation metrics across widths were highly correlated (i.e., r>0.90), so results were presented only for the 10.0km corridor width. We considered each of the corridors as a landscape connecting pairs of populations and quantified landscape metrics of the natural vegetation for each of these landscapes, using Fragstats 4.1 (McGarigal et al. 2002), by means of the following commonly used landscape metrics (Metzger 2003; Table 1). Each of these metrics allowed for calculating a pairwise matrix that could be spatially analyzed and compared with the genetic divergence matrix.
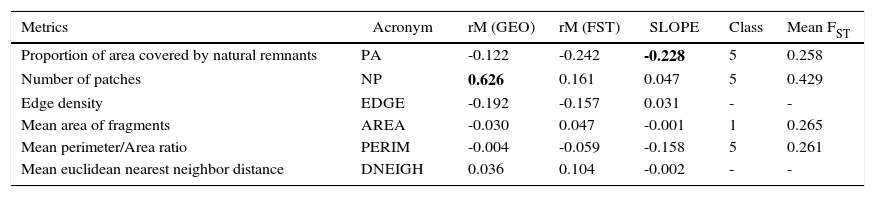
Spatial patterns in landscape metrics (GEO) and their correlation (rM) with genetic differentiation (linearized FST) among 25 populations measured by matrix correlation Mantel test). SLOPE refers to the partial standardized slope of each metric of FST, keeping constant geographical distances. Class refers to the corrlogram class in which a significant effect of FST was observed (classes of landscape metrics values range from 1 (smallest value) to 5 (largest values). Mean FST, mean value in the significant class (compared with the mean overall FST equal to 0.367). In all these cases, Mantel tests were performed using 5000 random permutations.
| Metrics | Acronym | rM (GEO) | rM (FST) | SLOPE | Class | Mean FST |
|---|---|---|---|---|---|---|
| Proportion of area covered by natural remnants | PA | -0.122 | -0.242 | -0.228 | 5 | 0.258 |
| Number of patches | NP | 0.626 | 0.161 | 0.047 | 5 | 0.429 |
| Edge density | EDGE | -0.192 | -0.157 | 0.031 | - | - |
| Mean area of fragments | AREA | -0.030 | 0.047 | -0.001 | 1 | 0.265 |
| Mean perimeter/Area ratio | PERIM | -0.004 | -0.059 | -0.158 | 5 | 0.261 |
| Mean euclidean nearest neighbor distance | DNEIGH | 0.036 | 0.104 | -0.002 | - | - |
Patterns in genetic distance and correlations with landscape data were analyzed using several forms of the Mantel test of matrix correspondence (see Diniz-Filho et al. 2013 for a review). These include simple Mantel tests correlating two matrices, Mantel correlograms describing patterns across distinct classes of connectivities, and multiple regression of distance matrices using genetic distances as a response matrix and geographical distances and habitat fragmentation matrices as explanatory matrices. A different form of correlogram (i.e., not a spatial correlogram) was also obtained by dividing landscape explanatory matrices into classes (rather than geographical distances). This correlogram allows for defining, for example, how genetic differentiation is related to different classes of habitat fragmentation (expressed as different matrix model linking populations separated by landscape with distinct classes of habitat fragmentation).
ResultsThe overall FST when comparing all populations was equal to 0.267, but values ranged from 0.050 to 0.565 when comparing distinct pairs of populations. The pairwise genetic divergence based on linearized FST values was positively correlated with geographical distances (r=0.487; P<0.01; Fig 2a), with the correlogram revealing a more clinal pattern of genetic variation in which close populations are similar up to 1,000km, and stabilize after this class (Fig. 2b). The metrics of landscape characteristics, on the other hand, were poorly geographically structured (Table 1), indicating that patterns of habitat fragmentation were not evenly distributed in the biome.
 and correlogram for pairwise FST for 25 populations of D. alata in the Brazilian Cerrado (B). Mantel coefficients surrounded by a circle are significant at p<0.01.")
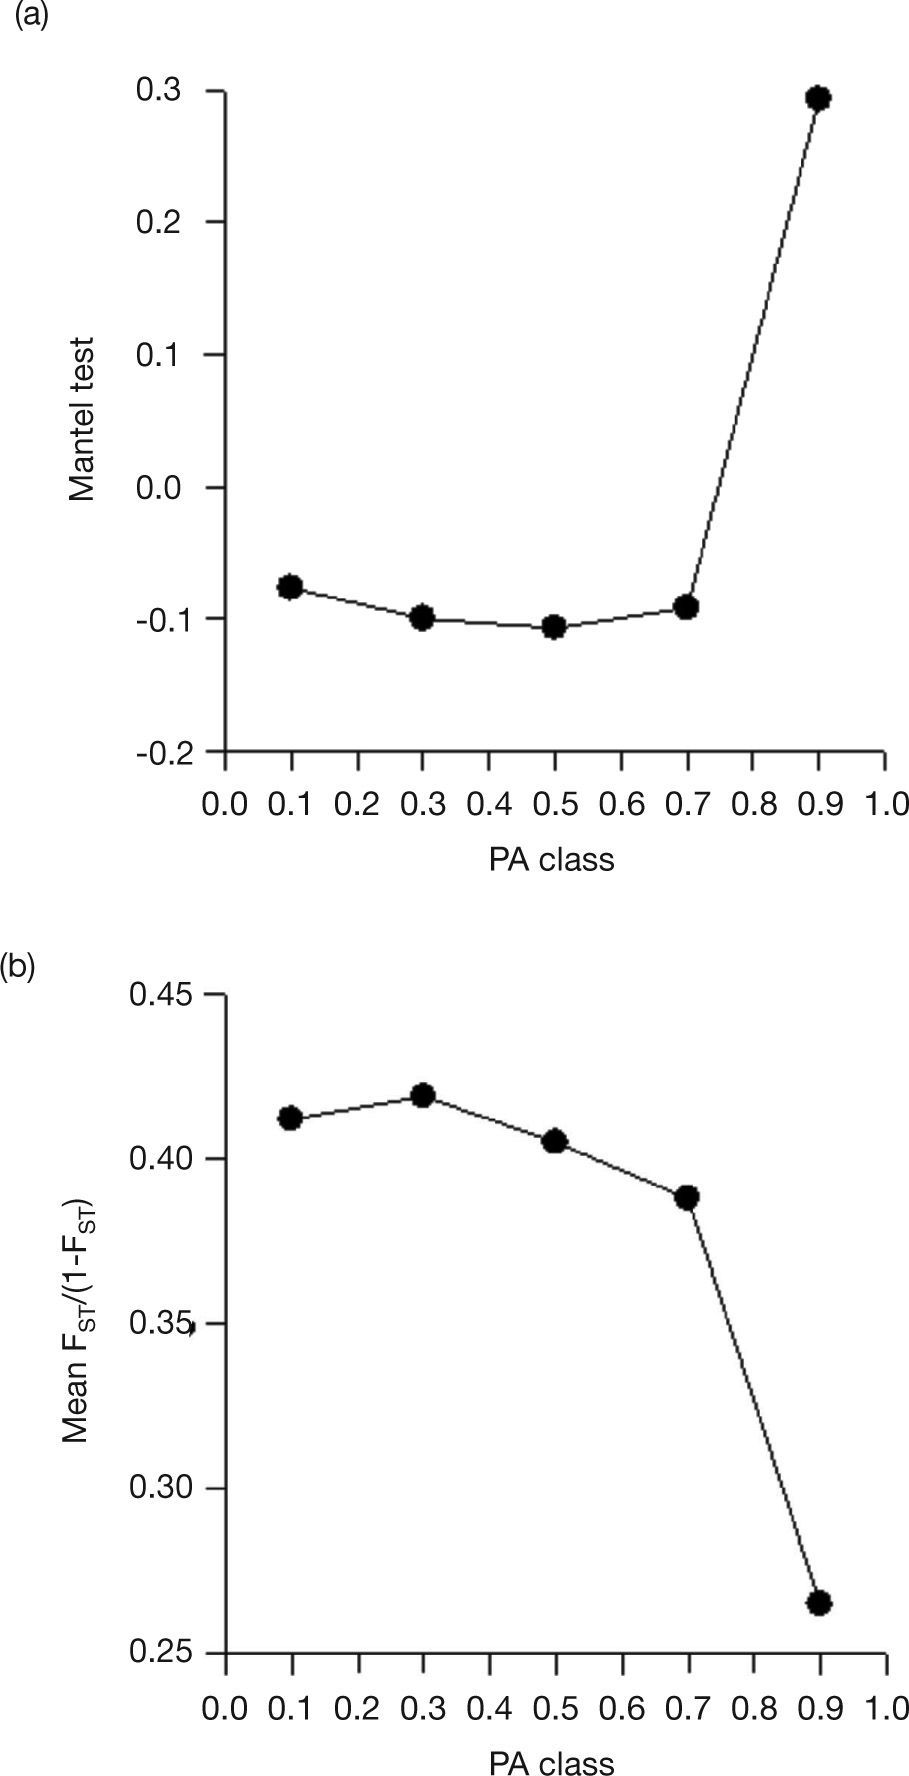
Mantel tests did not show significant spatial patterns for landscape metrics, except for number of patches (NP; which is most likely due to geographical effects - see below). Also, there were no strong correlations between FST and the landscape matrices (Table 1). However, generating a correlogram of FST against different classes of these metrics showed patterns for proportion of area covered by natural remnants (PA), NP, mean area of fragments (AREA), and mean perimeter/area ratio (PERIM). For example, there was a significant (negative) matrix correlation when populations were separated by regions with a high proportion of remnants (the fifth distance class of the correlogram, with PA>80%; r=0.283; P=0.024) (Fig. 3A). To better interpret what this correlation means, it is noteworthy that the mean FST across all populations was equal to 0.365, but this mean gradually reduced when only populations connected with increasing proportions of habitat remnants were connected, achieving a mean of 0.266 when PA>80% (Fig. 3B).
 (A) and the mean FST along the connectivities (B). Notice that, in (A), the Mantel correlation is significant when populations separated by large proportion of natural remnants are compared and that, in such cases, the mean FST is smaller, as shown in (B). Mantel coefficients surrounded by a circle are significant at p<0.01.")
Mantel correlogram of FST as a function of different classes of the landscape metrics proportion of area covered by natural remnants (PA) (A) and the mean FST along the connectivities (B). Notice that, in (A), the Mantel correlation is significant when populations separated by large proportion of natural remnants are compared and that, in such cases, the mean FST is smaller, as shown in (B). Mantel coefficients surrounded by a circle are significant at p<0.01.
The patterns of FST against the correlogram of PA would be explained by the fact that close populations were also connected by similar habitat fragmentation patterns but, as shown in Table 1, that there were no spatial patterns in PA. Indeed, a more detailed analysis of mean FST along PA classes show some combined effects of geographic distance and habitat connection. The mean global value of FST (0.367) was reduced to 0.218 when populations separated by less than 250km were compared, reflecting the geographical patterns in FST (notice that the global value of 0.367 was reduced to 0.258 - a bit higher than 0.218 - when only populations separated by PA>80% were compared). The mean value of 0.218 was even further reduced to 0.190 when close populations in space were separated by PA>90%, revealing additional effects of habitat connection beyond geographical distances.
The multiple regression Mantel test revealed similar patterns to those observed with simple Mantel tests (Table 1), with high partial slopes only for geographical distances and for PA (but not for NP). The coefficient of determination R2 of geographical distances on FST, as previously reported, was equal to 24% (r=0.487), and the effect of all combined landscape metrics was equal to 19.4%. The overall model combining both effects explains 30.8% of the variation in genetic distances, so the unique contribution of landscape was equal to 6.8%, the unique contribution of geographic space was 11.4.0% and the overlap between landscape and distance was equal to 12.6% (mainly due to strong spatial patterns in NP, which actually explain difference between simple and multiple Mantel tests).
DiscussionOur analyses revealed significant patterns of genetic divergence in D. alata based on microsatellite data, as described in previous papers (Diniz-Filho et al. 2012b; Collevatti et al. 2013). However, the novel aspect of the analyses performed here is that, beyond microevolutionary processes that have been used to describe such patterns, there are already small (but statistically significant) effects of human occupation related to habitat loss and fragmentation. This is important, considering that human occupation in the Brazilian Cerrado is relatively recent, starting in the 17th and 18th centuries, but accelerating dramatically in the last 50 years (Klink & Machado 2005; see Telles et al. 2007; Soares et al. 2008).
Our analyses demonstrated that, out of the several metrics, the proportion of area covered by natural remnants (PA) is more related to genetic differentiation (i.e, creates more clear reduction in pairwise FST with higher Mantel correlation) and is the only fragmentation variable related to genetic divergence in a multiple regression model. PA, as used here, is an overall measure of the amount of remaining habitat area, regardless the structure and space-time dynamics of the fragmentation process. There is indeed a discussion about the differences between habitat loss and habitat fragmentation, and how these components affect different aspects of biodiversity (e.g. Fahrig 2003; Lindenmayer & Fischer, 2007). In the present study, we found that, for genetic differences between populations of D. alata, habitat loss, quantified by the percentage of the landscape covered by natural vegetation, appears to be mainly related to the amount of natural habitat remaining and less to habitat configuration, thus being slightly more related to overall loss than to habitat fragmentation. Of course, this may be simply because our analyses were conducted at a much broader spatial scale (extent) than the landscape scale, thus causing detailed aspects of habitat fragmentation affecting gene flow at shorter distances to not be detected and properly evaluated. Indeed, the amount of remaining natural habitat estimated as PA here is a metric that measures the overall processes in the landscape above other characteristics, such as spatial configuration of the remnants (e.g. Pardini et al., 2010). Thus, it is expected that, at these broad scales, this is the most important driver of genetic differentiation. Moreover, many landscape metrics do not respond linearly to the amount of habitat loss, which may have affected our results, as we had a wide range of PA in our landscapes. Due to the complexity of the relationships and spatial constraints among the metrics across the landscapes, the effect of the other habitat fragmentation metrics is more difficult to evaluate at the scales analyzed here.
In a more methodological ground, it is worthwhile to mention that our analyses were based on several forms of Mantel tests, despite several discussions regarding the validity of these statistics to detect patterns and infer processes (e.g., see Diniz-Filho et al. 2013 for an overview). Despite all these discussions, it is worthwhile to note that Borcard & Legendre (2012) demonstrated that Mantel correlograms do not suffer from the same pitfalls of the standard Mantel test. Indeed, we found that, despite the small explanation of bivariate Mantel correlations, patterns are more clearly detected using Mantel correlograms and relationships, which in turn are theoretically consistent with multiple and partial Mantel tests. We used correlograms not only to describe spatial patterns, but also to detect the non-linearity effects of landscape metrics into the genetic variation.
Thus, our analyses reveal that, despite the recent human occupation in Brazilian Cerrado and the long life-history cycles of this species, there are already significant effects of habitat fragmentation on D. alata populations. These findings present important implications for the conservation of the species, which is currently an economically important species in the Cerrado. Despite the fact that it is still relatively easy to find large (and old) trees of D. alata, interruption of gene flow by habitat loss and fragmentation, as detected here at broad scale, probably related to lack of dispersal and pollinators, jeopardizes the persistence of the population in the mediumand long term due to disruption of demographic patterns and problems in recruitment
Our research program integrating macroecology and molecular ecology of plants and the DTI fellowship to G.O. has been continuously supported by several grants and fellowships to the research network GENPAC (Geographical Genetics and Regional Planning for natural resources in the Brazilian Cerrado) from CNPq/MCT/CAPES (projects # 564717/2010-0 and 563624/2010-8) and by the "Núcleo de Excelência em Genética e Conservação de Espécies do Cerrado" - GECER (PRONEX/ FAPEG/CNPq CP 07-2009). Fieldwork has been supported by the Systema Naturae Consultoria Ambiental LTDA. Works by J.A.F.D.-F., M.P.C.T., T. N. S., and R.G.C. have been continuously supported by productivity fellowships from CNPq.
articles


- Home
- All contents
- Publish your article
- About the journal
- Metrics