
In the tenth Conference of Parties to the Convention on Biological Diversity (CBD) held in Nagoya in 2010, it was decided that 17% of terrestrial and 10% of marine areas should be protected globally by 2020. It was also stated that conservation decision-making should be based on sound science. Here, we review how recent scientific literature about spatial conservation prioritization analyses and macro-ecology corresponds to the information needs posed by the Aichi Biodiversity Target 11. A literature search was performed in Web of Science to identify potentially relevant research articles published in 2010-2012. Additionally, we searched all articles published since 2000 in five high-profile scientific journals. The studies were classified by extent and resolution, and we evaluated the type and breadth of data that was utilized (This information is included in a supplementary table to facilitate further research). Implementation of the Aichi Targets would best be supported by broad-extent, high-resolution, and data-rich studies that can directly support realistic decision-making about allocation of conservation efforts at sub-continental to global extents. When looking at all evaluation criteria simultaneously, we found little research that directly supports the analytical needs of the CBD. There are many narrow- extent, low-resolution, narrow-scope, or theoretically-aimed studies that are important in developing theory and local practices, but which are not adequate for guiding conservation management at a continental scale. Even national analyses are missing for many countries. Global-extent, high-resolution analyses using broad biodiversity and anthropogenic data are needed in order to inform decision making under the CBD resolutions.
© 2014 Associação Brasileira de Ciência Ecológica e Conservação. Published by Elsevier Editora Ltda.
One of the fundamental features of the 21st century anthropocene is the decline of biological diversity (Pereira et al. 2010; Steffen et al. 2011). It is considered a major environmental problem that could have serious consequences to human well-being in the near future (Barnosky et al.2012) . In response to growing concern about the future of biodiversity, the Convention on Biological Diversity (CBD) was formed in 1992 with an ambitious target of halting the loss of biodiversity. Today, the CBD is considered as a key document on the conservation and sustainable use of biodiversity, providing both restrictions and guidance. It is a legally binding treaty, ratified by more than 190 parties (CBD 2012).
Despite two decades of effort, it is evident that the CBD has not succeeded in its mission to stop the degradation of biodiversity (Butchart et al. 2010; Secretariat of the Convention on Biological Diversity 2010). In the tenth convention of the parties, held in 2010 in Nagoya, Japan, participating countries agreed upon a strategic plan for 2011-2020 that introduced new, more definite protection targets to facilitate conservation action. These so-called Aichi Targets consist of 20 individual targets divided across five thematic groups (CBD 2010). One of the most prominent objectives, stated in Target 11, is to protect 17% of the terrestrial and 10% of the marine areas worldwide (CBD 2010; Harrop 2011). In the meeting, it was also stated that conservation decision-making should be based on sound science (CBD 2010). In response, conservation scientists should develop research that would facilitate real-world conservation decision making across broad spatial extents.
In this article, we review how recent scientific literature on spatial conservation prioritization and macro-ecology correspond to the information needs posed by Aichi Target 11. Since different planning processes have different information needs (Ferrier & Wintle 2009), not all studies are equally relevant. In our view, implementation of the Aichi Targets would best be supported by broad-extent, high-resolution, and data-rich studies that can directly support conservation resource allocation at national to global scales. Unfortunately, it is a reasonable a priori expectation that such analyses would be rare both due to high data demands and computational limitations. Thus, we examine these three requirements.
The CBD suggests an “ecosystem approach” as a general framework to all conservation action, defined as “a strategy for management of land, water, and living resources that promotes conservation and sustainable use in an equitable way” (CBD 2000). It is a holistic approach that considers biodiversity in its widest meaning and places people at the center of management (Smith & Maltby 2003). In terms of information demands, it implies conservation prioritization analyses that are relevant for all of biodiversity, including species, ecosystems, and ecosystem processes, as well as accounting for human needs equitably. It is also emphasized in Aichi Target 11 that the global protected area network should be well connected, ecologically representative, and account for ecosystem services (CBD 2010).
The utility of spatial conservation prioritization in real- life decision-making is dependent on the size of the planning units. If the resolution of the spatial prioritization is much coarser than the resolution of actual decision-making, analyses cannot be directly utilized in planning (Ferrier & Wintle 2009). As nearly one-third of the world’s reserves are under 1km2 (Shriner et al. 2006), it is evident that most actual conservation decision-making is done at a high-resolution. Arponen et al. (2012) also found that overlap between priority areas identified at coarse resolutions differed significantly from priorities identified at high resolution, suggesting that prioritization should be performed at the highest possible resolution.
We emphasize that having a high planning resolution does not imply that conservation areas should be small. In fact, conservation areas should be large enough to support viable populations, but the effective planning of conservation nevertheless benefits from spatially detailed information (Arponen et al. 2012). Having coarse planning units, such as 20×20km grid cells, simply does not translate well into on-the- ground action. Importantly, when a fine planning resolution is used, accounting for connectivity and composition of the protected area network becomes increasingly important. If connectivity is not accounted for, planning may lead to small and isolated protected areas that might have less value in maintaining biodiversity (Newmark 1996).
The CBD identifies nations as the main actors in the implementation of the Aichi Targets. Each participating country is expected to develop a National Biodiversity Strategy and an Action Plan by 2015, describing how said targets should be achieved. Somewhat in contradiction, recent scientific studies have found that much more effective solutions could be reached by planning conservation at the continental/global level rather than locally (Soutullo & Gudynas 2006; Strange et al. 2006; Vazquez et al. 2008; Kark et al. 2009; Moilanen et al. 2013) . If decisions are made only at the local scale, a degree of redundancy and inefficiency is inevitable. For example, Moilanen et al. (2013) compared conservation priority-rankings produced with different levels of coordination across North and South America. They found that keeping area at a constant 17%, continentally coordinated conservation could produce up to 3.9 times the gains that could be expected with planning implemented separately by each country.
The establishment of an effective global conservation area network ideally requires feedback between global, national, and local levels of planning. National analyses have obvious importance, since decisions about conservation are ultimately made at the national level. Conversely, species and ecological processes don’t acknowledge human administrative borders, and each country has a broader continental/global context. National priorities are clearly influenced by continental/global considerations, as is evident for example in the prominence that global endangered species red lists (Rodrigues et al. 2006) have in international discussion. However, only localized action can include detailed information about conservation opportunities and social, economic, and political factors relevant for on-the-ground implementation of conservation (Knight and Cowling 2010; Soutullo et al. 2008). Thus, continental/global considerations set a context that should influence national and local conservation priorities. Therefore, understanding global conservation priorities is of relevance for the national and local implementation of conservation.
Areas of high global conservation priority have been identified by different criteria during the past decade, with the aim of guiding scarce conservation resources to regions where conservation measures would produce greatest benefits (Brooks et al. 2006; Murdoch et al. 2010). Even though these global priority schemes can be useful for the implementation of Aichi targets, moving from coarse global priorities to local scale planning is not a straightforward process (Soutullo et al. 2008). Most of the global priority schemes have been developed with scoring, decision tree, or threshold methods (Murdoch et al. 2010), which have been criticized for being too simplistic, coarse, lacking complementarity, and often lacking relevant information, for example, with regard to costs (Murdoch et al. 2010; Brooks et al. 2006; Mace et al. 2000). Nevertheless, improvements in availability of data and in the capabilities of spatial prioritization software are making comprehensive, broad-extent, and high-resolution conservation prioritization analyses more feasible (Arponen et al. 2012). Such analyses can be helpful in bridging the gap between relatively coarse and data poor global analyses and the needs of on-the-ground conservation planning. In this study, we examine recent scientific literature in terms of how well the operational requirements of high-quality spatial planning are satisfied.
MethodsLiterature searchesWe used the Thomson Reuters’ Web of Science (WOS) database to retrieve literature (accessed Jun. 19, 2013). Two searches were conducted, whose results were combined for analysis: the first, to identify publications that are directly relevant to spatial conservation decision-making (search topic=“systematic conservation planning” OR “reserve selection” OR “reserve design” OR “reserve network design” OR “conservation assessment” OR “spatial optimization” OR “spatial conservation prioritization”) and the second, to identify publications regarding important biodiversity areas (search topic=global AND biodiversity AND (“priority area” OR “priority areas” OR prioritization OR hotspot)). To identify the state-of-the-art, we concentrated on publications published during 2010-2012: these should be the ones most relevant for the decision-makers, as they utilize the latest methods and most up-to-date data of distributions of biodiversity features. Additionally, we used the same two search phrases to identify all articles published in five high-profile journals (Science, Nature, PNAS, PLOS-Biology, and Ecology letters) between 2000 and 2010: the motivation of this search was to control for potential bias in recent literature, by verifying that there were no slightly older studies in top journals that would have succeeded in developing data-rich, high resolution biodiversity analyses.
While these two searches would not identify all articles that could be informative for the design of broad-extent conservation area networks, they nevertheless provide a targeted overview across core fields of conservation science, including most recent publications, and publications in leading journals. NGOs and governmental agencies also produce grey- literature documents containing relevant information for conservation planning. We did not include such literature into the present analysis, as language questions and variable accessibility make it very difficult to a retrieve comprehensive set of these documents for review. It can be hypothesized, however, that the most substantial grey-literature analyses also lead to scientific publication due to the frequent involvement of scientists in the planning process.
Scoring of studiesWe focused on publications that directly indicate areas for conservation action and on publications that provide information about the distributions of biodiversity features. Such studies may be relevant for broad-extent spatial conservation decision-making. We scored the relevance of publications according to an interpretation of the information needs posed by Aichi Target 11 (Table 1). Studies with broad extent, high resolution, and comprehensive species, ecosystem, and other data were given highest scores. Studies were scored from 0 to 5 in each classification category, except for ‘other data’, where the range was 0 to 6, so that the maximum score for a single publication was 26. In pre-analysis, we excluded from further study all work with sub-national extent, average spatial resolution lower than 10,000km2 (larger than 100km×100km or 1°×1° grid cells), or with focus on a single or only a few species. In our interpretation, such studies are largely irrelevant for on-the-ground, broad extent, spatial conservation decision-making in response to the CBD.
Classification and scoring criteria for publications.
| Factor | Explanation | Scoring |
|---|---|---|
| Spatial extent | Spatial extent of the study area. Studies that considered one or a few small countries, or large administrative areas within large countries were classified as national-scale. Studies that considered a single very large country (such as USA, Brazil, India, or China) or most small countries within a single continent were classified as continental-scale. Studies that included most of the world’s countries or marine areas were considered global. | Subnational: excluded National: 1 Continental: 3 Global: 5 |
| Resolution | The resolution of a study was scored via the mean area of spatial units (grid cells, polygons) used in analysis. Studies using 1km2 grids were included in the 10,000km2 resolution group. | > 10,000km2: excluded 100km2 – 10,000km2: 1 1km2 – 100km2: 3 Finer than 1km2: 5 |
| Species data | The comprehensiveness of species data was scored via the number of higher taxa (such as birds, mammals, and plants) and number of species within each of those. When species from multiple higher taxa were used in a single study, their scores were summed. To make species data comparable with other criteria, summed scores were scaled by dividing by 3, making maximum points for a single study 5. | Each higher taxon with 1 – 10 species: 1 11 – 100 species: 2 > 100 species: 3 Scores summed within study. vSum is scaled to 0-5. |
| Ecosystem data | Ecosystem data was scored according to the number of different ecosystems used. Here, ecosystems were defined as all classifications of the landscape into higher-level ecological entities (ecosystems, environment types, ecological communities, habitat types, classes and domains, etc.). An extra point was given if the species richness of each ecosystem and/or ecological similarity between ecosystems were accounted for. | N ecosystem classes 1 – 25: 1 25 – 250: 2 > 250: 3 Similarity: 1 Species richness: 1 |
| Other data and factors | Did the study account for other important data and factors emphasized by the CBD? Points were given if costs, connectivity, ecosystem services, threats, dynamics, and habitat condition (naturalness) of an ecosystem were accounted for. | 1 point for each additional factor considered, max 6. |
We emphasize that the aim was not to evaluate the scientific quality of the publications, which could have variable objectives not directly linked to the present topic. Rather, the aim was to evaluate the extent to which the studies could potentially inform the CBD in achieving the global targets for protected areas. For example, there are many studies that focus on developing methods or theories - clearly such studies may be excellent science, but their direct information value for conservation decision-making is low. In addition, local studies that were excluded from the analysis are needed to guide local conservation actions, but are irrelevant for the large-scale planning that is the focus of the present study. Conversely, there can be studies that focus on other topics besides conservation (e.g. macro-ecology), but which produce results that could be interpreted post-hoc from the perspective of the CBD. The scoring is based on our judgment, and it is acknowledged that in some cases different decisions could have been made. We believe that different decisions regarding scoring would have affected the scores of individual studies but would not have changed the general conclusion.
We were also interested to know whether implementation was considered in the study or whether the work was of purely scientific nature. The search function of Adobe Acrobat Reader was used with terms “policy”, “decision-making”, “social”, “stakeholder”, “convention on biological diversity”, and “CBD” to identify linkages to conservation decision making from inside the publications. Matching phrases were counted from the abstract and main text, but hits in reference lists were excluded. All hits were manually evaluated for their relevance and were excluded if they lacked linkage to conservation decision-making (e.g., “social structure of a herd”).
ResultsThe literature search for years 2010-2012 identified a total of 705 publications (697 accessible to us), 207 of which included information potentially relevant for spatial conservation resource allocation. 94 of these 207 did not fulfill our minimum criteria set for extent, 16 for resolution, seven for data, and five for both extent and data, leaving 85 studies for detailed analysis. A search within high-profile journals since 2000 identified 13 articles fulfilling our minimum requirements for scientific scope, spatial extent, resolution, and data. Results below are given for the 2010-2012 data. Scoring data for these 98 publications is provided in the supplementary material online.
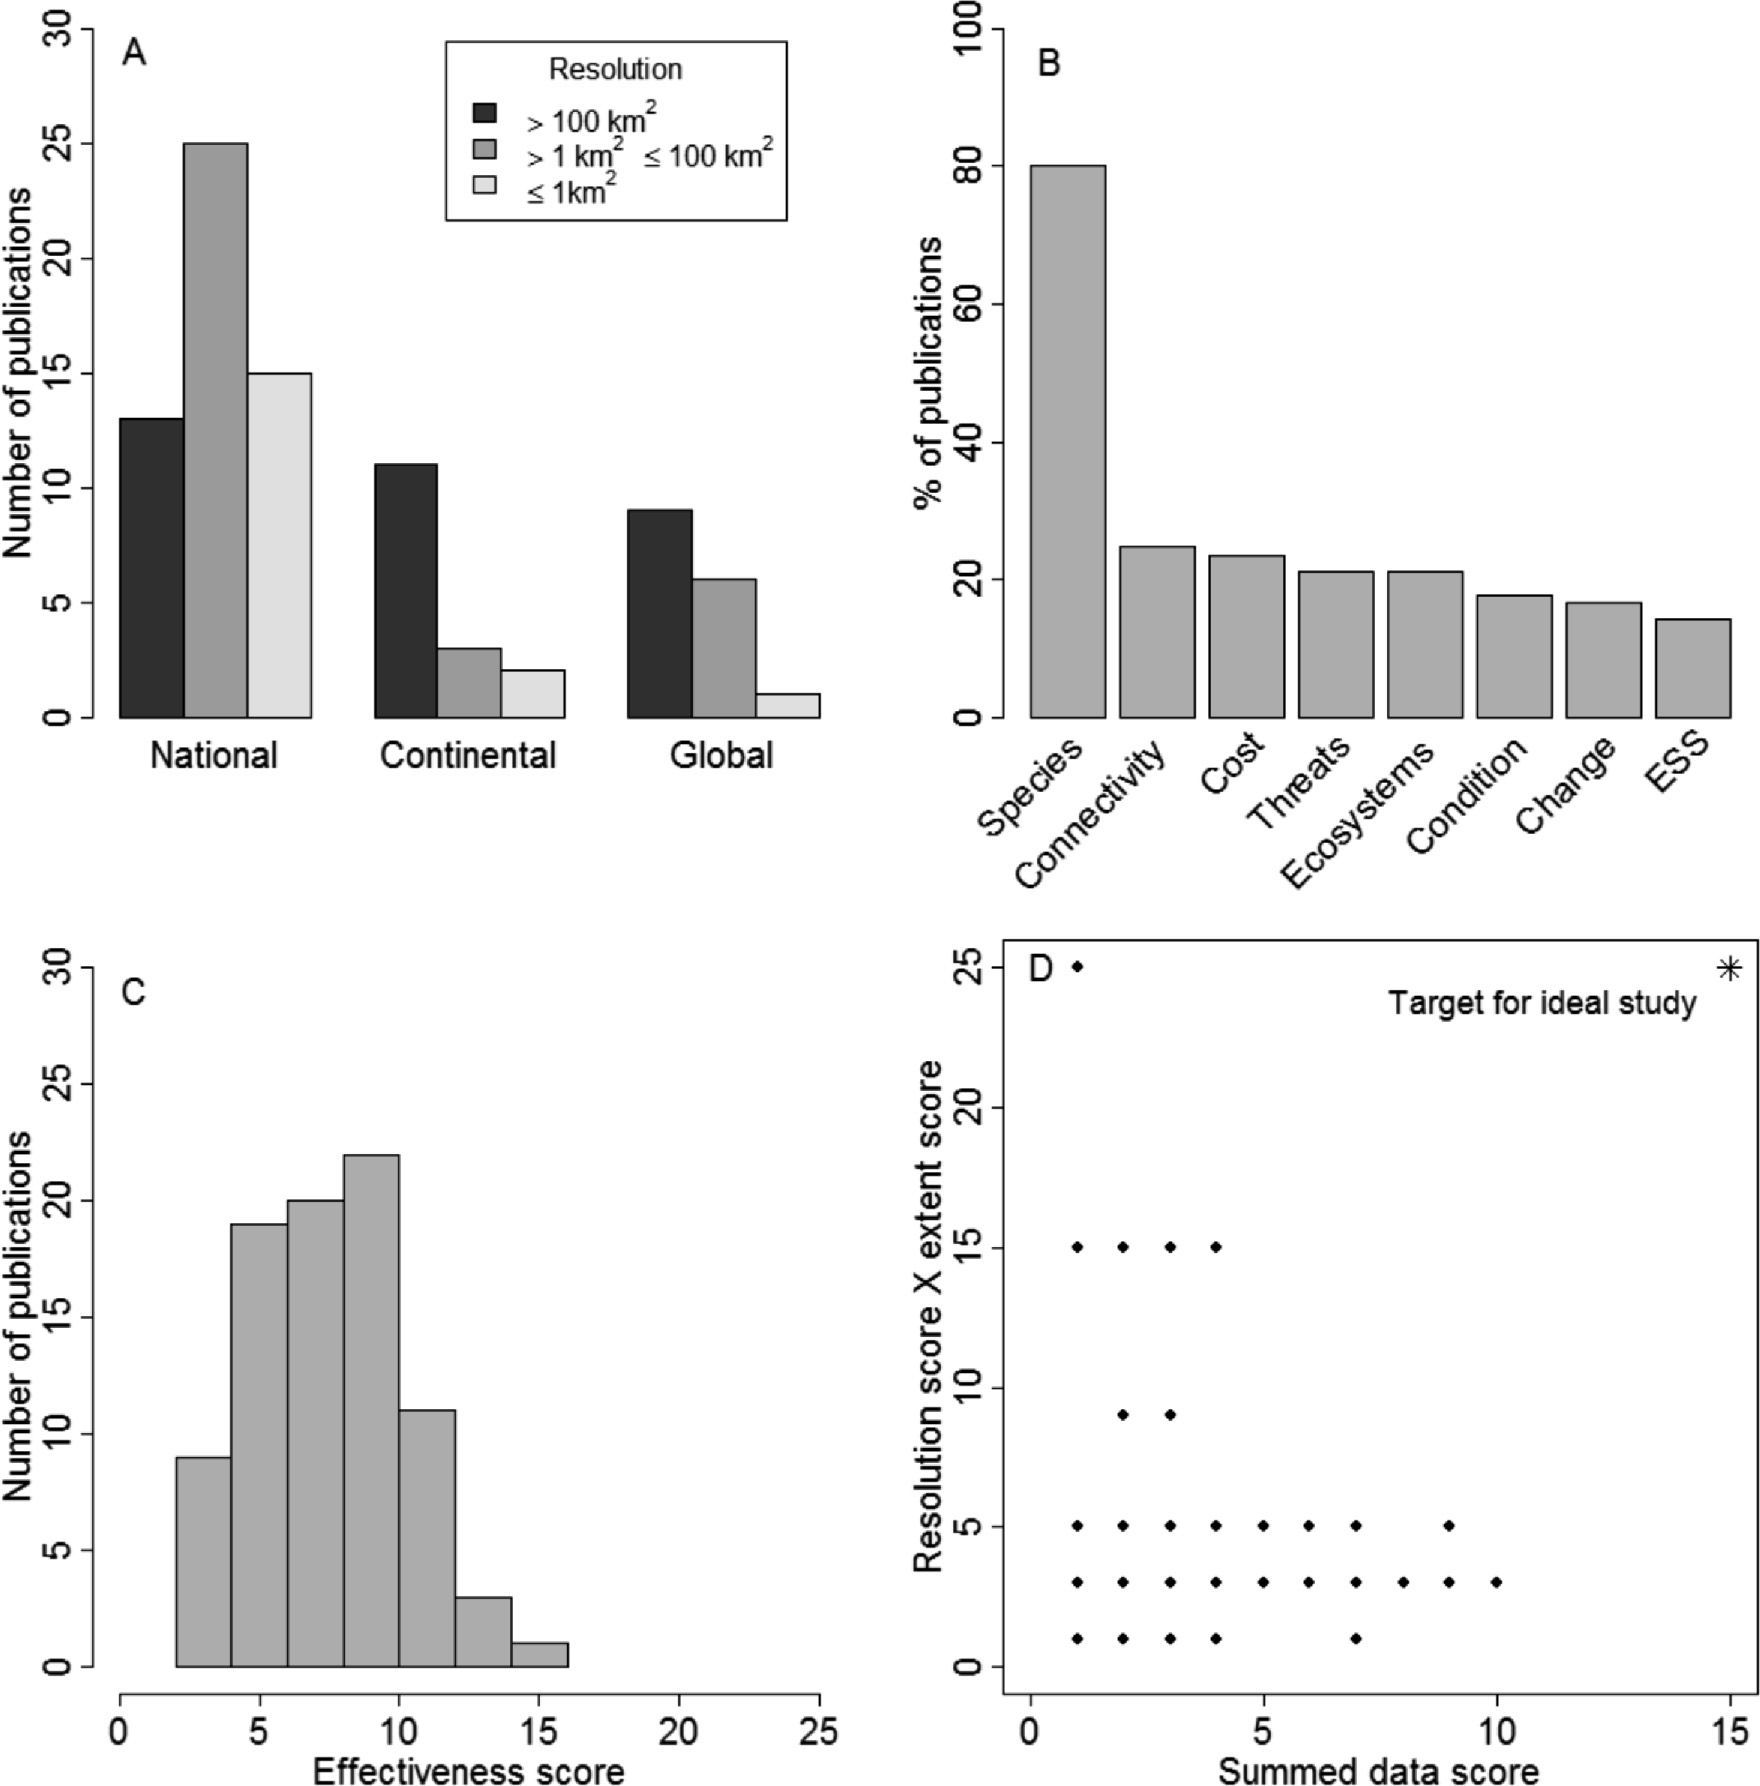
Most of the studies were conducted at a national scale (62%), leaving continental (19%) and global (19%) studies in the minority. 21% of the studies used planning units smaller than 1km2, 40% used planning units ranging from 1km2 to 100km2, and 39% used planning units larger than 100km2. Fine resolutions were much more common in narrow than in broad-extent studies (Fig. 1A). Species were most commonly used as biodiversity features (80%), and ecosystem data was the second most common (21% of the studies; Fig 1B). Only 7% of the studies used both ecosystem and species data. 65% of the studies using species as biodiversity features used data from a single higher taxon only, 18% from two to three taxa, and only 18% from four or more taxa. The most commonly used taxa were mammals (in 35% of the studies with species data), amphibians (27%), reptiles (26%), birds (21%), plants (15%), and fish (14%). 73% of the studies concentrated on terrestrial, 15% on freshwater, and 12% on marine environments. Only 22% of the studies that used ecosystem level data accounted for species richness of the different ecosystem types or pairwise similarity between ecosystem types, meaning that most studies simply utilized maps about the occurrences of different ecosystems, but that the properties of ecosystems were seldom accounted for in more detail. Only a small fraction of the studies used other data, such as connectivity, costs, or threats (Fig. 1B).
 Distribution of spatial extent and resolution classes. B) Frequency of different data types used in studies. ESS refers to ecosystem services, ’Change’ to whether temporal changes in feature distributions were accounted for, and ’Condition’ to whether the ecological intactness of the areas under selection was accounted for. C) Distribution of summed scores describing the relevance of studies for operational allocation of conservation action. D) The relationship between number of planning units (resolution score multiplied by extent score) and summed data score (excludes resolution and extent scores).")
– Summary of scores for the data set for 2010-2012. A) Distribution of spatial extent and resolution classes. B) Frequency of different data types used in studies. ESS refers to ecosystem services, ’Change’ to whether temporal changes in feature distributions were accounted for, and ’Condition’ to whether the ecological intactness of the areas under selection was accounted for. C) Distribution of summed scores describing the relevance of studies for operational allocation of conservation action. D) The relationship between number of planning units (resolution score multiplied by extent score) and summed data score (excludes resolution and extent scores).
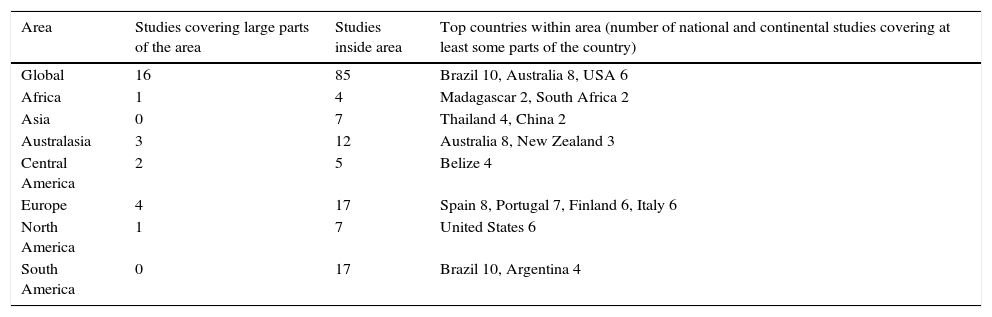
Study effort was very unevenly distributed between continents and countries (Table 2). Europe, South America, and Australia were identified as research hotspots, whereas only a few broad-extent studies had been conducted in continental Asia. Country-level studies were available for 26 countries, which is little over one-tenth of the world’s countries. According to the year 2010 statistics of the World Database on Protected Areas (2011), these countries had on average of 11.4% of their area protected, while the average across all countries was 11.2%. Country-level studies received on average 3.4 (maximum 16) points from summed resolution and data scores, indicating that most of the country-level analyses were based on very limited data.
Geographical distribution of study areas.
| Area | Studies covering large parts of the area | Studies inside area | Top countries within area (number of national and continental studies covering at least some parts of the country) |
|---|---|---|---|
| Global | 16 | 85 | Brazil 10, Australia 8, USA 6 |
| Africa | 1 | 4 | Madagascar 2, South Africa 2 |
| Asia | 0 | 7 | Thailand 4, China 2 |
| Australasia | 3 | 12 | Australia 8, New Zealand 3 |
| Central America | 2 | 5 | Belize 4 |
| Europe | 4 | 17 | Spain 8, Portugal 7, Finland 6, Italy 6 |
| North America | 1 | 7 | United States 6 |
| South America | 0 | 17 | Brazil 10, Argentina 4 |
Overall, none of the studies scored well in all of the criteria, with the majority ranging between 5 to 10 total points, out of 26 maximum (Fig. 1C). The highest score that a single study reached, according to our classification, was 15. Fig. 1D shows the relationship between data scores and the number of planning units, approximated with multiplication of extent and resolution scores. Most of the studies are concentrated near the axes and at the lower left corner of the graph, indicating either a low number of planning units or use of limited data. Studies combining a high number of planning units with comprehensive data were entirely absent.
The information needs of the Convention on Biological Diversity or on-the-ground implementation of the results were not widely discussed in the publications. Only three (4%) publications were identified that had more than three hits for search phrases “conventional on biological diversity” or “CBD” and 13 (15%) mentioned it once or twice. Three or more hits of implementation-orientated words were found in 22 (26%) studies, and one or two hits were found in 24 (28%) studies.
DiscussionWe found that, in recent scientific literature, there is a shortage of global-extent, fine-resolution, and data-rich studies of conservation priorities that could effectively support decision-making relevant to Aichi Target 11. This is critical, considering implementation of the global protection goals set in the CBD and the need to base decisions on scientific knowledge (CBD 2010). Gaps in research were found in all our focus areas: breadth of data, geographical coverage, and resolution. Special effort could be focused on areas and taxa that have so far received less attention. Conversely, conservation opportunities may be lost if better data and methods are waited for, aiming at best possible analyses (Grantham et al. 2009).
A wide variety of studies were included in our analysis: some simply mapped patterns of biodiversity (e.g. Huang et al. 2011; Kaschner et al. 2011; Lucifora et al. 2012), whereas others identified detailed priority areas using conservation planning software (e.g. Carwardine et al. 2010; Sharafi et al. 2012). However, none of them performed well across all evaluation criteria. For example, the only global extent study conducted at a 1km2 resolution used comparatively narrow data to provide a worldwide map describing functionality of ecosystems (Freudenberger et al. 2012). Conversely, the highest-scoring study in our analysis (Sharafi et al. 2012) utilized comparatively complex high-resolution data to develop complementarity-based conservation priorities, but the extent of this work was limited to the state of Victoria, Australia.
It is probable that the major reason for the limited number of highly relevant studies is that conducting a broad-extent analysis with fine resolution and comprehensive data is not an easy task. Even though purely theoretical studies were excluded from the analysis, many of the studies focused on improving the theory and methods of conservation prioritization. Many studies focused on specific scientific questions that could be addressed using simpler data. In both cases, implementation of conservation often received less attention. This is reflected in low effectiveness scores and absence of implementation-orientated phrases in articles.
Both data acquisition and computational analysis present major difficulties for broad-extent high-resolution studies. First, spatial analyses are restricted by data availability. Collecting data is expensive and time consuming, and therefore most of the studies depend on ready-made (publicly available) data. This is reflected in the scope of studies, as availability of data is taxonomically and geographically biased. We found that broad-extent studies typically used species data from one or a few taxa only - and a single taxon might not work well as a surrogate to biodiversity in general (Wolters et al. 2006; Eglinton et al. 2012). One method of improving the quality of the analysis in less surveyed areas is to develop ecosystem/ community-level prioritization methods that are based on models of species richness and turnover (Ferrier & Guisan 2006; Arponen et al. 2008). Nevertheless, only a small fraction of studies that utilized ecosystem data used any information about species richness or turnover between ecosystems. Likewise, costs of conservation were accounted for in only a few studies, even though their importance is generally recognized in scientific literature and the CBD (Naidoo et al. 2007; Wilson et al. 2006).
Second, more computational power is needed when the number of planning units or data layers is increased or more complex algorithms are used. The number of planning units becomes increased if the spatial extent of the analysis is increased or the resolution is made finer, leading to a tradeoff between these two considerations (Fig. 1B). Adding data layers also increases data and computational demands, which shows as generally simpler data in studies with large numbers of planning units (Fig. 1D). To reduce the computational load, it has been suggested that high priority sites could first be identified with coarse resolution analysis and more detailed studies could then be conducted within the most important cells (Larsen & Rahbek 2003). Nevertheless, resolution corresponding to operational needs is preferred whenever possible (Arponen et al. 2012).
While large extent analyses are informative for the high- quality implementation of Aichi Target 11, country-level analyses of conservation priority might be the most useful when designing national action plans. Even so, national analyses were only available for a minority of countries. Furthermore, many of the country-level studies did not use sufficient data and resolution that would support actual decision-making. We did not find a connection between protected area coverage within a country and the availability of country-level conservation prioritization studies. Nevertheless, the conclusion that country-level analyses are not useful for spatial conservation planning should not be drawn. This is because having high-quality information should primarily influence the quality of a national conservation area network, not its extent. And, in any case, moving from planning to on-the-ground implementation may take many years, and the effects of current availability of information would only be observed after a delay of several years. National analyses serve as an important stepping-stone between global assessments and local planning.
This study concentrated on recent publications that could provide the most up-to-date information on biodiversity, which are therefore most relevant for current and forthcoming decisions. Analysis of the 13 studies found from the high-profile journals during 2000-2009 suggests that broad-extent, high-resolution, and data-rich analyses have not been performed in great numbers during the past decade either. This assumption is further strengthened by the fact that broad-extent conservation prioritization analyses are dependent on data availability and computational power, both of which have rapidly improved over the last years. Using a longer time window for the literature search would definitely bring up some new studies of relevance, but would not likely change the overall conclusions. We might also have missed some analyses that have been reported in grey-literature only, but we believe that this is not a major shortcoming for studies with broad extent, high resolution, and comprehensive data. Such extensive studies, even if commissioned by NGOs or governmental agencies, would probably also result in scientific publication.
It is important that the results of biodiversity analyses are made publicly available and easy to access, so that they can be further utilized, evaluated, and improved. The full table of scientific studies evaluated here (see supplementary material online) contains detailed scoring information that can be used to identify studies with a specific focus of interest. In the very latest research (not included in our original literature search), there have been further analyses of global conservation priorities (e.g. Jenkins et al. 2013; Safi et al. 2013; Waldron et al. 2013), but these studies also remain limited either by resolution, spatial extent, or breadth of data.
Producing information on spatial conservation priorities is only one route to protecting biodiversity. Ultimately, the effectiveness and policy-relevance of spatial analyses will be weighted by how widely the provided information is utilized in on-the-ground planning (Knight et al. 2006). Knight and Cowling (2010) identified poorly-targeted science as one reason why conservation science does not adequately translate to implementation. According to this review, a gap between needs of practitioners and information provided by science reduces the applicability of research in real-world decision making related to Aichi Target 11. A stronger focus on implementation and accounting for practitioner’s needs in the planning of research would facilitate the utility of results (Knight et al. 2008). To reach the global target of protecting an ecologically representative set of marine and terrestrial areas, both high-quality spatial analyses relevant to decision-making and effective socially-guided investment into implementation are needed.
AcknowledgmentsWe thank the European Research Council (ERC-StG grant #260393, GEDA), the Academy of Finland Centre of Excellence Program 2012-2017 (grant 250444), and the University of Helsinki Graduate School LUOVA for support.
Supplementary materialSupplementary material associated with this article can be found, in the online version, at www.naturezaeconservacao.com.br.
articles


- Home
- All contents
- Publish your article
- About the journal
- Metrics