The Human Influence Index (HII) quantifies anthropogenic landscape pressures by combining eight measures of human influence: human population density, built environments, crop lands, pasture lands, lights, roads, railways and navigable waterways. The comparative influence of the HII components on cause-specific mammal mortality remains unexplored. Using a database of North American mammal cause-specific mortality, we compared the influence of these components on proportion of mammal mortality resulting from harvest, vehicle collision, predation, and overall anthropogenic mortality. Our dataset consisted of 487 studies that monitored the fates of 48,551 individuals across 70 species with 17,837 mortalities of known cause. For both adults and juveniles, human population density best explained proportion of mortality from anthropogenic causes and showed a positive relationship. Human population density also provided best model fit for adult harvest mortality at low HII values. Lights, built environments, and human population density explained similar variation in adult vehicle mortality, whereas human population density provided best fit for vehicle mortality of juveniles. Predation was negatively associated with human population density and provided best model fit for both age classes. Our work indicates that the effectiveness of conservation programs for North American mammals could be enhanced by reducing the negative consequences of human population density.

The Anthropocene is characterized by large-scale human-induced alterations to the planet. Between 1700 and 2007, croplands and pasturelands both increased fivefold globally, with concurrent declines in grasslands, wetlands, and forests (Ramankutty et al., 2018). Built environments, characterized by buildings and paved land, support human settlements and are projected to increase to a global expanse of up to 7.69 million km2 by 2030 (Seto et al., 2011). The loss of species and populations of wildlife has also become a defining trait of the Anthropocene. Extinction rates for vertebrates are more than 100 times baseline levels and currently 25% of the world’s mammal species are threatened with extinction (Hoffmann et al., 2010). Humans have caused a 50% reduction in geographic ranges of mammal species worldwide (Ceballos and Ehrlich, 2002) and one third of global terrestrial mammal mortality is directly caused by humans (Hill et al., 2019b).
The Human Influence Index (HII) combines eight measures of human influence to quantify the degree of human impact to the landscape (Sanderson et al., 2002). These eight measures include human population density, built environments, crop lands, pasture lands, navigable waterways, lights, roads, and railways (Sanderson et al., 2002). Human landscape impacts as measured by HII influence cause-specific mortality of mammals (Hill et al., 2020b). Major sources of direct anthropogenic mortality of mammals include harvest, vehicle collisions, and management removal (Hill et al., 2019b). For larger mammals, as the HII increases, the proportion of mortality due to direct human causes also increases (Hill et al., 2020b). Mortality from vehicle collisions increases with increasing HII, whereas harvest mortality declines (Hill et al., 2020b).
However, the individual components of the HII that drive changes in cause-specific mortality have not been thoroughly examined. Higher human populations might result in an increase in wildlife-vehicle collisions due to increasing traffic volume or an increased risk of human-wildlife conflict, leading to killing through management removal (Litvaitis and Tash, 2008). Crop lands might attract ungulates due to high quality forage, resulting in increased risk of harvest mortality (Vercauteren and Hygnstrom, 1998). In crop or pasture, animals might also be killed by humans in retaliation for causing livestock or crop damages. Landscape fragmentation resulting from land transformations might result in increased vehicle collisions when animals must travel further distances to meet resource requirements (Hussain et al., 2007).
Understanding how various human impacts influence cause-specific mammal mortality is important for predicting responses of mammal populations to increasing human development. Additionally, shifts in mortality from natural to human-caused sources can influence wildlife population demography, with implications for the ecosystem services provided by a species. We used a database of terrestrial mammal cause-specific mortality to compare the relative influence of each HII component on cause-specific mortality of North American mammals.
MethodsWe acquired cause-specific mortality data of North American mammals using CauseSpec, a database of global terrestrial vertebrate cause-specific mortality (Supporting information; Hill et al., 2019a). In all studies in the database, researchers used telemetry to track individuals and attempted to recover the carcass of every animal that died to determine a cause of death. In addition, only studies that delineate between direct anthropogenic or direct natural mortality sources are included in the database. We excluded studies where mortalities were not separated by adult and juvenile age classes (n = 68 studies). We recorded proportions of mortality for each study individually (i.e. number dying from the cause/number dying from all known causes) for the following causes: harvest, vehicle collision, predation (from other animals), and overall anthropogenic. Harvest included legal and illegal harvest (i.e. animal was harvested on a site where harvest of the species was not permitted or was harvested outside the hunting season) combined. Overall anthropogenic mortality consisted of all anthropogenic causes combined, including those that were not analyzed separately due to low frequency (e.g. management removal, fence entanglement, unspecified human causes).
We determined the HII variables for each study using either the 1993 (Sanderson et al., 2002) or 2009 (Venter et al., 2016) version. To match each study with the HII version closest in time to when the study was carried out, we calculated the midpoint of the range of years over which the study took place. Studies whose midpoint occurred during 1985–2001 were assigned the 1993 version whereas those whose midpoint occurred during 2002–2017 were assigned the 2009 version. Both versions have a 1 km2 resolution and were constructed using the same methodology. Human population density and nighttime lights are scaled continuously from 0 to 10 within each cell. Built environments, pasture, and crop lands values are based on the presence or absence of each land cover type in every cell. Roads are scored according to direct and indirect effects; 500 m either side of a road is given a score of 8, with a score of 4 exponentially decaying from 500 m away from the road out to 15 km. A score of 8 is given for the distance 500 m either side of a railway. Navigable waterways are given a pressure score of 4 exponentially decaying out to 15 km. HII values range 0–50 for each cell.
We scaled the area of landscape across which these variables were derived using the species mean home range, so that the area used in analysis would reflect differences in the amount of landscape that each species could be expected to encounter. Home ranges were obtained from PanTHERIA (Jones et al., 2009). We assumed the home range estimates to be a circle and determined the radius of each. We then constructed a circle around the geographic coordinates of the study site center, as defined in the source manuscript, quadrupling the home range radius to account for the fact that not all individuals in an area would share an overlapping home range (Bogoni et al., 2018; Maffei and Noss, 2008). If a quadrupled home range had a radius less than 5000 m, we used 5000 m as the radius for the circle for the species to ensure that a large enough area was represented. We averaged each of the HII variables across the constructed circle described above, and centered and scaled the predictors before analysis.
We used the package ‘lme4’ (Bates et al., 2015) in R (R Core Team, 2020) to construct linear mixed effects models to compare the influence of HII components on logit-transformed proportion of mortality from each cause. We separated juveniles and adults for analysis because they are impacted to different degrees by these mortality sources (Hill et al., 2019b). Additionally, we wanted to account for species body mass in our models, because body mass influences susceptibility to many mortality sources (Hill et al., 2019b). However, it was not possible to adequately assign a body mass for juveniles because studies encompassed a range of developmental stages for a species; body mass was only included for adults and determined using PanTHERIA (Jones et al., 2009).
Many of the HII variables are highly correlated (i.e. |r| > 0.70). We therefore constructed models separately for each mortality source by combining each of the individual HII components with log-10 transformed body mass in grams for adults, and for juveniles we used HII components only. We included taxonomy as a nested random effect (order:family:genus:species) to control for phylogeny and weighted studies by the number of identified mortalities to ensure that individual studies did not disproportionately contribute to models. We calculated the sample size corrected Akaike’s Information Criterion (AICc) for each model and ranked models based on the difference in AICc values between each model and that with the lowest AICc (ΔAICc). Because our data were skewed towards study sites with low HII values, we performed a second analysis for adults using only studies that had an HII less than 20.
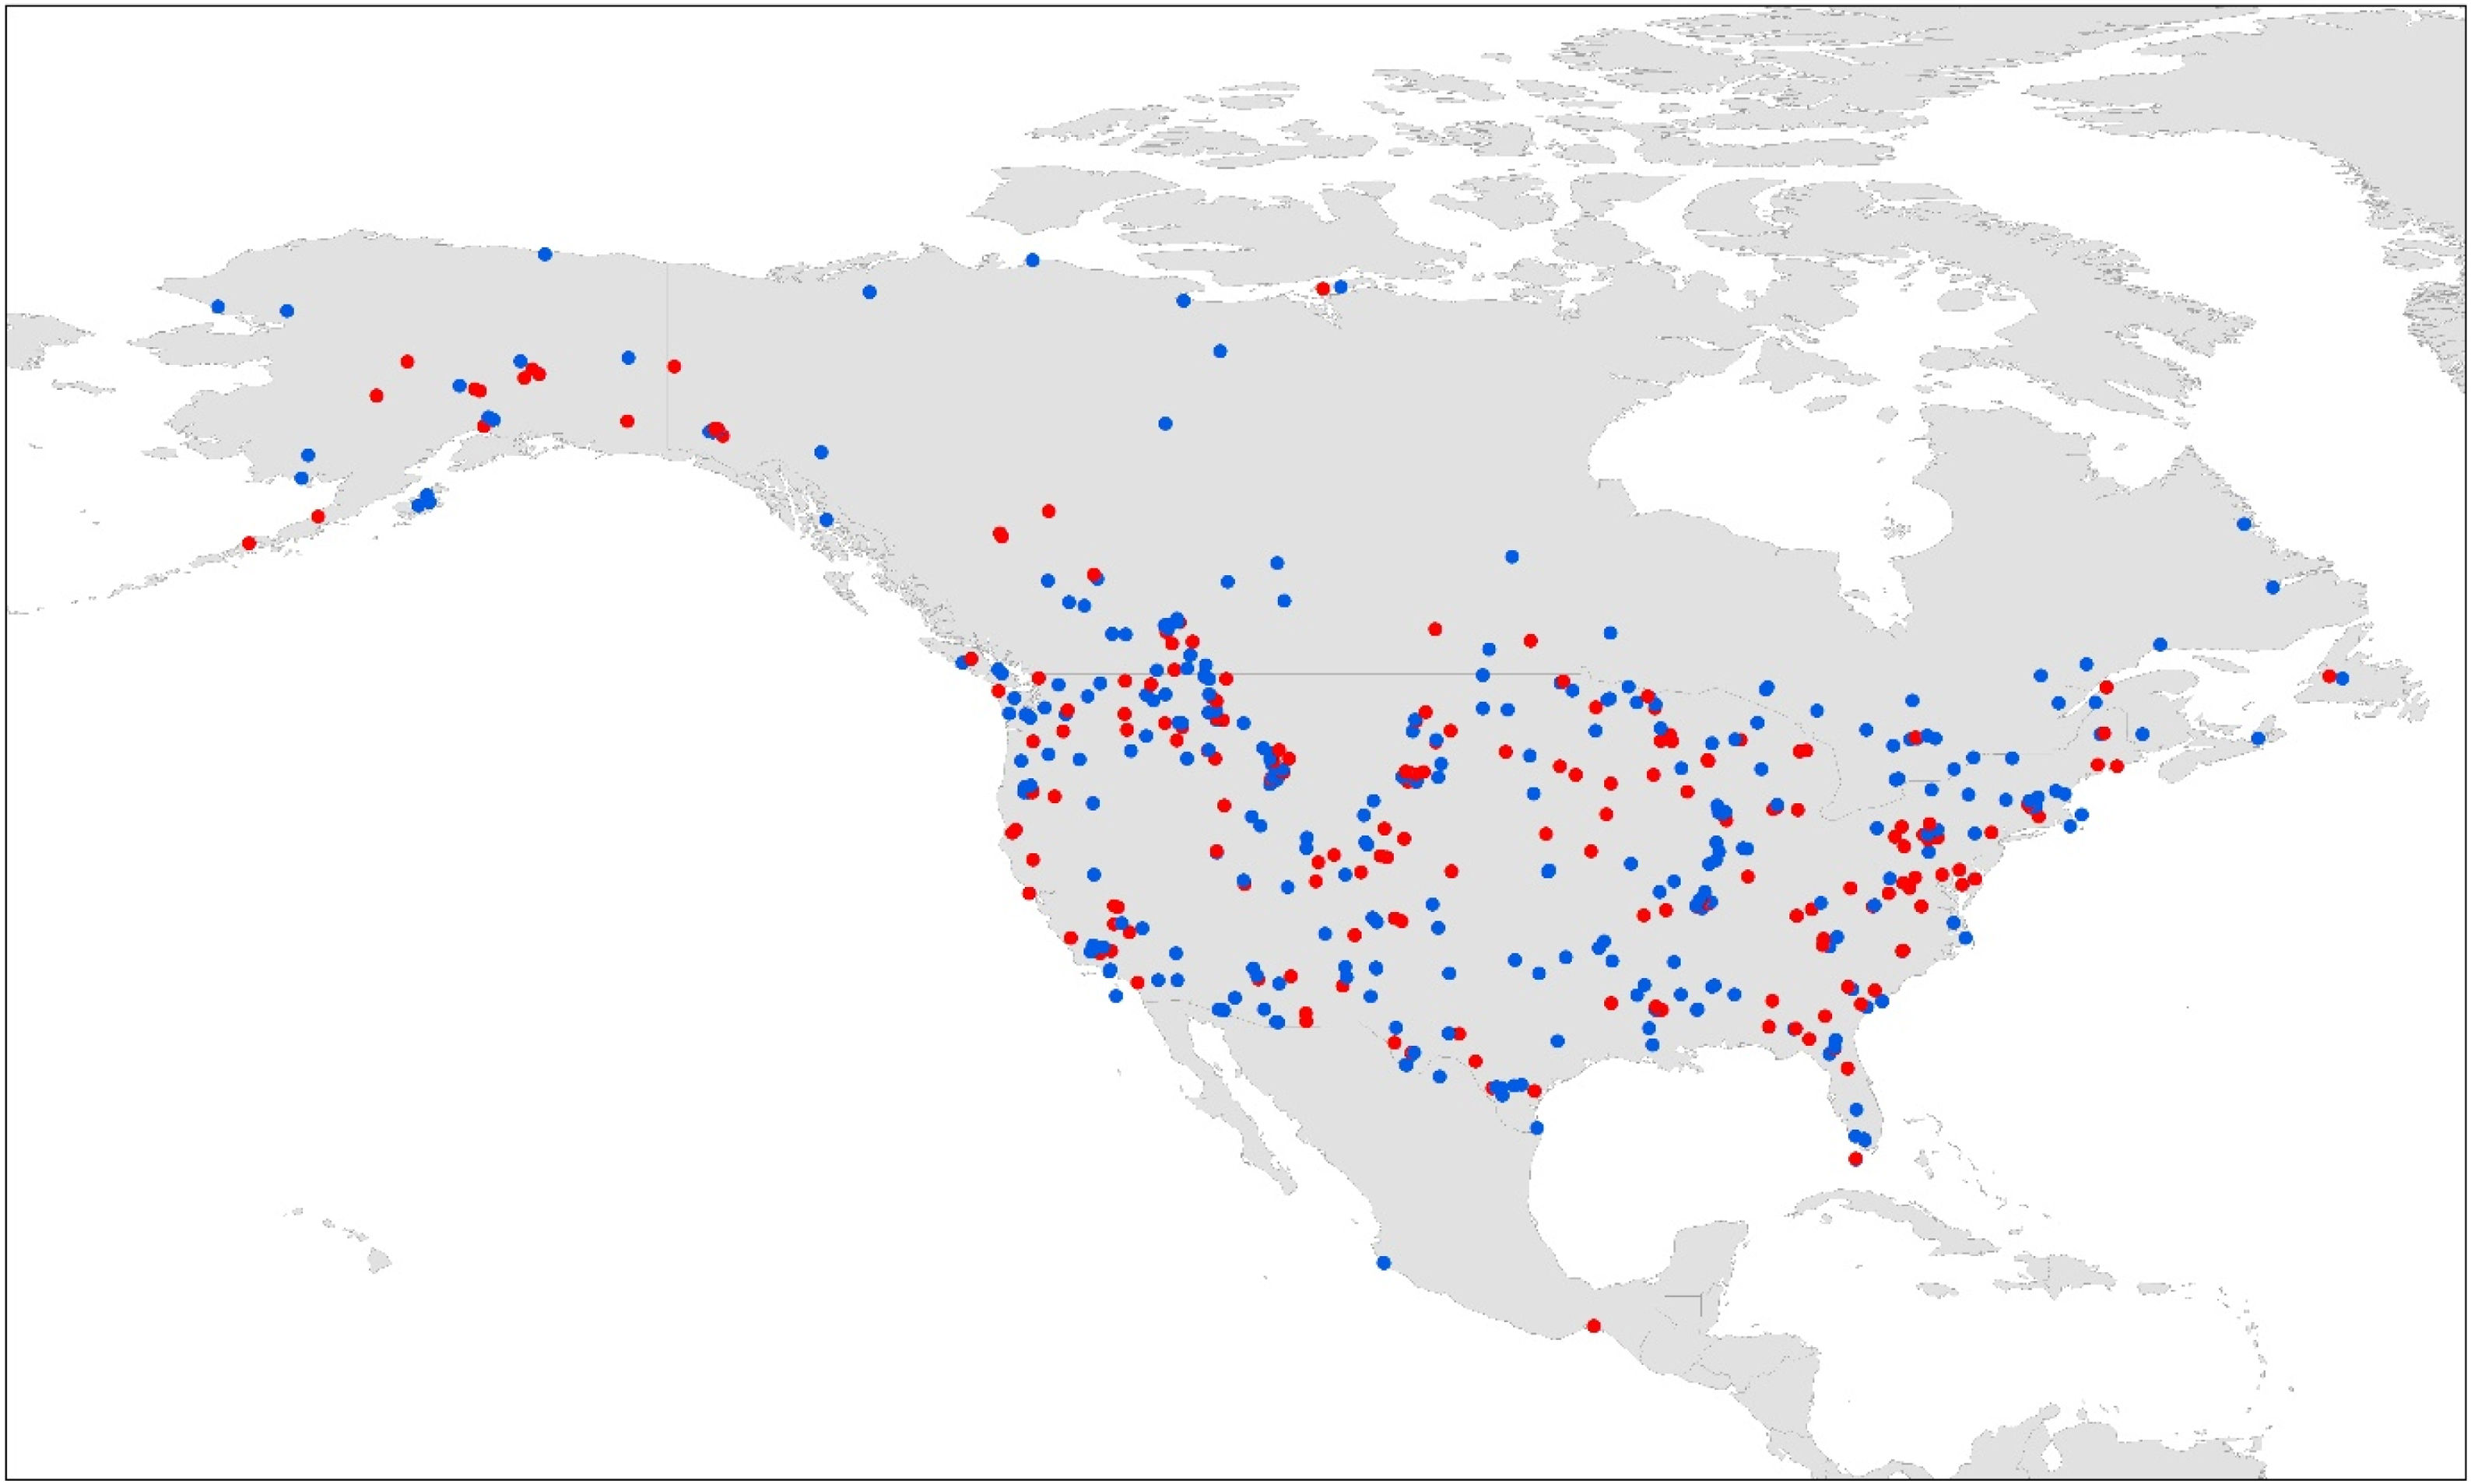
ResultsOur dataset consisted of 487 studies that monitored the fates of 48,551 individuals (Fig. 1). There were 20,364 mortalities and the cause of death was determined for 17,837 mortalities, 10,543 of which were adults and 7294 were juveniles (Supporting information). Composition of known cause mortalities was 23% harvest, 5% vehicle collisions, 49% predation, and 33% all anthropogenic causes combined. Cause-specific mortality was similar among the two portions of the dataset assigned to the different HII versions. Between the earlier and later data, harvest mortality declined slightly from 24% to 22% and overall anthropogenic mortality declined from 35% to 34%. Vehicle and predation mortality remained the same at 5% and 48%, respectively.
 and juvenile (red circles) North American mammals used in analysis.")
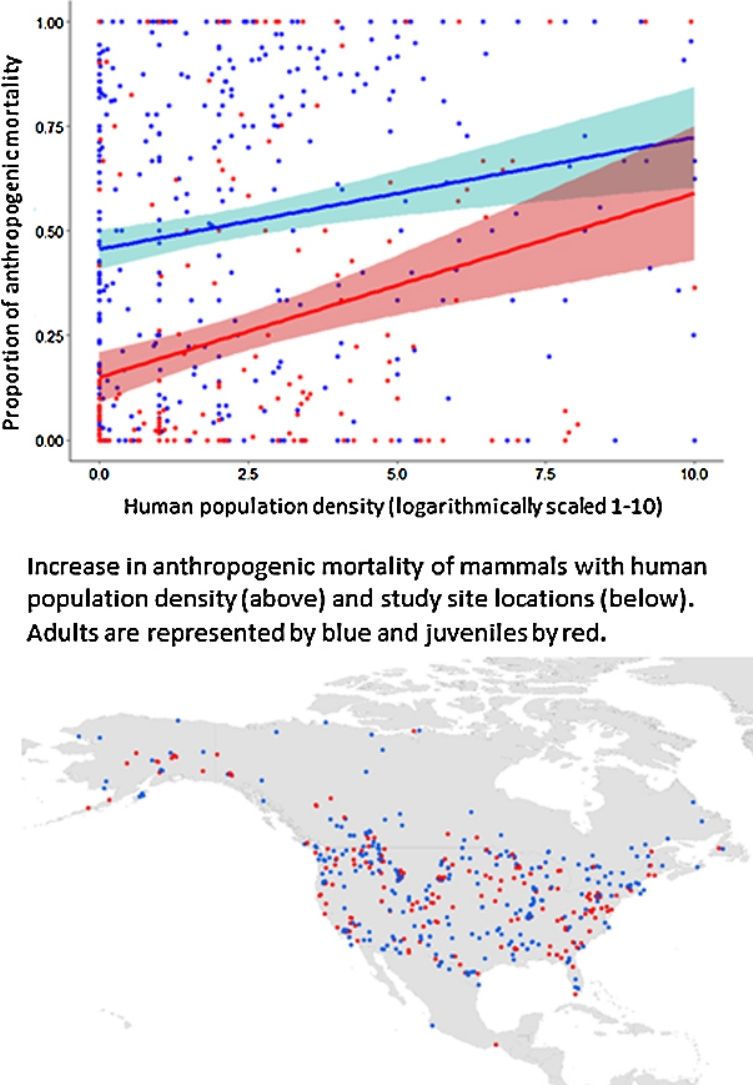
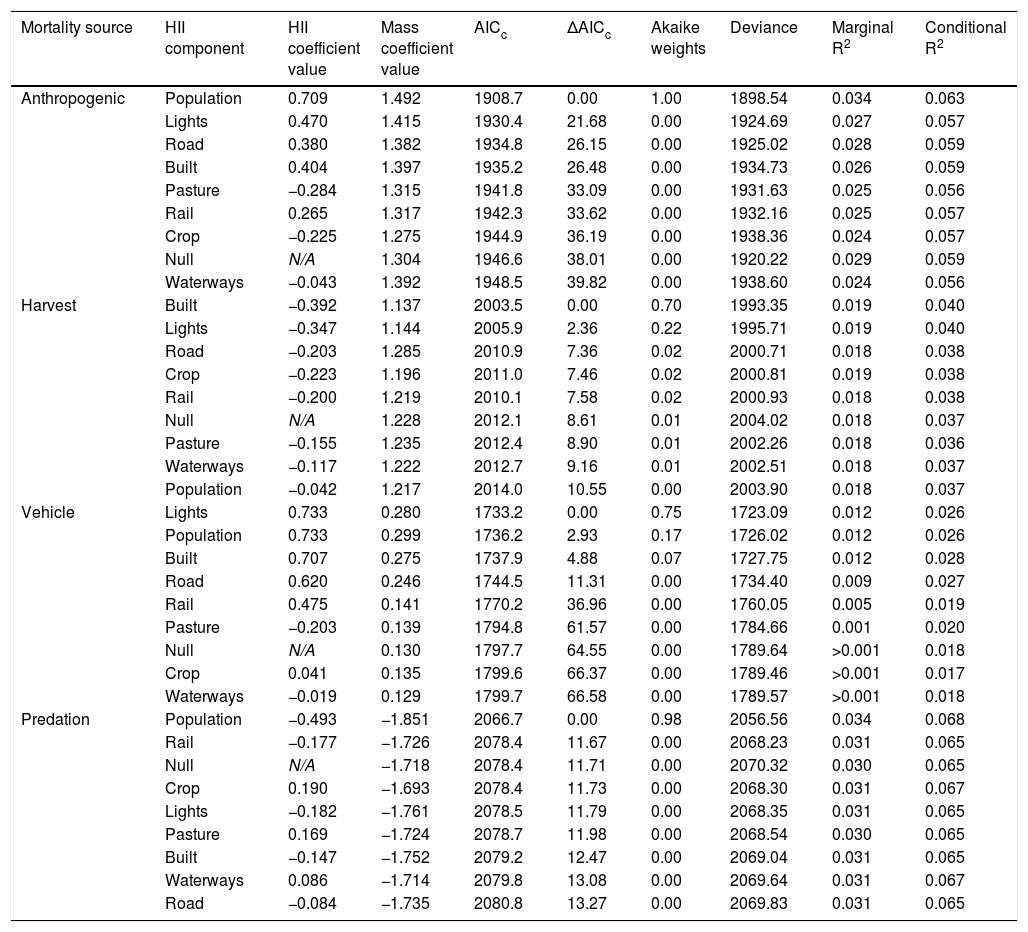
After controlling for taxonomy and body mass, human population density provided the best fit for anthropogenic mortality of adults (β = 0.709; AICc = 1908.7; R2 = 0.034; Fig. 2, Table 1), followed by lights (β = 0.470; AICc = 1930.4; ΔAICc = 21.68; R2 = 0.027) and roads (β = 0.380; AICc = 1934.8; ΔAICc = 26.15; R2 = 0.028). Anthropogenic mortality was positively associated with each of these variables. Harvest mortality was best explained by built environments (β = −0.392; AICc = 2003.5; R2 = 0.019), followed by lights (β = −0.347; AICc = 2005.9; ΔAICc = 2.36; R2 = 0.019), decreasing as these factors increased. Both anthropogenic and harvest mortality increased with increasing body mass. For models of these mortality sources, the larger centered and scaled coefficients for body mass compared to the HII component indicated a greater influence of body mass.
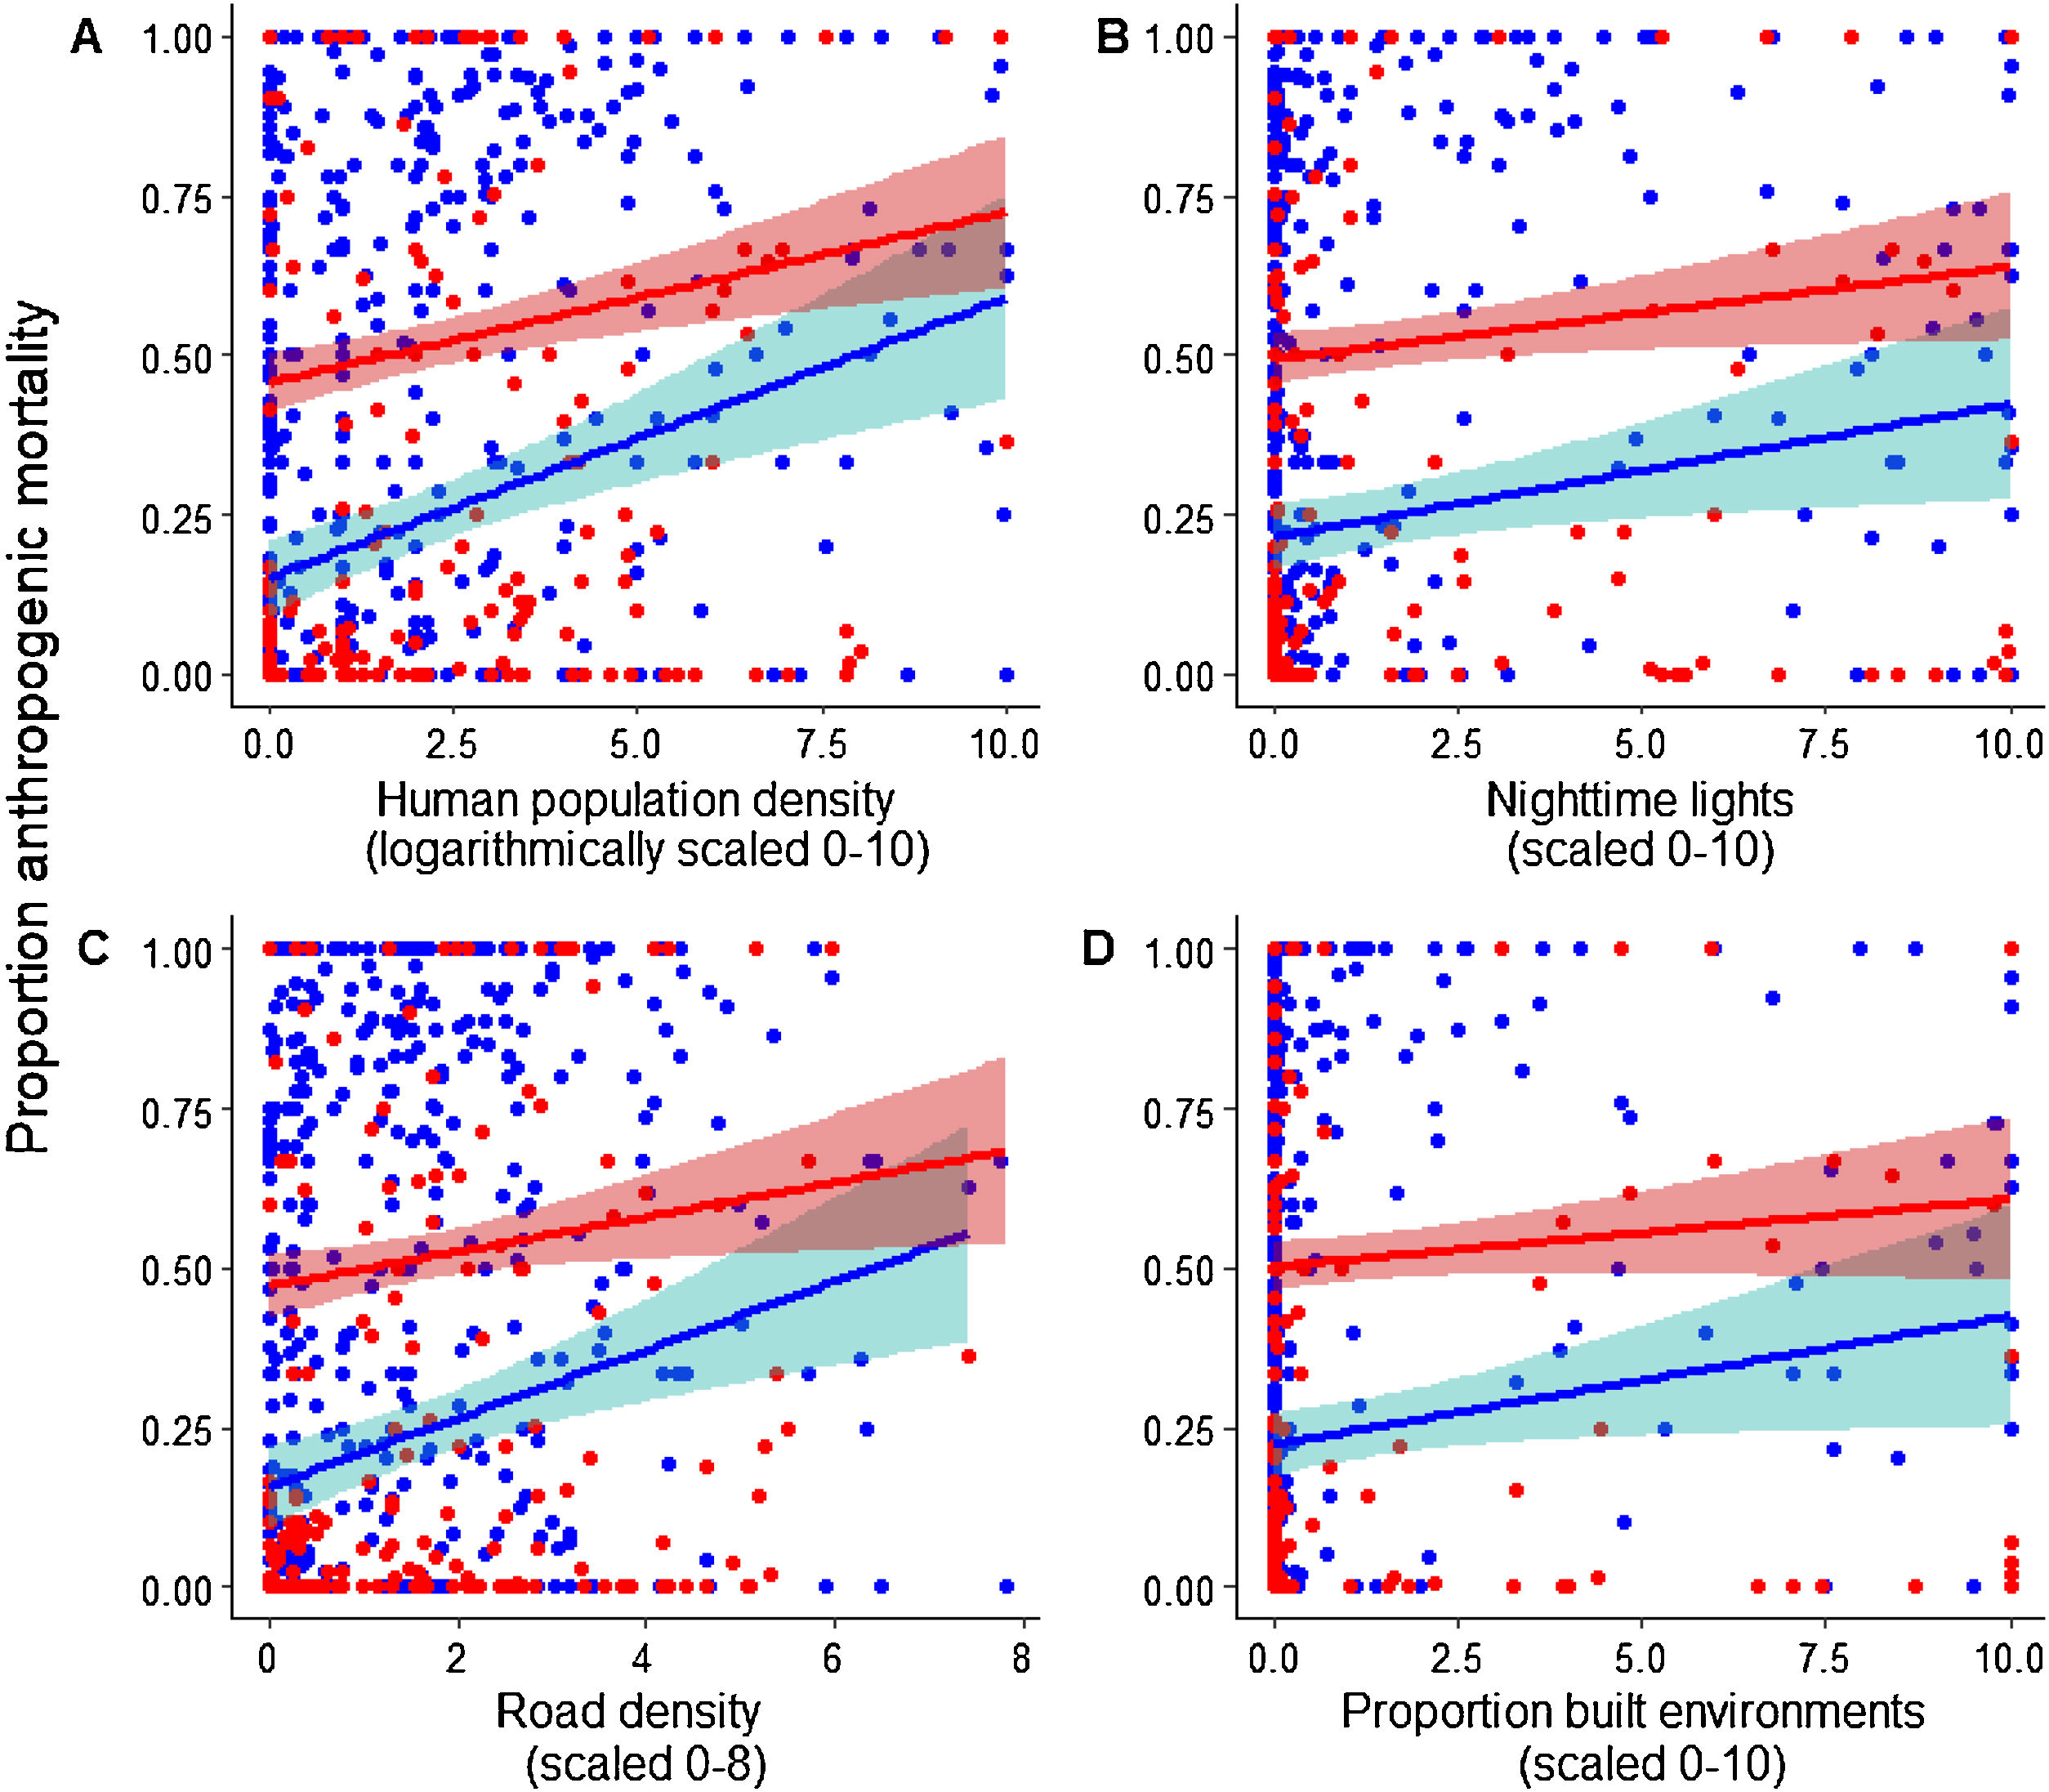
 with 95% confidence intervals of adult (blue) and juvenile (red) North American mammals as a function of (A) human population density, (B) nighttime lights, (C) paved road density, and (D) built environments. Data were compiled from 487 studies that monitored the fates of 48,551 individuals and reported 17,837 mortalities of known cause (10,543 adult mortalities and 7294 juvenile mortalities).")
Predicted changes in proportion of anthropogenic mortality (i.e., all human-caused sources combined) with 95% confidence intervals of adult (blue) and juvenile (red) North American mammals as a function of (A) human population density, (B) nighttime lights, (C) paved road density, and (D) built environments. Data were compiled from 487 studies that monitored the fates of 48,551 individuals and reported 17,837 mortalities of known cause (10,543 adult mortalities and 7294 juvenile mortalities).
Linear mixed effect model comparisons for proportion of cause-specific mortality of North American adult mammals (n = 10,543 mortalities) based on sample size corrected Akaike’s Information Criterion (AICc) with Akaike weights, deviance, marginal R2 and conditional R2 of each model. Each model included one of the 8 HII components and the average adult body mass for the species; null model included body mass only. Difference in AICc between each model and that with the lowest AICc are represented by ΔAICc. HII and mass coefficients are centered and scaled, and taxonomy was included as a nested random effect.
| Mortality source | HII component | HII coefficient value | Mass coefficient value | AICc | ΔAICc | Akaike weights | Deviance | Marginal R2 | Conditional R2 |
|---|---|---|---|---|---|---|---|---|---|
| Anthropogenic | Population | 0.709 | 1.492 | 1908.7 | 0.00 | 1.00 | 1898.54 | 0.034 | 0.063 |
| Lights | 0.470 | 1.415 | 1930.4 | 21.68 | 0.00 | 1924.69 | 0.027 | 0.057 | |
| Road | 0.380 | 1.382 | 1934.8 | 26.15 | 0.00 | 1925.02 | 0.028 | 0.059 | |
| Built | 0.404 | 1.397 | 1935.2 | 26.48 | 0.00 | 1934.73 | 0.026 | 0.059 | |
| Pasture | −0.284 | 1.315 | 1941.8 | 33.09 | 0.00 | 1931.63 | 0.025 | 0.056 | |
| Rail | 0.265 | 1.317 | 1942.3 | 33.62 | 0.00 | 1932.16 | 0.025 | 0.057 | |
| Crop | −0.225 | 1.275 | 1944.9 | 36.19 | 0.00 | 1938.36 | 0.024 | 0.057 | |
| Null | N/A | 1.304 | 1946.6 | 38.01 | 0.00 | 1920.22 | 0.029 | 0.059 | |
| Waterways | −0.043 | 1.392 | 1948.5 | 39.82 | 0.00 | 1938.60 | 0.024 | 0.056 | |
| Harvest | Built | −0.392 | 1.137 | 2003.5 | 0.00 | 0.70 | 1993.35 | 0.019 | 0.040 |
| Lights | −0.347 | 1.144 | 2005.9 | 2.36 | 0.22 | 1995.71 | 0.019 | 0.040 | |
| Road | −0.203 | 1.285 | 2010.9 | 7.36 | 0.02 | 2000.71 | 0.018 | 0.038 | |
| Crop | −0.223 | 1.196 | 2011.0 | 7.46 | 0.02 | 2000.81 | 0.019 | 0.038 | |
| Rail | −0.200 | 1.219 | 2010.1 | 7.58 | 0.02 | 2000.93 | 0.018 | 0.038 | |
| Null | N/A | 1.228 | 2012.1 | 8.61 | 0.01 | 2004.02 | 0.018 | 0.037 | |
| Pasture | −0.155 | 1.235 | 2012.4 | 8.90 | 0.01 | 2002.26 | 0.018 | 0.036 | |
| Waterways | −0.117 | 1.222 | 2012.7 | 9.16 | 0.01 | 2002.51 | 0.018 | 0.037 | |
| Population | −0.042 | 1.217 | 2014.0 | 10.55 | 0.00 | 2003.90 | 0.018 | 0.037 | |
| Vehicle | Lights | 0.733 | 0.280 | 1733.2 | 0.00 | 0.75 | 1723.09 | 0.012 | 0.026 |
| Population | 0.733 | 0.299 | 1736.2 | 2.93 | 0.17 | 1726.02 | 0.012 | 0.026 | |
| Built | 0.707 | 0.275 | 1737.9 | 4.88 | 0.07 | 1727.75 | 0.012 | 0.028 | |
| Road | 0.620 | 0.246 | 1744.5 | 11.31 | 0.00 | 1734.40 | 0.009 | 0.027 | |
| Rail | 0.475 | 0.141 | 1770.2 | 36.96 | 0.00 | 1760.05 | 0.005 | 0.019 | |
| Pasture | −0.203 | 0.139 | 1794.8 | 61.57 | 0.00 | 1784.66 | 0.001 | 0.020 | |
| Null | N/A | 0.130 | 1797.7 | 64.55 | 0.00 | 1789.64 | >0.001 | 0.018 | |
| Crop | 0.041 | 0.135 | 1799.6 | 66.37 | 0.00 | 1789.46 | >0.001 | 0.017 | |
| Waterways | −0.019 | 0.129 | 1799.7 | 66.58 | 0.00 | 1789.57 | >0.001 | 0.018 | |
| Predation | Population | −0.493 | −1.851 | 2066.7 | 0.00 | 0.98 | 2056.56 | 0.034 | 0.068 |
| Rail | −0.177 | −1.726 | 2078.4 | 11.67 | 0.00 | 2068.23 | 0.031 | 0.065 | |
| Null | N/A | −1.718 | 2078.4 | 11.71 | 0.00 | 2070.32 | 0.030 | 0.065 | |
| Crop | 0.190 | −1.693 | 2078.4 | 11.73 | 0.00 | 2068.30 | 0.031 | 0.067 | |
| Lights | −0.182 | −1.761 | 2078.5 | 11.79 | 0.00 | 2068.35 | 0.031 | 0.065 | |
| Pasture | 0.169 | −1.724 | 2078.7 | 11.98 | 0.00 | 2068.54 | 0.030 | 0.065 | |
| Built | −0.147 | −1.752 | 2079.2 | 12.47 | 0.00 | 2069.04 | 0.031 | 0.065 | |
| Waterways | 0.086 | −1.714 | 2079.8 | 13.08 | 0.00 | 2069.64 | 0.031 | 0.067 | |
| Road | −0.084 | −1.735 | 2080.8 | 13.27 | 0.00 | 2069.83 | 0.031 | 0.065 |
Lights (β = 0.733; AICc = 1733.2; R2 = 0.012) provided the best fit for vehicle collisions, followed by human population density (β = 0.733; AICc = 1736.2; ΔAICc = 2.93; R2 = 0.012) and built environments (β = 0.707; AICc = 1737.9; ΔAICc = 4.88; R2 = 0.012), and each was positively associated with vehicle collisions. In contrast to anthropogenic and harvest mortality, body mass had less of an impact on vehicle collisions, as the mass coefficient was generally smaller than that of the HII component. Human population density provided the best fit for predation mortality of adults (β = −0.493; AICc = 2066.7; R2 = 0.034) and was negatively associated with it. Similar to anthropogenic and harvest mortality, mass had a larger coefficient in every model for predation mortality, suggesting a comparatively large influence of body mass. In contrast to these other mortality sources, however, predation mortality declined with increasing body mass. Although body mass tended to outweigh the HII component, null models consisting of body mass but no HII component generally provided poorer fit than those with HII components. The null model ranked 3rd for predation, 6th for harvest, 7th for vehicle, and 8th for anthropogenic mortality (out of 9 possible models).
There were 342 studies with HII < 20, which consisted of 9784 adult mammal mortalities of known cause (Supporting information). Model rankings and R2 values for this subset were generally similar to that of the entire dataset. Human population density provided best fit for anthropogenic mortality (β = 0.587; AICc = 1748.8; R2 = 0.005) and for predation mortality (β = −0.544; AICc = 1870.2; R2 = 0.032). In contrast to the entire dataset, human population density provided the best fit for harvest mortality (β = 0.347; AICc = 1797.7; R2 = 0.020) rather than built environments and showed a positive relationship. For vehicle mortality, roads provided best fit (β = 0.279; AICc = 1521.9; R2 = 0.002), but R2 values were low (≤0.002) for all models.
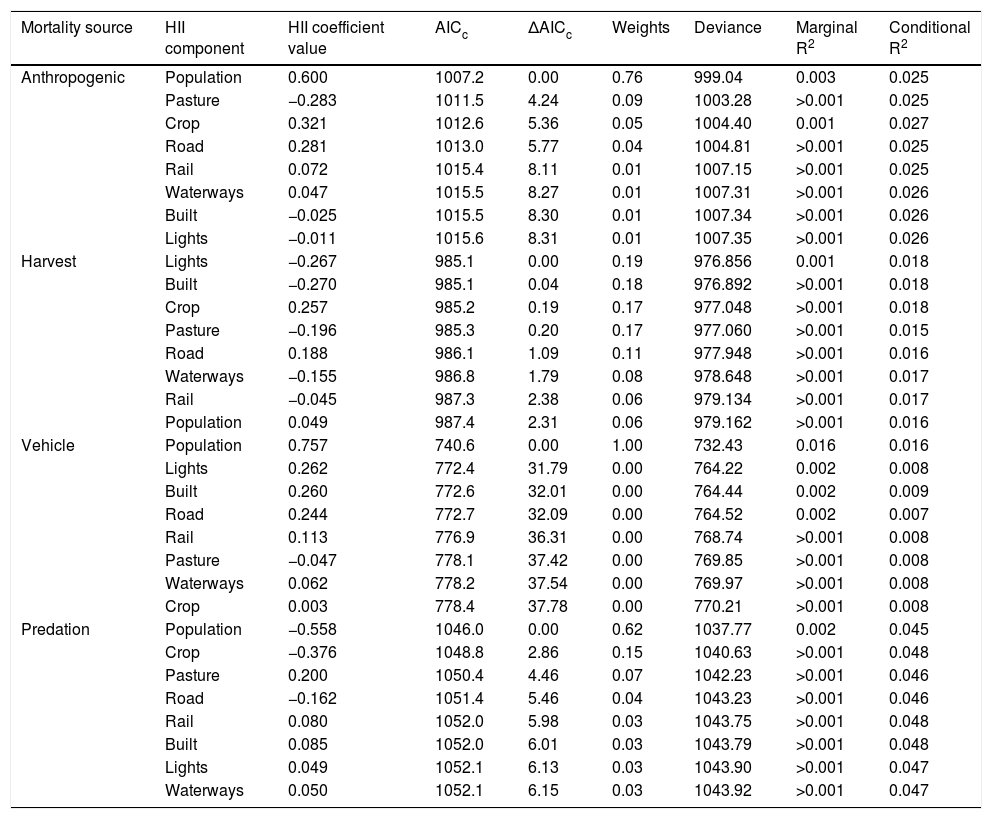
For juveniles, human population density provided the best fit for proportion of anthropogenic mortality (β = 0.600; AICc = 1007.2; Fig. 2; R2 = 0.003, Table 2). All of the variables provided similar fit for harvest mortality (AICc range 985.1–987.4). Human population density was positively associated with juvenile vehicle mortality and provided the best fit (β = 0.757; AICc = 740.6; R2 = 0.016). Human population density also provided the best fit for predation (β = −0.558; AICc = 1046.0; R2 = 0.002) and showed a negative relationship.
Linear mixed effect model comparisons for proportion of cause-specific mortality of North American juvenile mammals (n = 7294 mortalities) based on sample size corrected Akaike’s Information Criterion (AICc) with Akaike weights, deviance, marginal R2 and conditional R2 of each model. Each model included one of the 8 HII components. Difference in AICc between each model and that with the lowest AICc are represented by ΔAICc. HII coefficients are centered and scaled, and taxonomy was included as a nested random effect.
| Mortality source | HII component | HII coefficient value | AICc | ΔAICc | Weights | Deviance | Marginal R2 | Conditional R2 |
|---|---|---|---|---|---|---|---|---|
| Anthropogenic | Population | 0.600 | 1007.2 | 0.00 | 0.76 | 999.04 | 0.003 | 0.025 |
| Pasture | −0.283 | 1011.5 | 4.24 | 0.09 | 1003.28 | >0.001 | 0.025 | |
| Crop | 0.321 | 1012.6 | 5.36 | 0.05 | 1004.40 | 0.001 | 0.027 | |
| Road | 0.281 | 1013.0 | 5.77 | 0.04 | 1004.81 | >0.001 | 0.025 | |
| Rail | 0.072 | 1015.4 | 8.11 | 0.01 | 1007.15 | >0.001 | 0.025 | |
| Waterways | 0.047 | 1015.5 | 8.27 | 0.01 | 1007.31 | >0.001 | 0.026 | |
| Built | −0.025 | 1015.5 | 8.30 | 0.01 | 1007.34 | >0.001 | 0.026 | |
| Lights | −0.011 | 1015.6 | 8.31 | 0.01 | 1007.35 | >0.001 | 0.026 | |
| Harvest | Lights | −0.267 | 985.1 | 0.00 | 0.19 | 976.856 | 0.001 | 0.018 |
| Built | −0.270 | 985.1 | 0.04 | 0.18 | 976.892 | >0.001 | 0.018 | |
| Crop | 0.257 | 985.2 | 0.19 | 0.17 | 977.048 | >0.001 | 0.018 | |
| Pasture | −0.196 | 985.3 | 0.20 | 0.17 | 977.060 | >0.001 | 0.015 | |
| Road | 0.188 | 986.1 | 1.09 | 0.11 | 977.948 | >0.001 | 0.016 | |
| Waterways | −0.155 | 986.8 | 1.79 | 0.08 | 978.648 | >0.001 | 0.017 | |
| Rail | −0.045 | 987.3 | 2.38 | 0.06 | 979.134 | >0.001 | 0.017 | |
| Population | 0.049 | 987.4 | 2.31 | 0.06 | 979.162 | >0.001 | 0.016 | |
| Vehicle | Population | 0.757 | 740.6 | 0.00 | 1.00 | 732.43 | 0.016 | 0.016 |
| Lights | 0.262 | 772.4 | 31.79 | 0.00 | 764.22 | 0.002 | 0.008 | |
| Built | 0.260 | 772.6 | 32.01 | 0.00 | 764.44 | 0.002 | 0.009 | |
| Road | 0.244 | 772.7 | 32.09 | 0.00 | 764.52 | 0.002 | 0.007 | |
| Rail | 0.113 | 776.9 | 36.31 | 0.00 | 768.74 | >0.001 | 0.008 | |
| Pasture | −0.047 | 778.1 | 37.42 | 0.00 | 769.85 | >0.001 | 0.008 | |
| Waterways | 0.062 | 778.2 | 37.54 | 0.00 | 769.97 | >0.001 | 0.008 | |
| Crop | 0.003 | 778.4 | 37.78 | 0.00 | 770.21 | >0.001 | 0.008 | |
| Predation | Population | −0.558 | 1046.0 | 0.00 | 0.62 | 1037.77 | 0.002 | 0.045 |
| Crop | −0.376 | 1048.8 | 2.86 | 0.15 | 1040.63 | >0.001 | 0.048 | |
| Pasture | 0.200 | 1050.4 | 4.46 | 0.07 | 1042.23 | >0.001 | 0.046 | |
| Road | −0.162 | 1051.4 | 5.46 | 0.04 | 1043.23 | >0.001 | 0.046 | |
| Rail | 0.080 | 1052.0 | 5.98 | 0.03 | 1043.75 | >0.001 | 0.048 | |
| Built | 0.085 | 1052.0 | 6.01 | 0.03 | 1043.79 | >0.001 | 0.048 | |
| Lights | 0.049 | 1052.1 | 6.13 | 0.03 | 1043.90 | >0.001 | 0.047 | |
| Waterways | 0.050 | 1052.1 | 6.15 | 0.03 | 1043.92 | >0.001 | 0.047 |
Various components of anthropogenic development, such as human population density, land transformations, and transportation infrastructure exert pressures on natural landscapes. However, these environmental alterations vary in the extent to which they impact wildlife. Using a dataset of cause-specific mammal mortality across North America, we found that human population density consistently influenced susceptibility to several major sources of mammal mortality compared to other landscape attributes. However, the effect of landscape attributes on cause-specific mortality was generally smaller than the effect of species body mass, and our models overall explained a relatively small proportion of variability in cause-specific mortality.
Among the HII components, human population density had the greatest influence on anthropogenic mortality of adult and juvenile mammals. As human population density increases, animals may be more likely to come into conflict with humans and be killed as a result (Woodroffe, 2000). Higher population densities may result in increased traffic volume, increasing frequency of vehicle collisions (Litvaitis and Tash, 2008). Mammals can minimize encounters with humans by adjusting activity patterns (Bateman and Fleming, 2012), but most of our data was from areas where HII was relatively low. As a result, these animals may have had minimal experience with humans and may thus be especially vulnerable to the impacts of greater human population densities. Built environments best explained adult harvest mortality and showed a negative relationship, likely due to lack of suitable hunting areas where built environments are common (e.g. Gosselink et al., 2007). Considering only the sites with lower HII values, however, human population density best explained harvest mortality. Across these sites, the prevalence of built environments is likely low overall, leading human population density to have a stronger effect, with hunting prevalence increasing as human population density increases. These differences suggest that the relative impact of anthropogenic pressures on cause-specific mortality may change over landscapes with varying levels of human influence. Crop lands and pastures were among parameters providing lowest model fit for harvest mortality, likely because the suitability of crop lands is dependent on the particular crop grown, leading animals to select for certain crops while avoiding others (Andelt and Andelt, 1981).
Similar to anthropogenic mortality, human population density had the greatest influence on predation mortality, but the relationship was the opposite. Human presence can alter predator-prey dynamics by deterring predators or by providing alternative food sources, causing predators to kill prey less frequently (Reshamwala et al., 2018). High human population densities may thus offer refuge from predation through predation release (Fischer et al., 2012). This negative relationship could have also been influenced by the bias in our dataset toward larger animals, as their predators are not likely to coexist with humans in areas of high human densities.
Our results indicate that infrastructure prevalence may influence vehicle mortality, as the top ranked models included lights, built environments and human population density, and all provided similar model fit. However, models for adult vehicle mortality had the lowest R2 values across the four mortality sources, suggesting a comparatively small effect of HII on vehicle mortality. Mortality from vehicle collisions may be more influenced by factors for which our models do not account such as habitat adjacent to a road and mitigation measures (Clevenger et al., 2001). In contrast, for juveniles, vehicle mortality models had the largest R2 values, and human population density was the top ranked model. Compared to adults, juveniles may experience higher vehicle mortality as the result of increased movement during natal dispersal and higher human population density may lead to greater traffic volume, increasing mortality risk (Lodé, 2000). With the exception of vehicle mortality, comparisons between adults and juveniles indicated largely similar comparative effects of HII on cause-specific mortality. However, the R2 values for juvenile models were lower than for adults due in part to the lack of body mass in juvenile models. Adults and juveniles are generally impacted in the same manner by landscape alterations in terms of cause-specific mortality, but the effect tends to be larger for adults compared to juveniles.
Some landscape pressures were consistently ranked among the lowest models for every mortality source. Waterways and railways are part of the HII because they provide human access, but people probably do not use them for transportation in North America enough to substantially influence direct mortality of mammals. There may be variability in the extent to which features like roads influence cause-specific mortality, but this differentiation is not considered in our analysis. Roads may have different effects on wildlife due to road width or configuration with the surrounding landscape (van Langevelde and Jaarsma, 2005). Additionally, minor roads may have a greater impact on wildlife compared to major roads, but only the latter are considered in our study (van Langevelde et al., 2009). Therefore, at smaller spatial scales where these nuances can be more accurately considered, roads may have an impact that is not apparent in our coarser large-scale analysis.
Body mass generally had a greater effect on mortality than the HII components. The positive relationship between both anthropogenic mortality and harvest with body mass occurs because hunters tend to harvest larger-bodied animals disproportionately, and larger animals are more likely to cause conflict with humans (Jerozolimski and Peres, 2003; Linnell et al., 1999). For predation, there was an inverse relationship with body mass because larger animals tend to have fewer predators (Sinclair et al., 2003). Similar to the comparative role of body mass and landscape factors we documented, there was no influence of protected area status on anthropogenic mortality of North American mammals, but a large influence of body mass (Hill et al., 2020a). Body mass may therefore outweigh the effects of landscape attributes on cause-specific mortality of mammals. However, models of body mass alone were consistently among the lowest ranked models for each set, indicating that the HII components accounted for consistent, albeit small, variations in mortality.
The low marginal R2 values in our models result in part from the data being collected by numerous researchers over the course of 30 years, producing inconsistencies in data collection and methodologies. Although we matched each study with the closest HII version, some landscape components may have changed between the study being carried out and the HII values recorded for that study location. Additionally, other factors may exert a stronger influence on cause-specific mortality than human landscape influences, such as hunter desirability (unrelated to body mass) or propensity to be considered a nuisance by humans (Barrett et al., 2019; de Andrade Melo et al., 2015). Furthermore, our dataset contains some biases that may have influenced the patterns we observed, such as differential likelihood of studying certain species and locations (Hill et al., 2019b).
Our results suggest that human population density has a slightly larger impact on anthropogenic mortality of mammals than do other human landscape pressures, at least in the cases for which the cause of mortality is known. Although human influences such as land transformations can cause mortality indirectly (Newell, 1999), they affect direct anthropogenic mortality to a somewhat lesser extent than human population density. As areas with little to no human presence become inhabited by people, direct anthropogenic mammal mortality would likely be marginally more influenced by human population density compared to other landscape factors measured by the HII. In areas with the least human presence, increases in human population density also have the greatest effect on harvest mortality. Many anthropogenic mortality sources impact different demographic groups of species compared with natural sources (Wright et al., 2006). As a result, increases in anthropogenic mortality resulting from greater human population density have the potential to influence wildlife population dynamics (Coltman et al., 2003).
Collectively our results suggest that conservation programs may benefit from a more explicit consideration of the effects of human population density. This is especially important as many areas deemed irreplaceable for vertebrate conservation contain high human population densities (Rondinini et al., 2006). Although establishing protected areas to conserve habitat is important for conservation, effective management may also entail limiting access by people to reduce anthropogenic mortality of mammals. Indeed, high visitation rates by people to protected areas can increase anthropogenic mortality and alter ecological processes (Seshadri and Ganesh, 2011). Therefore, coupling habitat protections with management of human access may be required to effectively reduce anthropogenic mortality of mammals.
Similarly, extinction risk in protected areas increases for species that are wider-ranging and thus more likely to come into conflict with people inhabiting reserve borders (Woodroffe and Ginsberg, 1998). However, effective wildlife management techniques such as legislation to protect mammals from killing, can reduce the negative effects of high human population density on mammals (Linnell et al., 2001). Legal protections may therefore may be an important management component to ensure the viability of mammal populations in close proximity to high human population density. A more refined understanding of the effects of humans on mammalian mortality will further our ability to dampen unintended outcomes. Overall, efforts to reduce direct anthropogenic mortality of mammals can be enhanced by mitigating the detrimental impacts of human population density as anthropogenic activities spread into natural areas.
Declaration of interestsThe authors declare that they have no known competing financial interests or personal relationships that could have appeared to influence the work reported in this paper.
The following is Supplementary data to this article:

